|
|
|
|
| 野崎達生による『鉱床学は面白い、資源の偏在性には意味がある!そしてたくさんの人達に恵まれてきたことに深謝』(2018/12)から | |
|
|
最終更新日:2019年12月9日
|
|
|
|
|
|
|
|
|
|||
|
リンク⇒こちら|
鉱床とは| 鉱床の分類| 鉱床成因論| 鉱化度| |
斑岩銅鉱床| カーボナタイト鉱床| 火山性塊状硫化物鉱床| ミシシッピーバレイ型鉛・亜鉛鉱床| 鉄酸化物銅・金鉱床| その他
|
鉱石|
鉱石の品位| |
海底鉱物資源|
鉱床学の本| |
|
|
地下(Underground、Subsurface)の資源(Resource)となる物質を多く含む岩石(Rock)を鉱石(Ore)と呼ぶ。鉱石が集まった場所を鉱床(Ore
Deposit、Mineral Deposit)と呼ぶ。鉱床について、それらの資源となる物質が濃集したメカニズム(Concentration Mechanism)を解明するための学問が鉱床学(Economic Geology、Ore Geology)である。従って、資源の探査(Exploration)や採掘(Mining)のためには必須の学問であり、また資源となる物質の性質等も明らかにする学問であるから選鉱(Dressing)や製錬(Smelting)にとっても重要である。ただし、化石燃料(Fossil Fuel)関係では、単なる鉱床学という名称は一般的に用いられないようである。 資源となる物質が濃集するには、液体状態(Liquid State)が最も効率が良い。鉱石は異常な岩石(Abnormal Rock)であるが、岩石の一種であるから、岩石の成因(でき方)(Rock Genesis)に類似させて考えれば、液体状態は『マグマ(Magma)』と『熱水(Heated Water、Hot Water、Hydrothermal)』である。これらは、火成作用(Igneous Activity)に伴って生成する。マグマの場合、普通の岩石を形成するのはケイ酸質(Siliceous)のマグマ本体であるが、鉱石を形成するのは水を主とする揮発成分(Volatile Constituent)の多いマグマである。一方、熱水の場合、このようなマグマに含まれていた水も存在するが、一般的にはマグマの熱によって熱水〔または場合によっては水蒸気(Water Vapor)も〕となった地下水(Groundwater)の循環(Cycle)によって鉱石が形成される場合が多い。熱水〔地表付近では温泉水(Hot Spring Water)とも呼ばれる〕は地下の岩石に含まれる物質を循環の間に溶かし込む。そして、地表部の低温・低圧条件下で、鉱石となるような物質を沈殿させる(Precipitate)。地下の割れ目(Fracture)などが熱水の通路(Passage)として適しているために、そのような場所に鉱石を沈殿させることが多い。いわゆる、鉱脈鉱床(Vein-type Deposit)である。目立った通路が無く、散点的に広範囲に存在すれば、交染鉱床(Disseminated Deposit)となる。 鉱床は、このように形状(Form)で分類されることもあるが、普通には鉱種(Ore-type)別〔元素(Element)別〕に分類される(Classify)ことの方が多い。例えば、金鉱床(Gold Deposit)とか、鉄鉱床(Iron Deposit)とか、銅鉱床(Copper Deposit)とかである。これは、研究者が特定の鉱種を対象に研究することが多いためである。 また、鉱床学は英語ではEconomic Geology(直訳すれば経済地質学)とされていることからも判るように、資源の開発(Exploitation)において経済的に採算がとれるかどうかが重要である。 なお、実際の開発(Development)のための学問は資源工学(Resource Engineering)などと呼ぶ。 |
|
|
|
|
|
|
| 松枝大治 氏 | 2019年9月22日 | 72 | ||
| 佐々木昭 先生 | 2017年8月30日 | 88 | ウィキペディア 死去ネット⇒まいり |
|
| 今井秀喜 先生 | 2015年5月17日 | 肝臓がん | 99 | |
| 鹿園直建 氏 | 2014年4月22日 | 虚血性心不全 | 67 | ウィキペディア |
| 飯山敏道 先生 | 2012年9月15日 | 肺炎 | 84 | ウィキペディア |
| 苣木浅彦 先生 | 2010年4月22日 | 肺癌 | 87 |
山口大学工学部学術資料展示館 ウィキペディア |
| 堀越 叡 氏 | 2009年10月16日 | 76 | ウィキペディア | |
| 広渡文利 先生 | 2007年7月24日 | 脳出血 | 82 |
マンガン鉱物と鉱石 【見る→】 ウィキペディア 死去ネット⇒まいり |
| 関根良弘 先生 | 2004年5月24日 | 80 | 【見る→】 | |
| 添田 晶 先生 | 1998年 | |||
| 立見辰雄 先生 | 1997年10月17日 | 肺炎 | 81 |
ウィキペディア 死去ネット |
| 片山信夫 先生 | 1997年3月4日 | 腎不全 | 87 | ウィキペディア |
| 吉村豊文 先生 | 1990年11月25日 | 85 | ウィキペディア | |
| 渡辺武男 先生 | 1986年12月18日 | 79 | ウィキペディア | |
| 宮久三千年 先生 | 1983年2月6日 | 喘息+急性肺炎 | 54 | ウィキペディア |
| 木下亀城 先生 | 1974年1月14日 | 77 |
ウィキペディア 死去ネット |
|
| 加藤武夫 先生 | 1949年4月23日 | 65 |
ウィキペディア 死去ネット |
| 鉱床とは(鉱床学も) |

|

|

|
|
| 野崎達生による『鉱床学は面白い、資源の偏在性には意味がある!そしてたくさんの人達に恵まれてきたことに深謝』(2018/12)から | |
| 鉱床の分類 |
鉱床の鉱石を構成する鉱物は、それぞれ、特定の条件下で生成しやすいので、鉱種ごとに代表的な鉱床のタイプ(型)が存在する。主な金属鉱物資源と非金属鉱物資源について、簡単な鉱種(鉱物)と鉱床の型の関係はこちらを参照。
Wikipedia(HP/2014/6)による『Ore』から |
|||||||||||||||||||||||||||||||||||||||||||||||||||||||||||||||||||||||
|
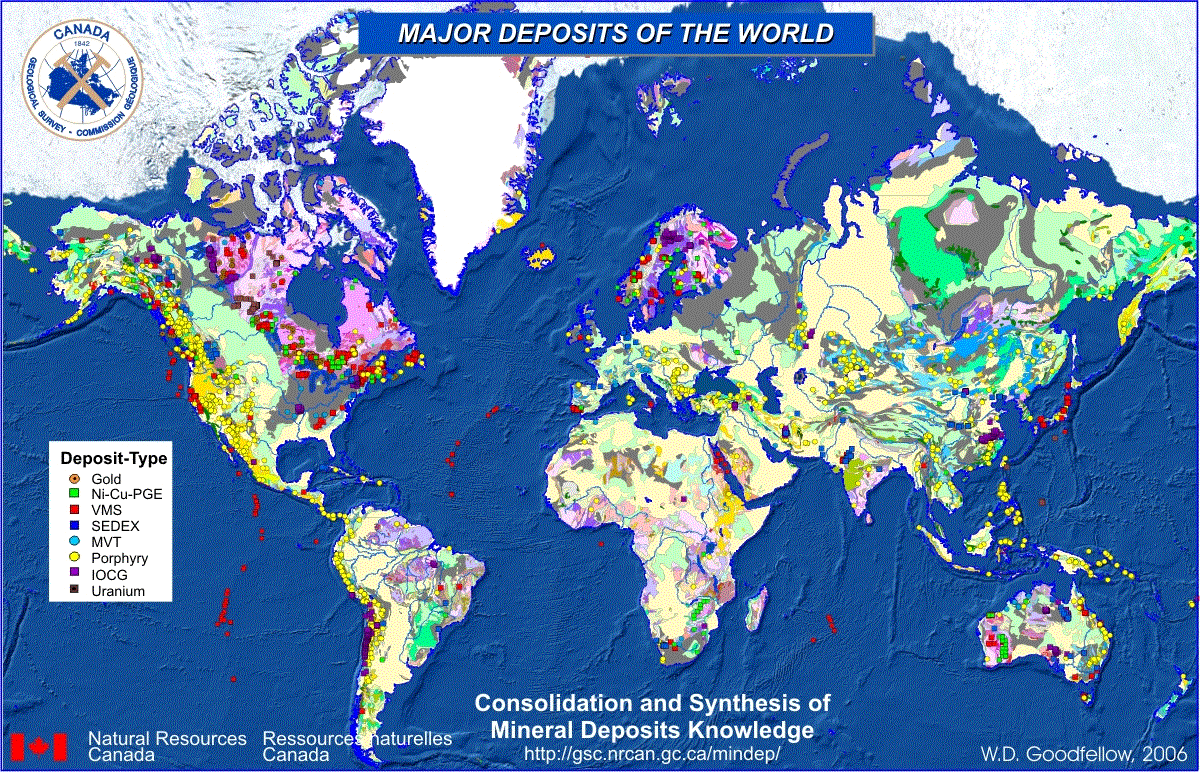 Figure 1: Map of world showing the distribution of major deposits plotted on digital elevation model with draped geology from Geological Survey of Canada, Open File 2915d, 1995. Data from the synthesis of ore deposits. Data plotted and diagrams prepared by W.D. Goodfellow. Natural Resources Canada > Earth Sciences Sector > Priorities > Geological Survey of Canada > Consolidation and Synthesis of Mineral Deposits Knowledgeの『World』の『Figure 1』から |
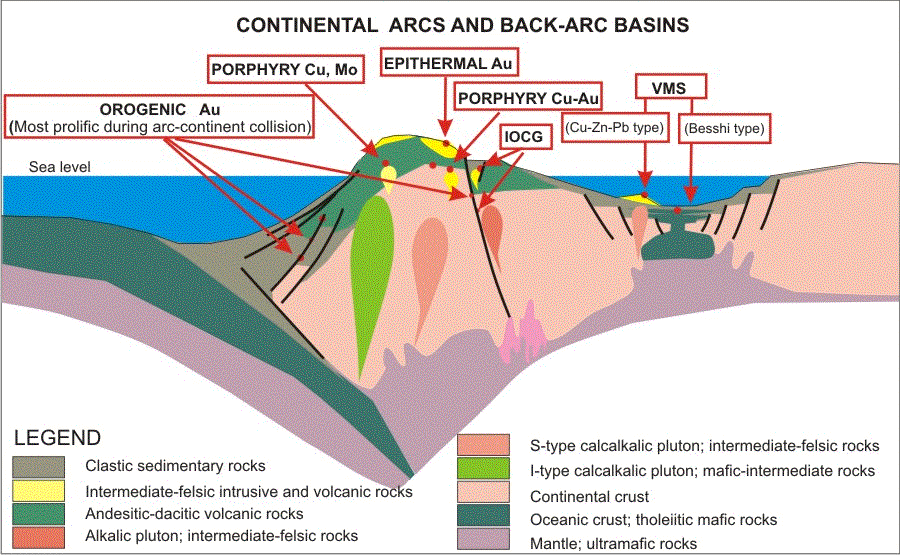 Figure 13 Schematic illustration of the major geological characteristics of major mineral deposit types that typically occur in continental arc and back-arc environments. (大陸弧と背弧環境に典型的に生成する主要な鉱床の主な地質学的特徴の図示) 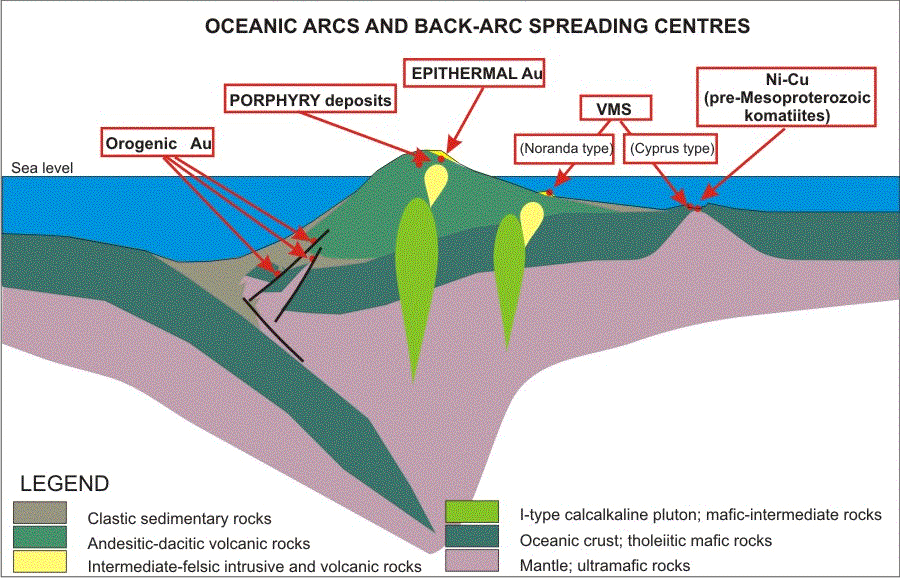 Figure 14 Schematic illustration of the major geological characteristics of mineral deposit types that typically occur in oceanic arc environment and back-arc spreading centres. (海洋弧環境と背弧拡大中心に典型的に生成する主要な鉱床の主な地質学的特徴の図示) 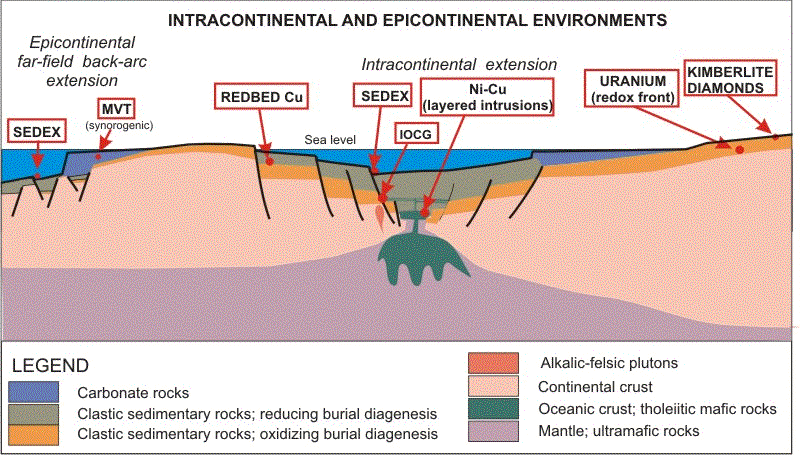 Figure 15 Schematic illustration of the major geological characteristics of mineral deposit types that typically occur in ore-forming environments within the interior regions of continents. (大陸の内部地域の鉱石形成環境に典型的に生成する主要な鉱床の主な地質学的特徴の図示) カナダ地質調査所(Geological Survey of Canada)による『Mineral Deposits of Canada Maps of deposits and resources(world)』から |
| Epigenetic |
Porphyry Large, low grade deposits usually associated with a porphyritic intrusive body. |
Cu-Mo |
| Cu (-Au) | ||
| Mo (-W) | ||
|
Skarn Mineral deposits formed by replacement of limestone by ore and calc-silicateminerals, usually adjacent to a felsic or granitic intrusive body. |
W-Cu (-Zn, -Mo) | |
| Zn-Pb-Ag (-Cu, -W) | ||
| Cu (-Fe, -Au, -Ag, - Mo) | ||
| Fe (-Cu, - Au) | ||
| Sn (-Cu, -W, -Zn) | ||
| Au (-As, -Cu) | ||
|
Vein Fracture filling deposits which often have great lateral and/or depth extent but which are usually very narrow. |
Hypothermal - Cu (-Au) | |
| Mesothermal - Cu-Pb-Zn-Ag-Au | ||
| Epithermal - Au-Ag (-Hg) | ||
|
Mississippi Valley Named for the region where they were first described, these deposits formed within porous carbonate rocks (limestone reefs or caves). They are Pb-Zn deposits with low Ag values. |
||
| Syngenetic |
Volcanic Massive Sulphide (VMS) These deposits formed as massive (over 60% sulphide) lens-like accumulations on or near the sea floor in association with volcanic activity. |
Felsic volcanic hosted - Cu-Pb-Zn-Ag-Au |
| Mafic volcanic hosted - Cu (-Zn, -Au) | ||
| Mixed volcanic/sedimentary - Cu-Zn (-Au) | ||
|
Sedimentary Massive Sulphide (Sedex) These are formed by hydrothermal emanations on or near the sea floor in association with the deposition of sedimentary rocks. |
Pb-Zn-Ag | |
| Ba | ||
|
Magmatic- layered mafic intrusion During the crystallization of a magma, usually mafic or ultramafic, heavy, metal-rich liquids settle and accumulate at specific sites, often at the base, within the intrusion. |
PGM (Platinum group metals) | |
| Chromite | ||
| Ni-Cu (-PGM) | ||
|
Placer Formed within sediments by the concentration of heavy resistant minerals (Au diamond, cassiterite) by stream or wave action. |
||
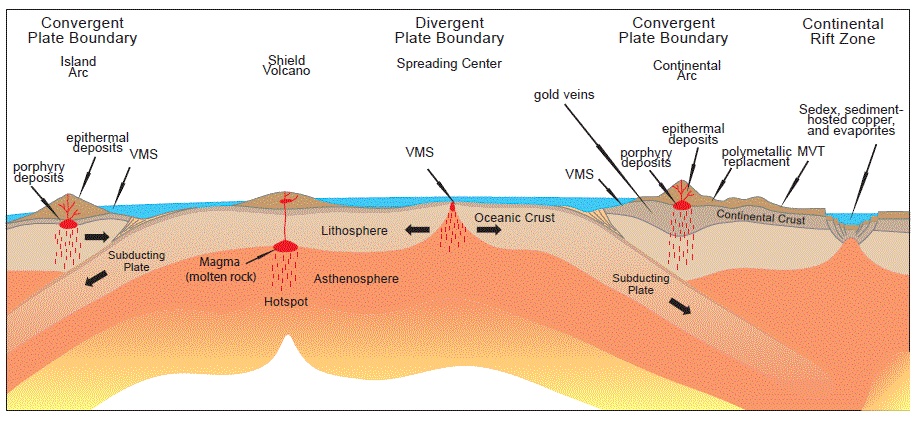 Figure 5 Diagram illustrating the plate tectonic setting in hich several ma or types of mineral deposits are formed The diagram shows a divergent plate boundary (spreading center) where tectonic plates are moving apart from each other and lava flows are extruded on the ocean floor forming a line of undersea mountains that encircle the Earth. Iceland, in the north Atlantic, is the tip of one part of this mountain range. Volcanogenic massive sulfide (VMS) deposits (described in the text) are an example of mineral deposits that form on the sea floor. Also shown are convergent plate boundaries where an oceanic plate is being subducted beneath a continental tectonic plate forming folded and faulted mountains (orogen) and volcanoes. The subduction of oceanic tectonic plates is accompanied by strong earthquakes and the generation and movement of tmagma (molten rock) and hydrothermal fluids that form a variety of mineral deposits, including porphyry copper deposits and associated gold and silver veins and polymetallic replacement deposits and associated gold and silver veins and polymetallic replacement deposits described in this report. Continental rift zones are areas where the crust is stretched (extended) forming linear depressions characterized by faults, volcanoes, sedimentary basins, and a variety of mineral deposit types including sediment-hosted (sedex) lead-sinc, sediment-hosted copper, and evaporite deposits. See text for further discussion. Modified from Kious and Tilling (1996). USGSのGeology and Nonfuel Mineral Deposits of Africa and the Middle Eastから |
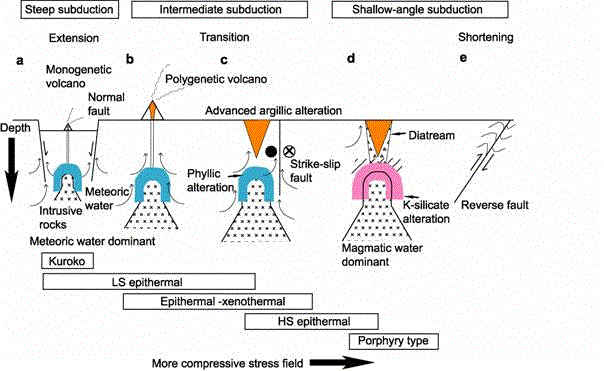 図14 沈み込み様式・広域応力場・火成活動様式および鉱床タイプとの模式的関係図 渡辺 寧氏によるプレートの沈み込み様式と鉱床タイプから |
|||||||||||||||||||||||||||||||||
梶原・正路(1997)による〔『エネルギー・資源ハンドブック』(1015-1020p)から〕 |
||||||||||||||||||||||||||||||||||||||||||||||||||||||||||||||||||||||||||||||||||||||||||||||||||||||||||||||||||||||||||||||||||||||||||||||||||||||||||||||||||||||||||||||||||||||||||||||||||||||||||||||||||||||||||||||||||||||||||||||||||||||||||||||||||||||||||||||||||||||||||||||||||||||||||||||||||||||||||||||||||||||||||||||||||||||||||||||||||||||||||||||||||||||||||||||||||||||||||||||||||||||||||||||||||||||||||||||||||||||||||||||||||||||||||||||||||||||||||||||||||||||||||||||||||||||||||||||||||||||||||||||||||||||||||||||||||||||||||||||||||||||||||||||||||||||||||||||||||||||||||||||||||||||||||||||||||||||||||||||||||||||||||||||||||||||||||||||||||||||||||||||||||||||||||||||||||||||||||||||||||||||||||||||||||||||||||||||||||||||||||||||||||||||||||||||||||||||||||||||||||||||||||||||||||||||||||||||||||||||||||||||||||||||||||||||||||||||||||||||||||||||||||||||||||||||||||||||||||||||||||||
金田・正路(1993)による〔『地球環境工学ハンドブック』から |
||||||||||||||||||||||||||||||||||||||||||||||||||||||||||||||||||||||||||||||||||||||||||||||||||||||||||||||||||||||||||||||||||||||||||||||||||||||||||||||||||||
佐藤(1979)による『地球の資源/地表の開発』から |
||||||||||||||||||||||||||||||||||||||||||||||||||||||||||||||||||||||||||||||||||||||||||||||||||||||||||||||||||||||||||||||||||||||
| 鉱床成因論 |
/Image1403.gif) FIG. 1. fS2-T diagram showing the variety of sulfide assemblages in epithermal deposits that reflect sulfidation state, from very low and low through intermediate to high and very high. Compositional fields of arc volcanic rocks, high-temperature volcanic fumaroles, magmatic-hydrothermal fluids, and geothermal fluids are shown, as discussed by Einaudi et al. (2003). Simplified from Einaudi et al. (2003; see their fig. 4 for mineral abbreviations). |
/Image1404.gif) FIG. 3. Schematic sections of end-member volcanotectonic settings and associated epithermal and related mineralization types. a. Calc-alkaline volcanic arc with neutral to mildly extensional stress state showing relationships between high- and intermediate-sulfidation epithermal and porphyry deposits (note that the complete spectrum need not be present everywhere). Early magmatic volatiles are absorbed into ground water within the volcanic edifice (shown here as a stratovolcano, but it may also be a dome setting) to produce acidic fluid for lithocap generation, over and/or supra-adjacent to the causative intrusion. Later, less acidic intermediate-sulfidation fluid gives rise to ntermediate-sulfidation mineralization, both djacent to and distal from the advanced argillic lithocap. Where the intermediate-sulfidation fluid flows through the leached lithocap environment, it evolves to a high-sulfidation fluid (Einaudi et al., 2003) to produce high-sulfidation veins or disseminated mineralization, depending on the nature of the structural and lithologic permeability. The high-sulfidation fluid may evolve back to intermediate-sulfidation stability during late stages, supported by paragenetic relationships and lateral transitions of high- to intermediate-sulfidation mineralogy. See text for details. b. Rift with bimodal volcanism and low-sulfidation deposits. Deep neutralization of magmatic volatiles, typically reduced, results in a low-sulfidation fluid for shallow low-sulfidation vein and/or disseminated mineralization and related sinter formation (cf. Henley and Ellis, 1983; Giggenbach, 1992; John, 2001). |
| Sillitoe・Hedenquist(2003)による『Chapter 18 Linkages between Volcanotectonic Settings, Ore-Fluid Compositions, and Epithermal Precious Metal Deposits』から | |
| 鉱床全体 |
|
環境省による『平成23年版 環境・循環型社会・生物多様性白書』から |
/Image1004.gif) Fig. 1. Structure and processes beneath an oceanic island arc (sources: Tatsumi and Eggins, 1995; Schmidt and Poli, 1998; Winter, 2001; Poli and Schmidt, 2002; Fumagalli and Poli, 2005). Primary hydrous basaltic arc magmas are derived from partial melting of the metasomatized asthenospheric mantle wedge. Mineral zones shown in the subducting plate indicate lower limits of stability of hydrous phases in the basaltic oceanic crust and peridotitic mantle lithosphere. Abbreviation: Ctd=chloritoid. |
/Image1005.gif) Fig. 3. Schematic section through a continental arc, showing the development of a MASH or “hot zone” at the base of the crust where basaltic arc magmas pool at their level of neutral buoyancy, differentiate, and interact with crustal rocks and melts. Evolved, less dense, andesitic magmas rise into the mid-to-upper crust where they pool at their new level of neutral buoyancy to form batholithic complexes. Along with volcanic structures, porphyry and epithermal deposits may form at shallower levels above these batholithic complexes where exsolved magmatic fluids ascend, cool, and interact with near-surface upper crustal rocks.Modified fromRichards (2003, 2005); sources: Hildreth andMoorbath (1988),Winter (2001), Annen et al. (2006), and Sillitoe (2010). |
/Image1006.gif) Fig. 4. Post-subduction tectonic environments conducive to the formation of porphyry and epithermal deposits by remobilization of previously subduction-modified lithosphere (modified from Richards, 2009). (a) Porphyry Cu±Mo deposits formed in normal arc settings; a continental arc is shown, but similar processes can occur in mature island arcs. (b-d) During post-subduction tectonic processes, previously subduction-modified sub-continental lithospheric mantle (SCLM) or lower crustal hydrous cumulate zones residual from previous arc magmatism (black layer) may undergo small-volume partial melting. Such magmas may remobilize Au as well as Cu±Mo left behind in residual sulfide phases by arc magmatism, leading to the potential formation of porphyry Cu±Au±Mo and alkalic-type epithermal Au deposits. Magmas may be characterized by high Sr/Y and La/Yb ratios due to the presence of hornblende (±garnet, titanite) in the amphibolitic lower crustal source rocks. See text for discussion. |
/Image1007.gif) Fig. 7. Schematic cross-section through a typical coupled arc batholith.cupola.volcanic system, with associated porphyry Cu±Au and linked high sulfidation Cu.Au epithermal deposits. Also shown are the thermal structure, fluid flow pathways and characteristics during the main stage of hydrothermal activity, and overlapping hydrothermal alteration zones. Propylitic alteration by circulating heated groundwaters can be assumed to affect all the supracrustal rocks in the field of view, with greatest intensity (epidote, actinolite) close to the intrusions, fading to background distally. Modified from Richards (2005); sources: Sillitoe (1973, 2010), Dilles (1987), Shinohara and Hedenquist (1997), Hedenquist et al. (1998), and Fournier (1999). |
| Richards(2011)による『Magmatic to hydrothermal metal fluxes in convergent and collided margins』から | |
/Image1405.gif) Figure 5 Geological time scale after the ICS (2000). Also shown are the ages of the various deposits and etallogenic provinces mentioned in the book. |
/Image1406.gif) Figure 2.17 Strong's model showing the relationship between level of granite emplacement and metallogenic character. (a) Pressure?temperature plot showing the approximate conditions where fluid-absent melting of amphibolite- (I), biotite- (II), and muscovitebearing (III) protoliths would occur, and the expected levels in the Earth’s crust to which melt fractions would rise adiabatically, as a function of the watersaturated solidus. (b) Schematic diagram illustrating the emplacement style and metallogenic character of granites formed under each of the conditions portrayed in part (a) (after Strong, 1988). |
/Image1411.gif) Figure 3.6 Various tectonic scenarios illustrating the mechanisms by which major fluid movements in the Earth’s crust take place. (a) Gravity-driven fluid flow in response to the creation of a hydrostatic head in an area of uplift. (b) Orogeny-driven fluid flow in response to rock compaction in a fold and thrust belt. (c) Thermally driven fluid flow in the ocean crust in response to high heat flow at mid-ocean ridges. (d) Thermally driven fluid flow in a permeable unit within a basin or rift. (e) Dilatancy- or fault-driven fluid flow along major, seismically active structural features by seismic pumping and fault valve mechanisms (modified after Garven and Raffensperger, 1997). |
/Image1412.gif) Figure 3.13 Base and precious metal concentrations in oreforming hydrothermal solutions, in each of five major categories of deposit type. Base metals include Cu, Pb, and Zn (filled dots), and precious metals comprise Au, Ag, and Hg (open circles). The numbers next to individual points or ranges refer to average concentrations or ranges in a variety of different situations, and are all after Seward and Barnes (1997). |
/Image1416.gif) Figure 6.1 Distribution of ore deposit styles, classified according to orogenic (upper set of histograms) and anorogenic/continental sediment-hosted metal deposits (lower set of histograms) as a function of time. The length of each histogram bar is an estimate of the proportion of ore formed over a 50 million year interval relative to the global resource for that deposit type. Periods of supercontinent amalgamation are shown as Pangea, Rodinia, and Nena, with decreasing levels of confidence further back in time. The diagram is originally after Meyer (1988) and modified after Barley and Groves (1992). |
/Image1418.gif) Figure 6.13 Occurrences (in terms of relative abundances) of a variety of different ore types with time and with respect to major Wilson tectonic cycles in the Phanerozoic (modified after Titley, 1993; with information from Nance et al., 1986; Larson, 1991). |
/Image1419.gif) Figure 6.14 Simplified illustrations of the major extensional tectonic settings and the ore deposit types associated with each (modified after Mitchell and Garson, 1981). |
/Image1420.gif) /Image1421.gif) Figure 6.15 Simplified illustrations of the major compressional tectonic settings and the ore deposit types associated with each (modified after Mitchell and Garson, 1981). |
| Robb(2006)による『Introduction to Ore-Forming Processes』から | |
| 鉱床各論 |
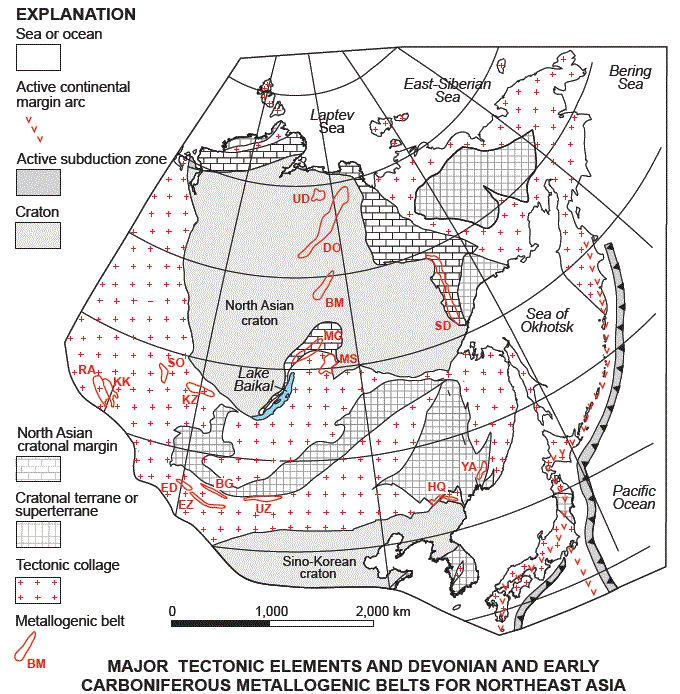
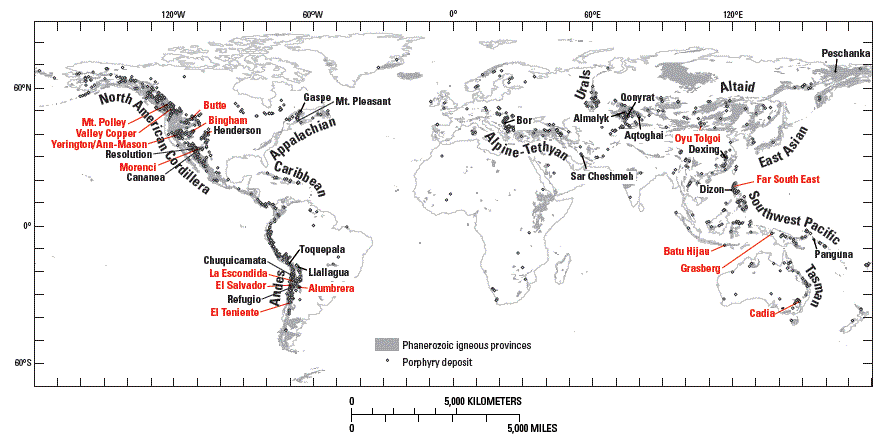 Figure A1. Phanerozoic porphyry belts, porphyry deposits, and representative porphyry copper deposits summarized in Appendix 2 (red labels). Modified from Seedorff and others (2005, their Fig. 1). 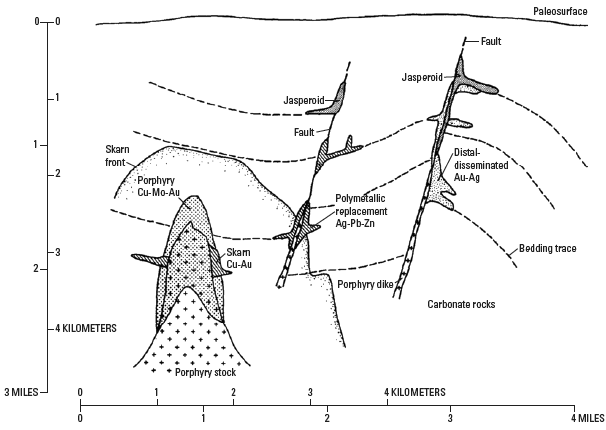 Figure B1. General setting of porphyry copper and associated deposit types (modified from Sillitoe and Bonham, 1990). John,D.A.(ed.)(2010)による『Porphyry Copper Deposit Model』から |
/Image1407.gif) Figure 2.18 Schematic model for the origin and formation of porphyry-type Cu, Mo, and W deposits. Detailed descriptions are provided in the text (modified after the models of Candela and Holland, 1984; 1986; Strong, 1988; Candela, 1992). Robb(2006)による『Introduction to Ore-Forming Processes』から |
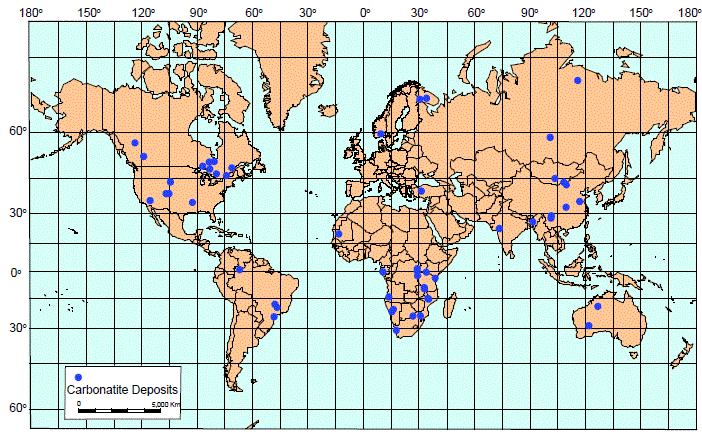 Figure 1. Location of explored Nb- and REE-carbonatite deposits included in the database and grade and tonnage models. USGSによる『Carbonatites of the World, Explored Deposits of Nb and REE-Database and Grade and Tonnage Models』から |
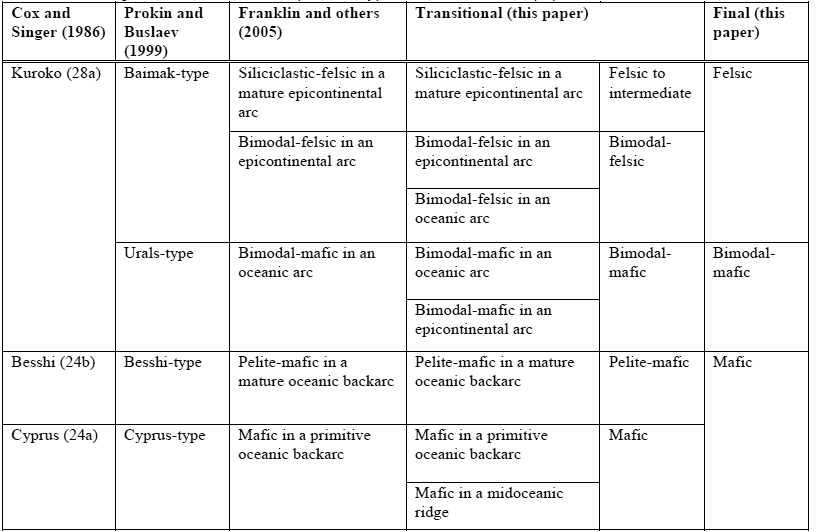 |
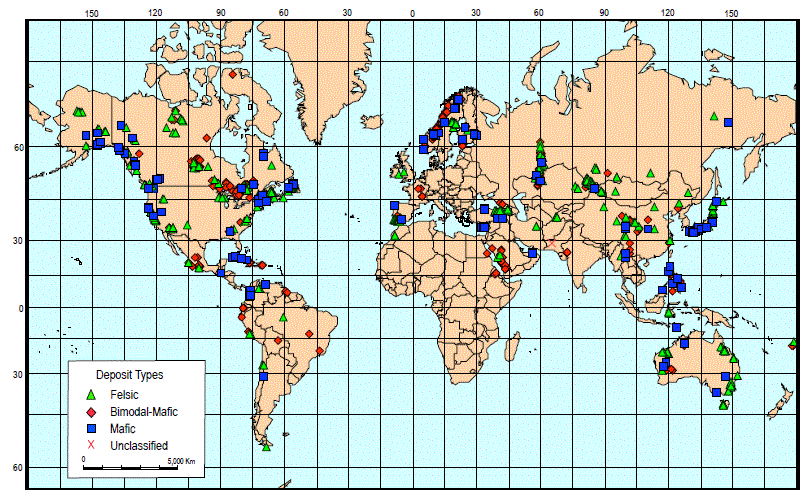 Figure 24. World map showing the distribution of volcanogenic massive sulfide deposit subtypes. |
| USGSによる『Volcanogenic Massive Sulfide Deposits of the World-Database and Grade and Tonnage Models』から | |
/Image1413.gif) Figure 3.21 (a) Section through a typical ophiolite-hosted, Cyprustype VMS deposit. Footwall rocks may consist of a sheeted dyke complex and the associated volcanics are often pillowed and have a tholeiitic composition. After Hutchinson and Searle (1971). (b) Section showing the characteristics of VMS deposits other than the ophiolite-hosted type. Associated volcanics may be intermediate or felsic in composition and a closer lateral link to chemical and epiclastic sediments is often apparent. The lens of massive sulfide ore formed on the ocean floor, underlain by a stockwork zone of disseminated sulfides and intensely altered volcanic rock, is typical of VMS deposits in general (after Large, 1992). |
/Image1414.gif) Figure 3.22 (a) Secular model explaining the evolution of fluids, growth of massive sulfide mounds, zoning, and paragenetic sequence for VMS deposits. (b) Plot of temperature versus Cu, Pb, Zn, and Au solubilities appropriate to fluid conditions during VMS ore deposition (pH = 4; 1 M NaCl; aH2S = 0.001; SO4/H2S = 0.01). Both diagrams after Large (1992). |
| Robb(2006)による『Introduction to Ore-Forming Processes』から | |
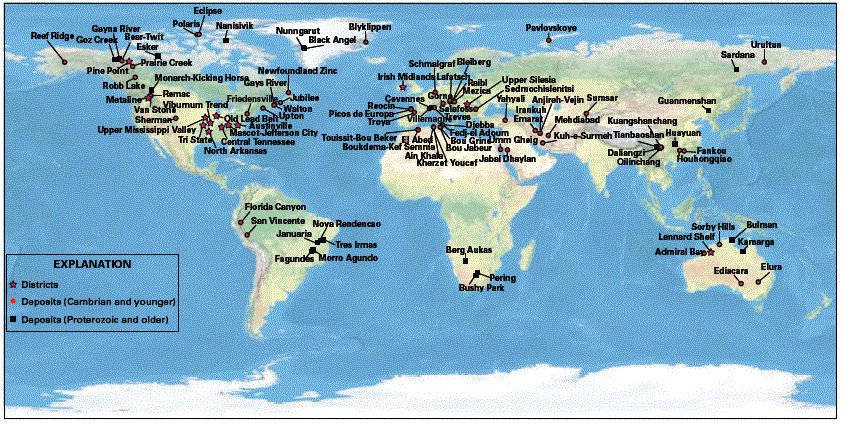 Figure 1. Global distribution of Mississippi Valley-Type lead-zinc deposits and districts. USGSによる『A Deposit Model for Mississippi Valley-Type Lead-Zinc Ores』から |
 Iron
oxide Cu-Au deposits are veins and breccia-hosted bodies of hematite
and/or magnetite with disseminated Cu + Au ± Ag ± Pd ± Pt ± Ni
± U ± LREE minerals formed in sedimentary or volcano-sedimentary
basins intruded by igneous rocks. Deposits are associated with
broad redox boundaries and feature sodic alteration of source
rocks and potassic alteration of host rocks. Iron
oxide Cu-Au deposits are veins and breccia-hosted bodies of hematite
and/or magnetite with disseminated Cu + Au ± Ag ± Pd ± Pt ± Ni
± U ± LREE minerals formed in sedimentary or volcano-sedimentary
basins intruded by igneous rocks. Deposits are associated with
broad redox boundaries and feature sodic alteration of source
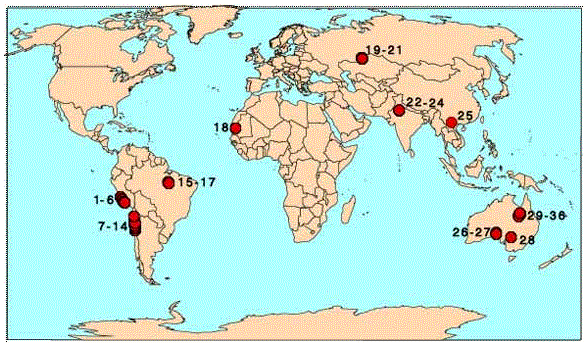
rocks and potassic alteration of host rocks.USGSによる『Descriptive and Grade-Tonnage Models and Database for Iron Oxide Cu-Au Deposits』から |
 |
/Image1408.gif) Figure 2.20 Plot of SiO2 versus [FeO + Fe2O3 + CaO + Na2O]/K2O showing the relationship between the composition of igneous intrusions and the dominant metal in various skarn deposits (after Meinert, 1992). |
/Image1409.gif) Figure 2.22 The geological setting and characteristics of high-sulfidation and low-sulfidation epithermal deposits. A genetic link between high-sulfidation epithermal Au?Cu and sub-volcanic porphyry type Cu?Au deposits is also suggested (after Hedenquist et al., 2000). |
/Image1410.gif) Figure 2.23 Two stage model for the formation of high-sulfidation epithermal deposits (after Arribas et al., 1995). (a) Initial stage where a dominantly magmatic vapor phase is responsible for leaching of the country rock and development of an advanced argillic alteration halo around the main fumarolic conduit. (b1) Ore deposition stage, in this case where gold is transported as a chloride complex; and (b2) ore deposition stage where gold is transported as a bisulfide complex. |
/Image1415.gif) Figure 3.38 Diagram illustrating the relationship between different fluid types and various hydrothermal ore deposit types. The diagram is relevant to both Chapters 2 and 3, and is modified after Skinner (1997). |
| Robb(2006)による『Introduction to Ore-Forming Processes』から | |
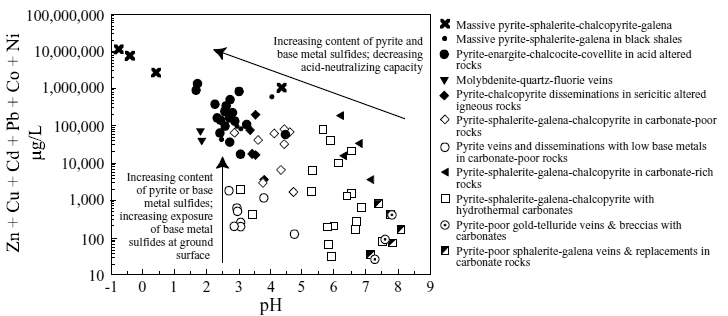 Figure 1. Ficklin plot of the sum of the base metals Cd, Co, Cu, Ni, Pb, and Zn versus pH illustrating the variation of mine drainage chemistry as a function of the geologic characteristics (type) of specific mineral deposits. Modified from Plumlee and Nash (1995), and Plumlee (1999). USGSによる『Progress on Geoenvironmental Models for Selected Mineral Deposit Types』から |
| 鉱化度〔立見辰雄(1916~1997年)氏が、1986~1987年に『地質ニュース』に書いた鉱物資源論(主に金属鉱物資源)で提唱した概念〕 |
金属鉱物資源とは、目的の単一の元素からなる物質(多くは金属)にまで分離して利用する鉱物資源のことです。鉄・アルミニウム・銅・亜鉛・鉛のように比較的消費量の多いベースメタル、およびその他の比較的消費量の少ないレアメタルに分けることができます。また、金・銀などは貴金属として別に分けられることが普通です。これらの定義は固定されたものではないので注意が必要です。 |
②総鉱物資源量の見積り: 注 普通のトンはメトリックトンである。ヤード・ポンド法では、1t=20 cwt(ハンドレッドウェイト)と定義されており、イギリスとアメリカで異なる。英トン(ロングトン、long ton、グロストン、gross ton:2240ポンド、1016.0469088キログラム)と米トン(ショートトン、short ton、ネットトン、net ton:2000ポンド、907.18474キログラム)とそれぞれ呼ばれている。(リンクはウィキペディア) |
| ・立見の鉱化度(立見、1979) (mf)i=ri/ti ここで、mfは鉱化度と定義される量、 tiは元素iがある地殻部分に存在している全量(トン)、 riは元素iが鉱床として濃集している量(トン)である。 もし、ある地殻部分の元素量が大陸地殻存在度で代表されるなら、次のように書ける: ti=m×Ai×10-6 ここで、mはある地殻部分の全量(トン)、 Aiは大陸地殻存在度である。 従って、上記の2つの式を組合わせると次のようになる: (mf)i=ri/(m×Ai×10-6) この式を、一般化したものが次式である:⇒ |
Ri=M×n×Ai×10-6×MF ここで、 Riは、ある元素iが大陸地殻上部で鉱床を作って濃集している分の総量(トン) 〔その元素の大陸地殻上部での資源量(究極可採埋蔵量に近似できる量)〕、 M(m=M×n)は、大陸地殻全体の重量(22.5×10¹⁸トン)、 nは、大陸地殻上部が占める範囲(採掘可能な範囲)の大陸地殻全体に対する割合であり、 0.2~0.3 (大陸地殻の平均の厚さを仮に35kmとすれば、深さ7~10km程度の範囲)、 Aiは、各元素iの大陸地殻存在度、 MFは、大陸地殻上部の各元素に共通した平均の鉱化度であり、 10-4~10-5である。 |
| これらの変数に代表的な数値を入れると次のようになる: A) Ri =6.8Ai×108 (トン)(n=0.3、MF=10-4) B) Ri =4.5Ai×108 (トン)(n=0.2、MF=10-4) C) Ri =6.8Ai×107 (トン)(n=0.3、MF=10-5) D) Ri =4.5Ai×107 (トン)(n=0.2、MF=10-5) |
【例】 金の場合 AAu=0.004ppm A)RAu=2.7×10⁶(トン) B)RAu=1.8×10⁶(トン) C)RAu=2.7×10⁵(トン) D)RAu=1.8×10⁵(トン) |
| 福岡正人による地球資源論研究室の『授業科目『地球資源論』(2015年度前期)』の『第8回金属鉱物資源』(2015)から | |
第2表 金属産出量と鉱化度 |
|
| 矢島淳吉ほかによる『北海道の金属産出量と鉱化度』(1989)から | |
|
|
|
|
| 立見辰雄による『鉱物資源を考える(4)』(1986/11)から | |
| 鉱石 |
鉱石(ore)とは、資源となる鉱物(鉱石鉱物.、ore mineral)を含む岩石(rock)を指す。鉱石が集合している部分を鉱床(ore deposit、mineral deposit)と呼ぶが、開発されている場合は鉱山(mine)と呼ばれる。鉱石は特殊な岩石の一種であり、普通の岩石には通常は伴われない。これは成因が異なるためであるが、鉱石の分類(成因的)も岩石の分類(火成岩・変成岩・堆積岩)のように大きく火成・変成・堆積に分けることが多い。とくに、代表的なものは火成の場合であり、さらにマグマ性と熱水性とに大きく分けられる。しかし、全般的に熱水の働きが重要であり、変成と堆積の場合も含めて熱水の関与が大きいため、鉱床をこのように簡単なタイプ分けすることは難しい場合(複合していることも多い)もあり、またタイプ分け自体はさほど重要ではない。実際には、何らかの方法によってその鉱床全体の生成時期(時代)および生成温度や生成圧力や化学組成〔構成元素の種類と濃度:具体的には鉱石鉱物と脈石鉱物の種類と量〕などの生成条件、ならびに関与した熱水の性質(酸化-還元および酸性-塩基性など:硫黄分圧と酸素分圧が特に重要:変質作用の状態も重要)を推定して、その鉱床の形成メカニズムを明らかにすることが行われている。このような学問は鉱床学(economic geology、ore geology)と呼ばれる。近年は、プレートテクトニクスの構造場の違いに応じて、熱水の熱源の代表であるマグマの発生と挙動に関連づけて、鉱床の成因的分類が行われている。
鉱石鉱物の同定は、研磨片(あるいは研磨薄片)を作り、反射型偏光顕微鏡(通称 金属顕微鏡あるいは反射顕微鏡)を用いて、その光学性や産状を観察することにより行う。また、粉末にしてX線粉末回折法を用いて結晶構造の特徴から識別できる。EPMAなどの化学分析機器が利用できる場合には、化学組成の特徴からも識別できる。ただし、正式な鉱物名の決定のためには、結晶構造と化学組成の両方の情報が必要である。
北風(山口大学工学部学術資料展示館)による『成因別鉱石』から |
|||||||||||||||||||||||||||||||||||||||||||||
|
||||||||||||||||||||||||||||||||||||||||||||||||||||||||||||||||||||||||||||||||||||||||||||||||||||||||||||||||||||||||||||||||||||||||||||||||||||||
|
|||||||||||||||||||||||||||||||||||||||||||||||||||||||||||||||||||||||||||||||||||||||||||||||||||||||||||||||||||||||||||||||||||||||||||||||||||||||||||||||||||||||||||||||||||||||||||||||||||||||||||||||||||||||||||||||||||||||||||||||||||||||||||||||||||||||||||||||||||||||||||||||||||||||||||||||||||||||||||||||||||||||||||||||||||||||||||||||||||||||||||||||||||||||||||||||||||||||||||||||||||||||||||||||||||||||||||||||||||||||||||||||||||||||||||||||||||||||||||||||||||||||||||||||||||||||||||||||||||||||||||||||
金田・正路(1993)による〔『地球環境工学ハンドブック』(206p)から〕【見る→】 |
||||||||||||||||||||||||||||||||||||||||||||||||||||||||||||||||||||||||||||||||||||||||||||||||||||||||||||||||||
| 鉱石の品位 |
|
|
|
|
|
|
|
|
| 片桐 望ほかによる『概説 資源端重量(Total Material Requirement; TMR)』(2009/3)から | |
|
|
|
|
| JOGMEC(上木隆司)による『銅品位の低下傾向について』(2008/7/31)から | |
| 海底鉱物資源 |
|
|
| JOGMECによる金属資源開発の技術開発・技術支援の海洋鉱物資源開発の『海洋鉱物資源の概要』(HP/2019/7/27)から | |
|
|
| JAMSTECによる『なぜ、いま「次世代海洋資源調査技術」なのか?』(HP/2019/7/27)から | |
日本の海底資源 海底資源の種別は、一般的に(1)海底石油・ガス(石油・天然ガス)、(2)熱水鉱床(金・銀・銅・亜鉛・鉛)、(3)ガスハイドレート(主にメタン)、(4)マンガン団塊(鉄・マンガン団塊、コバルト・リッチ・クラスト)に分けられている。 ウィキペディアによる『日本の海底資源』(HP/2019/7/26)から |
|
|
| 資源エネルギー庁による『海洋開発施策の概要』(HP/2019/7/26)から | |
主要海底鉱物資源の比較 (Petersen et al. 2016を改編) |
|
|
|
| 浦辺徹郎による『次世代海洋資源調査技術-海のジパング計画-』(2018/5/25)から | |
|
|
|
|
| 野崎達生による『深海に眠る海底鉱物資源を、人工熱水孔で「養殖」する!』(2017/4/20)から | |
|
|
|
|
| 浦辺徹郎による『海底鉱物資源開発の現状と政策課題-資源開発10カ年計画とリスクの軽減-』(2012/12/1)から | |
武井俊文による『深海底の豊かな鉱物資源の開発を目指して』(2012/1/5)から |
海底鉱物資源 |
|
|
|
| 西川有司による『海底鉱物資源の探査』(2009/1)から | |
| 鉱床学の本 |