|
最終更新日:2017年1月7日
現在は、陸上(Terrestrial)に豊富な鉱床(Ore Deposit)が存在するため、海底(Seabed)のマンガン団塊(Manganese Nodule)およびコバルトリッチ・クラスト(Cobalt-rich Crust)の利用は行われていない。おそらく、陸上のマンガン埋蔵量(Manganese Reserve)は豊富であるので、将来的にもマンガン〔および鉄(Iron)〕を目的とした開発(Development)が行われる可能性はほとんど無いが、少量だけ含まれる重金属類〔レアメタル(Rare Metal)や貴金属(Precious Metal)に属するもの〕を目的に開発が始まる可能性はある。ただし、環境(Environment)へ負荷(Load)を与えないように行う必要があり、経済的に採算がとれる(Profitable)かどうかは今後の開発技術(Exploitation Technology)等の発展にかかっている。 |
|
|
|
|
|
南部松夫 先生 | 2009年8月 | 肺炎 | 91 |
【見る→】 ウィキペディア |
広渡文利 先生 | 2007年7月 | 脳出血 | 82 |
マンガン鉱物と鉱石 【見る→】 ウィキペディア |
白水晴雄 先生 | 2006年6月 | 急性腎不全 | 80 | |
桃井 斉 先生 | 2002年2月 | 72 | ウィキペディア | |
吉村豊文 先生 | 1990年 | 85 | ウィキペディア |
|
|||
マンガン | 鉱物/岩石 | 鉱床 | 資源 |
|
リンク(Link) |
マンガン鉱物(Mn minerals) |
マンガン鉱床(Mn ore deposits) |
Fig. 9. Bivariate and ternary diagrams illustrating the hydrothermal components of the Permian sedimentary manganiferous formation from Guichi region in China. (A) SiO2-Al2O3 diagram (Wonder et al., 1988). (B) Diagnostic plot to discriminate between hydrothermal and supergene manganese oxides (Nicholson, 1992). (C) Fe-Mn-(Ni+Co+Cu)×10 ternary diagram (Hein et al., 1994). (D) Co/Zn vs. Co+Ni+Cu bivariate diagram (Toth, 1980). Data for Guizhou-Yunnan are from Liu et al. (2008) and Yang et al. (2009). Xieほか(2013)による『Geochemical studies on Permian manganese deposits in Guichi, eastern China: Implications for their origin and formative environments』から |
Fig. 1. Distribution of Mn reserves and resources in differentage rocks of the Earth’s lithosphere. (1) Reserves; (2) resources; (3) Archean manganiferous rocks; (4) major metallogenic phases of the accumulation of manganese rocks and ores: (1) Early Proterozoic, (2) Middle Proterozoic, (3) Late Proterozoic, (4) Early-Middle Paleozoic, (5) Late Paleozoic, (6) Mesozoic, (7) Late Mesozoic-Early Cenozoic; (5) major biotic events in the Phanerozoic (Alekseev, 1989, 1998). |
|
Fig. 2. Development of manganese rocks and ores in the Archean and Early Proterozoic in Pangea 0.3 Ga ago. Based on (Rogers, 1996). (1-4) Age of rocks in continental blocks, Ga: (1) 1.2, (2) 1.5-2, (3) 2.5, (4) 3 or more; (5) boundary of Western Gondwana; (6) field of Archean manganese rocks and ores; (7) positions of Early Proterozoic manganese deposits; (8) field of Early Proterozoic sedimentation with manganese ore specialization. Latin letter designations: (AL) Aldan; (AR) Aravalli; (AN/AC) Anabar /Angara; (BA/UK) Baltia/Ukraine; (BH) Bhandara (Bastar); (BR) Brazil (Guapore); (BU) Bundelhand; (CA) Central Arabia; (CK) Congo/Kasai; (DH) Dharwar (Western and Eastern); (DM) Western Dronning Maud Land; (EA) Eastern Australia; (GA) Gavler; (GU) Guayana; (HE) Herne; (NT) terranes including the Archean blocks of North Africa; (KA) Kaapvaal; (KI) Kimberley; (KZ) Kazakhstan; (MA) Madagascar; (NA) North Atlantic (including Nain, Greenland, and Levisian); (NAS) PanAfrican crust of the Nubian.Arabiann Shield; (NC) North Chinese (SinoKorean); (NP) Napier; (PI) Pilbara; (RA) Rae; (RP) Rio de la Plata; (SC) South Chines (Yangtse); (SF) San Franciso (including Salvador); (SI) Singbhum; (SL) Slave; (SU) Superior; (TA) Tarim; (TZ) Tansania; (VE) Vestfold; (WA) West Africa; (WN)Western Nile; (YI) Ylgarn; (ZI) Zimbabwe. |
Fig. 3. Manganese rock terranes during the existence of Atlantica. Modified after (Rogers, 1996). (1) Boundaries of paleocontinents; (2) domains of manganese deposits developed after gondites and ampelites; (3) boundaries of manganese deposits associated with the ferruginous.siliceous rocks; (4) major manganese deposits developed after gondites and ampelites; (5) major manganese deposits associated with the ferruginous.siliceous rocks. |
Fig. 4. Locations of manganese rocks and ores in the Late Proterozoic supercontinent Rodinia. Outlines of paleocontinents are shown as of 900 Ma ago, according to (Bogdanova et al., 2009). (1) Inferred shelf margins; (2) major collisional orogens of the Rodinia breakup period; (3, 4) basins with manganese rock formation in the Middle and Late Proterozoic, respectively; (5) boundary of the major manganese ore zone in the Middle and Late Proterozoic. |
|
Kuleshov(2011)による『Manganese deposits: Communication 2. Major epochs and phases of manganese accumulation in the Earth's history』から |
Fig. 1. Principle model of main material sources and manganese ore formation. (1) Sedimentary; (2) hydrothermal (volcanogenic, exhalative)-sedimentary; (3) diagenetic (sedimentary-diagenetic); (4) catagenetic (metasomatic); (5) supergene (weathering crusts). Kuleshov,V.N.(2011)による『Manganese Deposits: Communication 1. Genetic Models of Manganese Ore Formation』から |
|
|
|
|
||
Fig. 4. Plate tectonic model for the origin and accretion of Mn-formations along the Pacific-type consuming plate boundary (after Nakagawa et al., 2009). |
||
Nakagawaほか(2011)による『Manganese formations in the accretionary belts of Japan: Implications for subduction-accretion process in an active convergent margin』から |
Figure 4. Idealized sketch profile of the Mn deposition (proximal and distal facies) during Jurassic time: the oxidative bacterial system cycle. Proximal Mn facies and its environment: |
Figure 5. Idealized profile of Mn deposition (proximal and distal facies) during the Jurassic. Suboxic-reductive bacterial system cycle. Diagenetic Mn carbonate ore formation. 1. Bacterially mediated consumption of organic matter (enzymatic and total processes) by Mn4+, Fe3+, SO42-, e.g. diagenetic MnCO3, Fe-nontronite-Fe-mica (celadonite), pyrite (bacterial and inorganic), phosphorite formation. Continuous clay formation with two levels of Mn carbonate mineralization. 2. Squares No. 1 and 2 show positions of Fig. 6 and 7. |
Polgari(aの頭に´)ほか(2004)による『Theoretical model for Jurassic manganese mineralization in Central Europe, Urkut(両方のuの頭に´), Hungary』から |
Fig. 11. Paleogeographic sketch map showing localization of Mn ore deposits within the Early Oligocene basins of the Eastern Paratethys with additions and modifications (after Stolyarov, 1991; Popov et al., 1993). (1) Shelf regions; (2) bathyal deep basins; (3) coastal plains flooded at times by sea; (4) land; (5) Mn ore deposits: (I) South Ukraine (Nikopol, Bol’shoi Tokmak, and others); (II) Georgia (Chiatura, Chkhari-Adzhameti, and others); (III) Mangyshlak; (IV) Northeastern Bulgaria, the Varna region (Obrochishte and others); (V) northwestern Turkey, the Thrace Basin, and others (Binkilic(cにはセディーユが付く) and others). Varentsov(2002)による〔『Genesis of the Eastern Paratethys manganese ore giants: impact of events at the Eocene/Oligocene boundary』(65p)から〕【見る→】 |
FIG. 11. Origin of rhodochrosite-rich sediments in anoxic marine basins: Manganese is leached from the sediments and stored in anoxic bottom waters. Episodic inflow of denser, oxygenated water masses causes manganese to become oxidized to particulate oxides which accumulate either in oxygenated shallow areas (manganese nodules) or in the deepest parts of the basin. Return of anoxic conditions in the deep basins finally results in transformation of manganese oxides to rhodochrosite. Huckriede & Meischner(1996)による『Origin and environment of manganese-rich sediments within black-shale basins』から |
Fig.2 (Ni+Co+Zn)-Fe-Mn and Ni-Ba-Mn diagralns for manganese micronodules from marine sediments and hydrothermal cherts and shales from the Franciscan Terrane. The distribution areas for manganese micronodules of differentoriglns (a, b) are quoted from Ohashi (1985). The data for manganese micronodules from the Franciscan Terrane (c, d)are quoted from Sugitani(1987). |
Fig.4 Schematic diagrams for manganese distributions and itsmineral species in hemipelagicand pelagic sediments. |
Fig. 9 Schematlc diagrams for the fractionation between iron and manganese in hydrothermal deposits. |
Fig.5 Co-Ni-Zn diagrams for siliceous sedimentary rocks from the Mino Terrane, central Japan. The data for Yoro and Unuma are quoted from Sugitani(1989). The data for Kamiaso are quoted from Yamamoto (1983). The distribution patterns for pelagic and hemipelagicsediments on the saIne diagram are also shown. In these diagrams, the data of manganese bands are not shown. |
杉谷(1996)による『元素存在度比の解析による珪質堆積岩の堆積古環境の研究』から |
Fig.5. Comparison of models for Mn ore formation in Phanerozoic and Proterozoic (Kalahari Mn) continental shelf environments Cornell and Schutte(1995)による〔『A volcanic-exhalative origin for the world's largest (Kalahari) Manganese field』(146p)から〕【見る→】 |
Fig.5. Plots of: (a) [[Ni+Co+Cu)/0.1]-Fe-Mn; and (b) [(Cu+Ni+Zn)/0.1]-Fe-Mn, on which are superimposed fields from Bonatti et al. (1976) and Dymond et al. (1984). Buckeye Mn-rich ores plot in the hydrothermal field; some samples overlap with the field of suboxic diagenesis, as discussed in text. Symbols are explained in Table 3. Huebner et al.(1992)による〔『Chemical fluxes and origin of a manganese carbonate-oxide-silicate deposit in bedded chert』(93p)から〕【見る→】 |
Fig. 1. Contrasting Mn metallogeneses. Positive metallogenesis results in a substantial increase in concentration of an element (in our case Mn). Negative metallogenesis is equal to dissipation of a previously more concentrated element. (See explanation in text. ) |
Fig. 7. Map showing the major exceptional Mn accumulations of the world. |
Fig.22. Tonnages of ore Mn per one m.y. of geological history. Top: all Mn deposits. Bottom: ores in marine sedimentary and volcanic-sedimentary associations. |
|
Laznicka(1992)による〔『Manganese deposits in the global lithogenetic system: Quantitative approach』(279p)から〕【見る→】 |
|
|
(百万年) |
当たりの量 (トン×103) |
||
|
|
||||
カ ン ブ リ ア 紀 |
始生代 | 72,994 | 0.960 | 1000 | 73 |
原生代前期 | 4,505,850 | 59.100 | 700 | 6,437 | |
原生代中期 | 345,230 | 4.530 | 800 | 443 | |
原生代後期 | 252,976 | 3.320 | 430 | 588 | |
生 代 |
カンブリア紀 | 76,632 | 1.005 | 70 | 1,095 |
オルドビス紀 | 1,845 | 0.024 | 70 | 26 | |
シルル紀、デボン紀 | 160,692 | 2.110 | 85 | 1,890 | |
石炭紀 | 9,962 | 0.131 | 65 | 153 | |
ペルム紀 | 3,415 | 0.045 | 55 | 62 | |
生 代 |
三畳紀 | 24,625 | 0.323 | 35 | 704 |
ジュラ紀 | 473,781 | 6.214 | 54 | 8,774 | |
白亜紀 | 251,876 | 3.300 | 71 | 3,548 | |
生 代 |
暁新世、始新世 | 55,629 | 0.730 | 27 | 2,060 |
漸新世 | 1,316,656 | 17.270 | 12 | 109,721 | |
中新世 | 5,344 | 0.070 | 19 | 281 | |
鮮新世、第四紀 | 67,301 | 0.883 | 7 | 9,614 |
|
Fig.1.Distribution map of bedded manganese ore deposits in Japan. The deposits whose age of hosted chert was investigated are shown with the references. |
Fig.2 Distribution map of bedded manganese ore deposits (modified from Roy, 1981; Laznicka, 1981). |
|
桃井(1991)による『層状マンガン鉱床の地質学的諸問題』から |
時 代 | 産 地 |
|
(%) | |
始生代 | Hsiangtan 鉱床(中国) | >4.5 |
5255.5 |
82.5 |
Wafangtzu 地域(中国) | 0.7 | |||
原生代 | Tambao 鉱床(ブルキナファソ) | 9.0 | ||
先カンブリア紀 | Azul 鉱床(ブラジル) | 24.7 | ||
Moro da Mina 鉱床(ブラジル) | 1.4 | |||
Serro do Navio 鉱山(ブラジル) | 8.9 | |||
Urucum 鉱山(ブラジル) | 27.3 | |||
Moanda 鉱山(ガボン) | 96.8 | |||
Nsuta 鉱山(ガーナ) | 6.0 | |||
Andhra Pradesh 州(インド) | 0.6 | |||
Goa 州(インド) | 3.2 | |||
Gujarat 州(インド) | >1.2 | |||
Karnataka 州(インド) | 4.4 | |||
Madhya Pradesh および Maharashtra 州(インド) | 22.3 | |||
Orissa 州(インド) | 12.4 | |||
Kalahari 地帯(南アフリカ) | 5026.3 | |||
Postmasburg 地帯(南アフリカ) | 5.8 | |||
ペルム紀前期 | Leipingt 地域(中国) | 2.0 |
0.0 |
|
Tsunyi 地域(中国) | >2.0 | |||
ジュラ紀前期 | Urkut 地域(ハンガリー) | 44.1 |
567.7 |
8.9 |
ジュラ紀後期 | Molango 鉱山(メキシコ) | 523.6 | ||
白亜紀前期 | Groote Eylandt 鉱山(オーストラリア) | 152.9 |
153.6 |
2.4 |
白亜紀後期 | Imini 鉱山(モロッコ) | 0.7 | ||
漸新世 | Varna 地域(ブルガリア) | 5.0 |
390.6 |
6.1 |
Bol'shoi Tokmak 鉱床(旧ソ連) | 203.5 | |||
Nikopol 鉱床(旧ソ連) | 144.1 | |||
Chiatura 鉱床(旧ソ連) | 38.0 | |||
完新世 | Western Transvaal 鉱床(南アフリカ) | 3.7 | 3.7 | 0.1 |
|
6376.1 | |||
DeYoung et al.(1984)のデータをもとに、Glasby(1988)がまとめたもの。 各鉱床の量を合計すると6373.1となり、Glasby(1988)が示す合計に3だけ足りない。 |
Figure 3. Our preferred (but simplified) interpretation of relative position and timing of zones of diagenetic reactions involved in formation of diagenetic rhodochrosite in continental-margin basin receiving silica-rich sediments. Sulfate- and carbonate-reduction reactions are from Clay-pool (1974). We postulate that zone of rhodochrosite formation would occur between about 150 and 300 m depth of burial for Ladd and Buckeye deposits, but this is poorly constrained. Silica diagenesis would continue even after tectonic uplift if appropriate temperatures existed and metastable silica phases were present. Other biochemical and geochemical reactions occurring in sediments are not listed; argillite dehydration and compaction are also not illustrated. Sulfide precipitation is minor and consumes only small amounts of iron from sediment. Placement of rhodochrosite formation reaction immediately below sulfate-reduction zone is for display purposes and should not imply precipitation immediately after sulfate consumption. Hein & Koski(1987)による『Bacterially mediated diagenetic origin for chert-hosted manganese deposits in the Franciscan Complex, California Coast Ranges』から |
Figure 7. A. Nearshore deposition of basal conglomerate and quartz sand, and offshore precipitation of manganese carbonates in oxygen-depleted environments. B. Phosphorite and broad zone of manganese carbonate accumulation and widespread diagenetic remobilizacion of manganese; organic-bearing clays are deposited in offshore regions. C. Wide zone of manganese-oxide precipitation and accumulation in oxygenated, nearshore regions and continued deposition of manganese carbonates and organic-bearing clays in offshore parts. D. Widespread sand and spongiolite deposition in nearshore parts, and clay accumulation in offshore areas; minor manganese carbonate and oxide ores deposited on organic-bearing clays. Bolton & Frakes(1985)による〔『Geology and genesis of manganese oolite, Chiatura, Georgia, U.S.S.R.』(1398p)から〕【見る→】 |
Figure 4. A: Relationships during marine transgression, showing narrow zone of Mn accumulation and concentration of dissolved Mn in water column. B: Relationship during marine regression with abundant diagenetic remobilization and wide zone of final Mn precipitation. C: Manganese sedimentation in coastal zone of intracratonic basin, showing veil effect (flocculant fallout) from saline mixing and broom effect (bottom transport and concentration) from tidal activity. Frakes & Bolton(1984)による『Origin of manganese giants: Sea-level change and anoxic-oxic history』から |
(生成過程による) |
二次性 | ||||
堆積性 (マンガンの起源による) |
非火山性 (母岩の岩相による) |
鉄鉱層に伴う | 卓状地、優地向斜、および劣地向斜。 | ||
炭酸塩層に伴う |
石灰岩-ドロマイト、ドロマイト-陸源物質、珪質石灰岩。 卓状地および優地向斜。 |
||||
陸源物質の地層に伴う |
オーソコーツァイト-粘土岩。 主に卓状地および劣地向斜。 |
||||
火山性 |
ポーフィリー 珪質グループ |
珪質炭酸塩層 | |||
ポーフィリー質層 | |||||
グリーンストーン 珪質グループ |
珪質頁岩層 | 塩基性火山岩に関連した珪質頁岩に伴う | |||
ジャスパー質層 | ジャスパー、チャート(しばしば放散虫岩)ときに凝灰岩に伴う | ||||
グリーンストーン層 | スピライト、ダイアベースなどに伴う | ||||
熱水性 |
Figure 2. Schematic and simplified diagram of the stratigraphic column of the northern Apennine ophiolite complexes. |
Figure 4. Ratio Fe/Mn/Cu+Ni+Co in metalliferous sediments from the ocean floor, illustrating the different composition of "hydrothermal" and "hydrogenous" deposits. For discussion of this diagram see Bonatti and others (1972a). Mid-Atlantic Ridge deposit refers to the deposit at lat 26゜N studied by Scott and others (1974). Note the distribution of the Apennine ophiolite metalliferous sedimentary rocks. |
Figure 7. Fe versus Mn plot of samples of metalliferous sediments (from Table 3) and of metal sulfide deposits (from Table 9) from the Apennine ophiolites, illustrating fractionation of Fe from Mn. Full dots represent samples of chert and shale associated with the metalliferous sediments from Table 3, Franzini and others (1968), and Thurston (1972). Dotted arrows indicate suggested fractionation trends in the model. |
Figure 8. Qualitative scheme illustrating the hydrothermal model of metallogenesis at spreading centers. Fe and Mn stand for metals leached from the basaltic oceanic crust. U stands for elements which may be lost by the hydrothermal waters to the basalt. 3He stands for volatile components supplied by the upper mantle to the hydrothermal system. [PO4]-3 stands for elements scavenged from sea water during precipitation of Fe and Mn. For further explanation of this model, see Bonatti (1975). |
Bonatti et al.(1976)による『Metalliferous deposits from the Apennine ophiolites: Mesozoic equivalents of modern deposits from oceanic spreading centers』から |
Fig. 2. Genetic scheme for Mn deposits. |
Fig. 3. The four main types of manganese occurrences according to their-SHF, (shale-Hornstein or chert-Formation) content and distance from intrusive magmatic bodies. After N.S.Shatskij(1954). |
Fig. 5. Formation of iron and manganese ores in lakes in the tundra region. |
Fig. 4. Occurrences and tonages of nine types of manganese ore deposits within rocks of the various geological systems. After I.M.Varentsove (1964). |
Fig. 6. Various stages in the genesis of manganese ores of the Lindener Mark Type. |
Fig. 7. (a) Cross-section of the Lindener Mark ironmanganese ore deposit; (b) cross-section of the Poslmasburg manganese ore district; (c) columnar section of the Transvaal System. |
Borchert(1970)による〔『On the ore-deposition and geochemistry of manganese』(300p)から〕【見る→】 |
鉱石課(広渡文利)(1959)による『わが国のマンガン鉱床』から |
マンガン団塊・クラスト(Mn nodules & crusts) |
Fig. 10. Model of manganese ore process in depressions of the Baltic Sea with a periodic hydrosulfuric contamination of bottom water. Based on (Emelyanov, 2004). (1) Water column with H2S; (2) Fe-Mn crusts and nodules; (3) pelletal (diagenetic) nodules; (4) roiling of sand and aleurite; (5) flow of saline water with oxygen; (6) “rainfall” of organic detritus; (7) nepheloid (turbid) layer with Fe?Mn hydroxide particulates; (8) rhodochrosite; (9) iron sulfides. |
Fig. 16. Assumed main stages of the formation of manganese carbonate ores, with depressions of the Baltic Sea as example. Based on (Emelyanov, 1986). (HEF) High-energy facies; (LEF) low-energy facies. Stage VI, after (Panchenko, 1982). |
|||||||||||||||||||||||||||||||||||
|
||||||||||||||||||||||||||||||||||||
Emelyanov(2011)による『Ferromanganese Ore Process in the Baltic Sea』から |
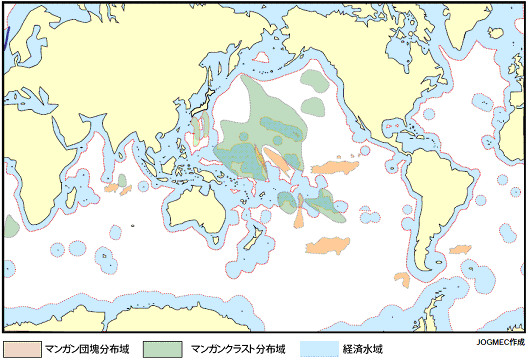
図2 マンガン団塊・マンガンクラスト分布図 〔JOGMECの『金属資源レポート』(Vol.36 No.1 2006.05)の『深海底鉱物資源(1) JOGMEC の深海底鉱物資源調査への取り組み』から〕 |
Fig. 1. Schematic figure of the principal types of ferromanganese nodules (diameters vary between 1 and 15 cm) and crusts (thickness varies between 0.5 and 10 cm) distributed in pelagic sediment basins and on seamounts. |
*) References see Table 1 (1) After Hodge et al. 1985 |
Halbach(1986)による〔『Processes controlling the heavy metal distribution in Pacific ferromanganese nodules and crusts』(235p)から〕【見る→】 |
FIG. 3. A triplot of (Cu + Ni + Zn)×10 vs. Mn vs. Fe contents of H, S, and R nodules. A refers to nodule tops, A refers to nodule bottoms, 0 refers to whole nodules, and 0 refers to crusts. Dashed boxes outline fields of hydrogenous, oxic and suboxic accretion. Dymond et al.(1984)による〔『Ferromanganese nodules from MANOP Sites H, S, and R−Control of mineralogical and chemical composition by multiple accretionary processes』(931p)から〕【見る→】 |
Figure 1. Ternary diagram of Fe and Mn versus (Co+Ni+Cu)×10. Illustrated are (1) the low trace-metal content of hydrothermal crusts, and (2) the similar Fe enriched and trace-metal depleted compositions of ferromanganese crusts and EPR metalliferous sediments. “Hydrogeneous” and “hydrothermal” fields are from Bonatti and others., 1972b. EPR metalliferous sediment data are from Corliss and Dymond, 1975. Bauer Basin smectite data are from Eklund, 1974. |
Figure 2. Ternary diagram of Fe versus Mn versus Si. The trend of increasing Si with Fe content is shown. EPR metalliferous sediment data are from Corliss and Dymond, 1975. Bauer Basin smectite data are from Eklund, 1974. |
Figure 7. Illustration summarizing the processes involved in the deposition of Mn- and Fe-rich hydrothermal crusts, ferromanganese crusts, and metalliferous sediments. Hydrothermally derived Mn, Fe, SiO2, and associated volatile elements follow two paths as they reach the sea floor: (1) local precipitation as Fe-SiO2-rich and MnO2 crusts, and (2) suspension as colloidal Fe and Mn oxyhydroxides and SiO2 species. The colloids adsorb Co, Ni, Cu, Pb, and REE from sea water and flocculate to form thin ferromanganese crusts and metalliferous sediments. |
|
Toth(1980)による〔『Deposition of submarine crusts rich in manganese and iron』(44p)から〕【見る→】 常温水から沈殿した場合はマンガンと鉄が混合した酸化物が優勢で、熱水からの場合はマンガンと鉄のそれぞれの酸化物に分離したものが優勢である。 |