外務省(HP/2016/9/18)による『ブラジル基礎データ』から |
||||||||||||||||||||||||||||||||||||||||||||
ウィキペディア(HP/2016/9/18)による『ブラジル』から |
|||||||||||||||||||||||||||||||||||||||||||||||||||||||||||||||||||||
|
|
最終更新日:2019年3月9日
| 全般 | 地理 |
|
|
その他 |
| リンク⇒こちら|
全般| 州| サンパウロ州| サンパウロ市| リオデジャネイロ州| 貿易| マテリアルフロー| Footprint| |
地理| セラード| 河川| |
地質|土壌|
鉱山| エネルギー資源|バイオ燃料| 鉄鉱石| 肥料| 食料資源(主に農業)|サトウキビ|大豆|トウモロコシ|キャッサバ| 森林(林業)|ユーカリ| 水力発電| 廃棄物/リサイクル| |
CO2〔温暖化ガス(GHG)も〕|
アマゾン| 窒素循環| 窒素濃度| 環境影響評価| |
人口|
サンパウロ大学| 歴史| 観光・交通・宿泊| 対蹠地 |
| ここには、ブラジル(Brazil、Federative Republic of Brazil)における主に資源(Resource)・地球科学(Earth Science)・環境(Environment)に関連する情報を集めている。 |
| 全般 |
|
||||||||||||||||||||||||||||||||||||||||||||||||||||||||||||||||||||||||||||||||||||
外務省による『ブラジル基礎データ』(2019/1/23)から |
|||||||||||||||||||||||||||||||||||||||||||||||||||||||
外務省(HP/2016/9/18)による『ブラジル基礎データ』から |
||||||||||||||||||||||||||||||||||||||||||||
ウィキペディア(HP/2016/9/18)による『ブラジル』から |
|||||||||||||||||||||||||||||||||||||||||||||||||||||||||||||||||||||
| 州 |
Googleマップ(HP/2016/7/7)による |
 Political map of Brazil, showing the division by states and regions. Wikipedia(HP/2016/7/7)による『Geography of Brazil』から |
州と連邦直轄地区の一覧
ウィキペディア(HP/2016/7/4)による『ブラジルの地方行政区分』から ブラジル10大都市 |
|||||||||||||||||||||||||||||||||||||||||||||||||||||||||||||||||||||||||||||||||||||||||||||||||||||||||||||||||||||||||||||||||||||||||||||||||
/Image163.gif) ブラジルの地域と州の区分 (『ブラジルの地方行政区分』参照) |
1.アクレ州
2.アラゴアス州 3.アマパー州 4.アマゾナス州 5.バイーア州 6.セアラー州 7.エスピリト・サント州 8.ゴイアス州 9.マラニョン州 10.マット・グロッソ州 11.マット・グロッソ・ド・スーウ州 12.ミナス・ジェライス州 13.パラー州 14.パライバ州 15.パラナ州 16.ペルナンブコ州 17.ピアウイー州 18.リオデジャネイロ州 19.リオ・グランデ・ド・ノルテ州 20.リオ・グランデ・ド・スーウ州 21.ロンドニア州 22.ロライマ州 23.サンタ・カタリーナ州 24.サン・パウロ州 25.セルジッペ州 26.トカンティンス州 27.連邦直轄区 |
|
5地域の26州(Estado)と1連邦直轄区(首都ブラジリア)から構成。州は5,564ムニシピオが存在。 ウィキペディア(HP/2013/9)による『ブラジル』から |
|
| サンパウロ州 |
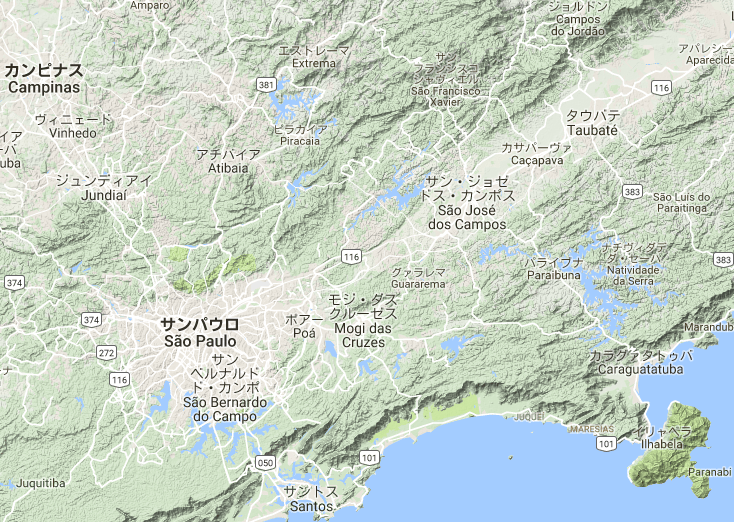
|
|
Mapsof.net(HP/2016/9/16)による『São Paulo map』から |
|
List of municipalities in the state of São Paulo by population
Wikipedia(HP/2016/7/29)による『List of municipalities in the state of São Paulo by population』などから |
|||||||||||||||||||||||||||||||||||||||||||||||||||||||||||||||||||||||||||||||||||||||||||||||||||||||||||||||||||
WORLDMapFinder(HP/2016/7/29)による『サンパウロ州地図』から |
| サンパウロ市 |

|
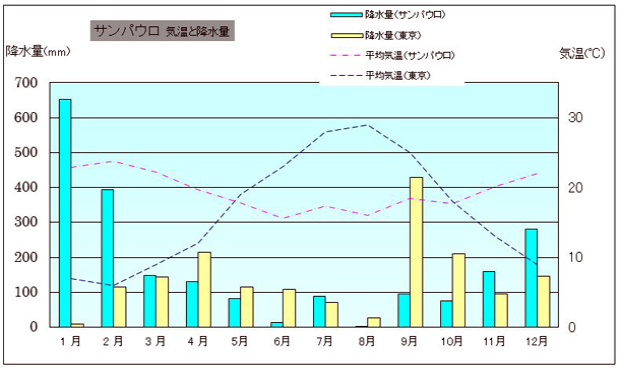 サンパウロ 気温と降水量 |
| 在サンパウロ市日本国領事館(HP/2016/9/29)による『サンパウロ案内』から | |
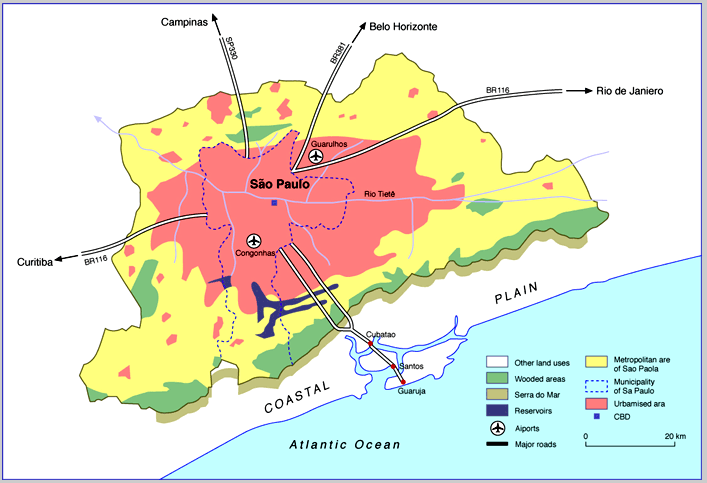 Figure 1 - Land use in Greater São Paulo. |
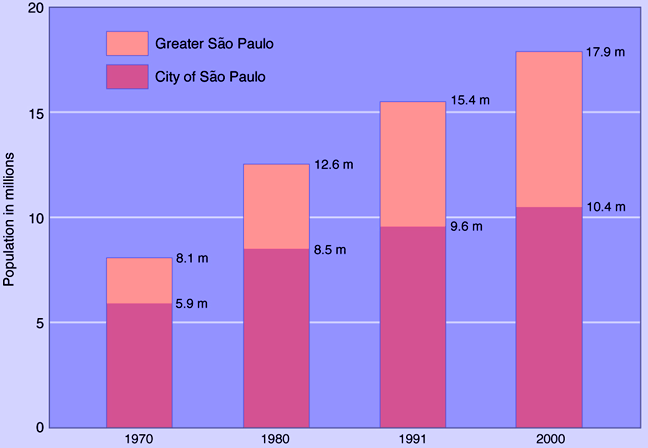 Figure 2 - Population growth in São Paulo. |
|
|
| GEOCASES(HP/2016/9/29)による『São Paulo: Population and Slum Housing』から | |
| リオデジャネイロ州 |
WORLDMapFinder(HP/2016/7/30)による『リオデジャネイロ州地図』から |
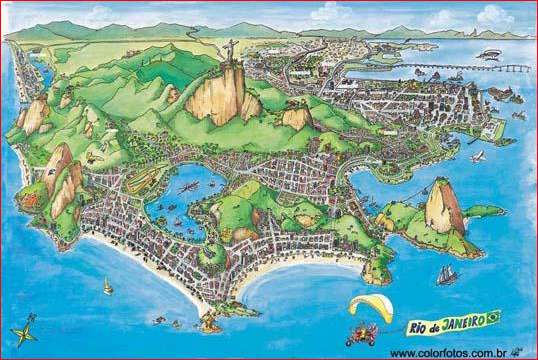 リオデジャネイロの町 田淵(2012/8/16)による『<ブラジル旅行記13> リオデジャネイロ 2012年,8月16日』から |
|
| 貿易 |
|
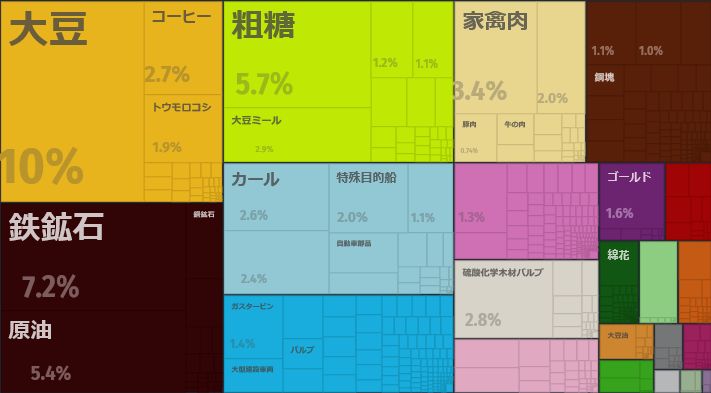 ブラジル輸出(2016) TOTAL:$182B |
|
|
| Alexander SimoesによるOECの『ブラジル』(HP/2018/1/23)から | |
| マテリアルフロー |
福岡正人による『ブラジルの主なマテリアル』(2019/2/13)から |
|||||||||||||||||||||||||||||||||||||||||||||||||||||||||||||||||||||||||||||||||||||||||||||||||||||||||||||||||||||||||||||||||||||||||||||||||||||||||||||||||||||||||||||||||||||||||||||||||||||||||||||||||||||||||||||||||||||||||||||||||||||||||||||||||||||||||||||||||||||||||||||||||||||||||||||||||||||||||||||||||||||||||||||||||||||||||||||||||||||||||||
Greenhouse Gas Emissions Brazil 2012 |
LatAm BEN – Brazil |
| sankey-diagrams.comによる『Sankey Diagrams』(HP/2019/2/17)から | |
| Footprint |
|
|
Table 1. National virtual water trade balance of Brazil related to different agricultural commodities |
Table 2. Internal, external and total water footprint (WF) of national consumption and virtual water trade in the period 1997-2012 in Brazil
|
| Vicente de Paulo R. da Silva et al.による『Water Footprint and Virtual Water Trade of Brazil』(2016)から | |
| 地理 |
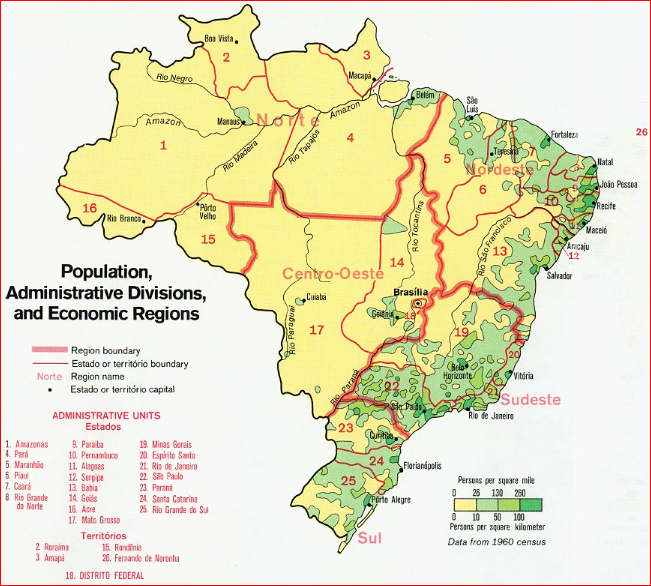 Brazil Population, Administrative Divisions, Economic Regions Map 1977 Brazil Population, Administrative Divisions, Economic Regions Map 1977
|
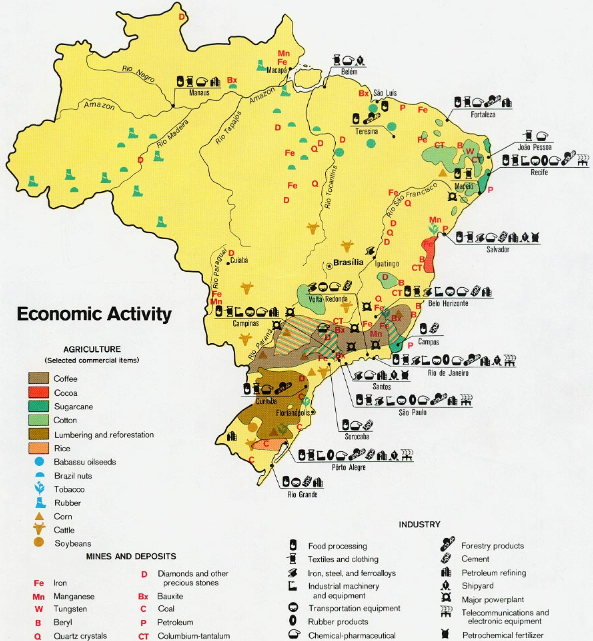 Brazil Economic Activity Map 1977 |
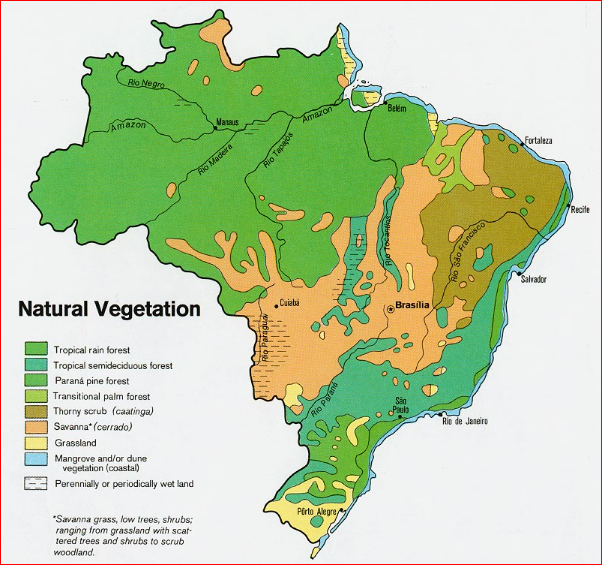 Brazil Natural Vegetation Map 1977 |
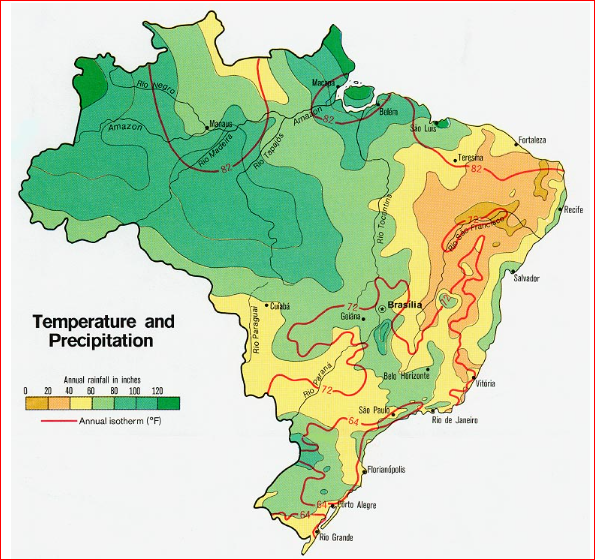 Brazil Temperature and Precipitation Map 1977 |
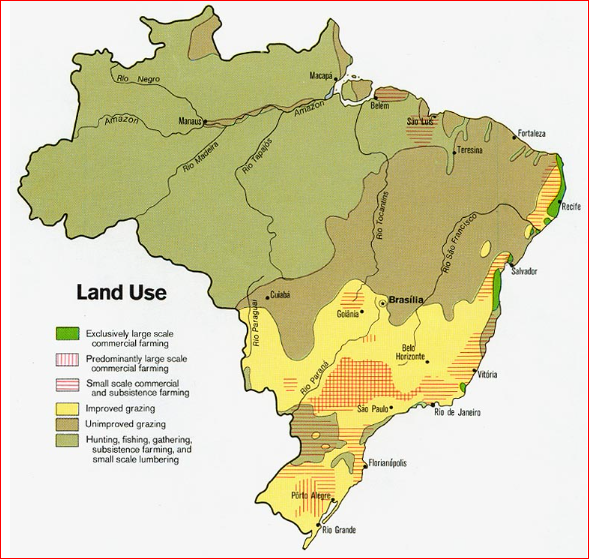 Brazil Land Use Map 1977 |
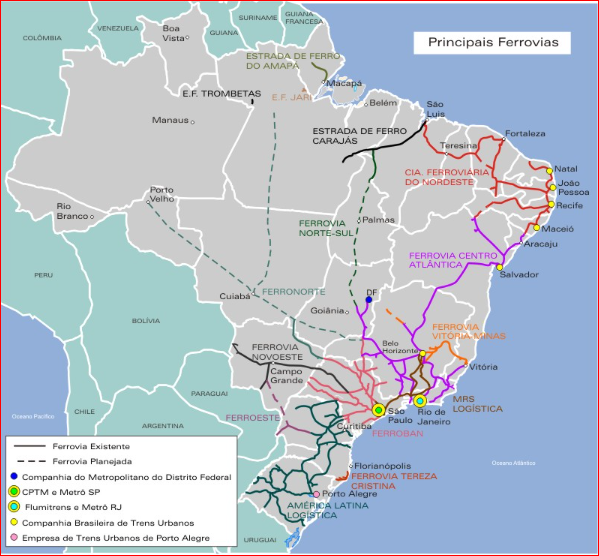 Brazil Main Railways Map |
| ウィキペディア(HP/2016/7/4)による『ブラジル』から | |
 ブラジルの地形図 ウィキペディア(HP/2016/7/4)による『ブラジル』から |
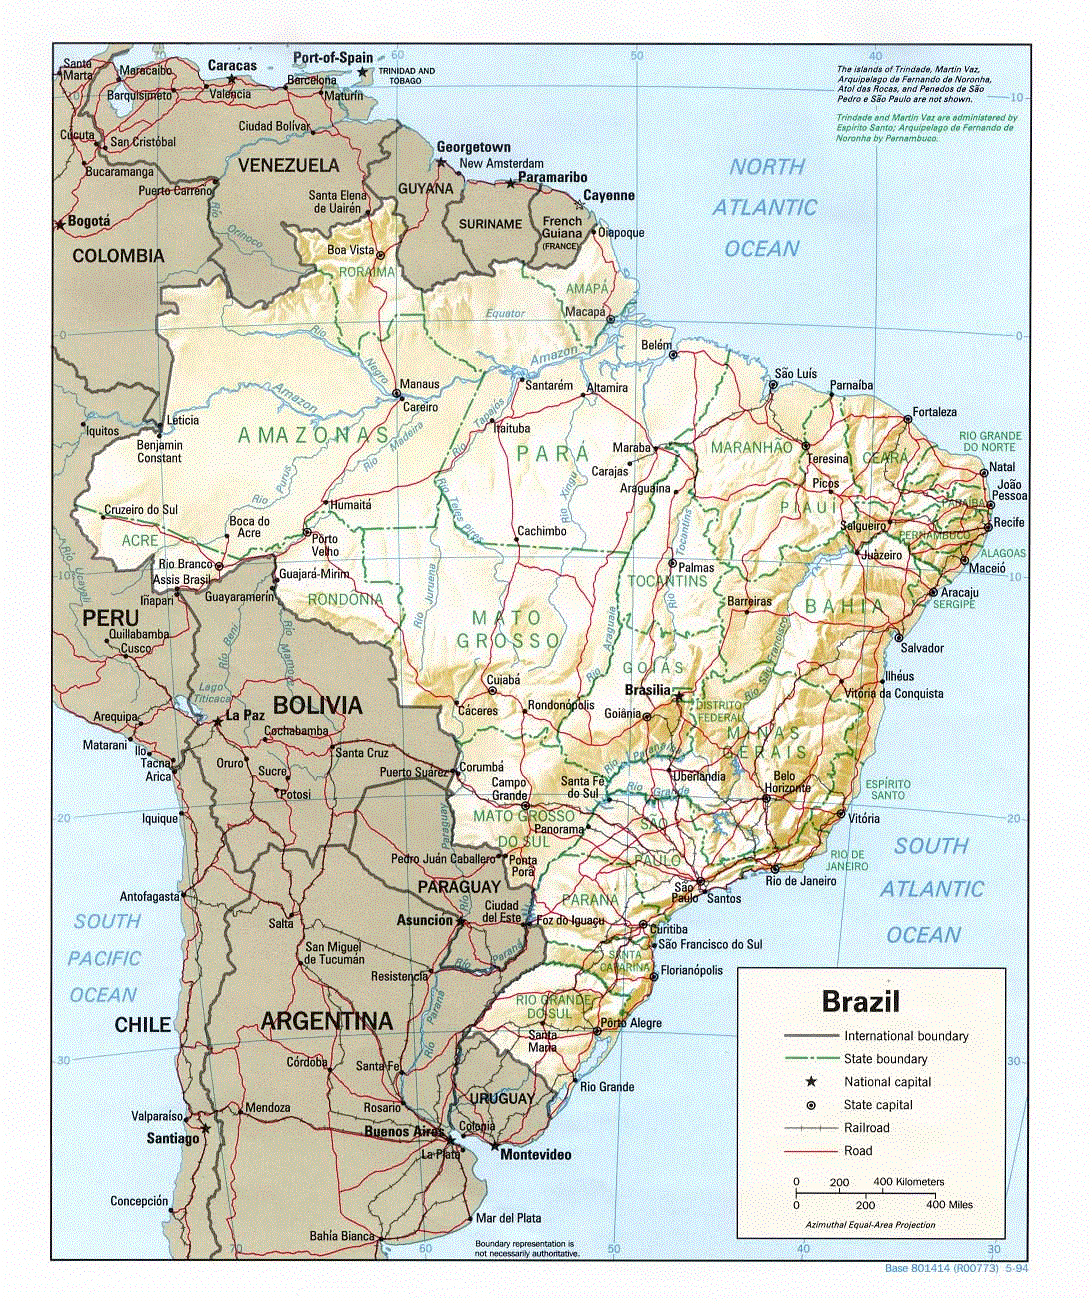 The University of Texas at AustinのUniversity of Texas Librariesの『Perry-Castaneda(nの頭に~) Library Map Collection』の『Brazil Maps』の『Brazil (Shaded Relief) 1994 (264K)』から |
| セラード |
|
|
|
|
| The Economist(2010/8/26)による『The miracle of the cerrado』から | |
| 河川 |
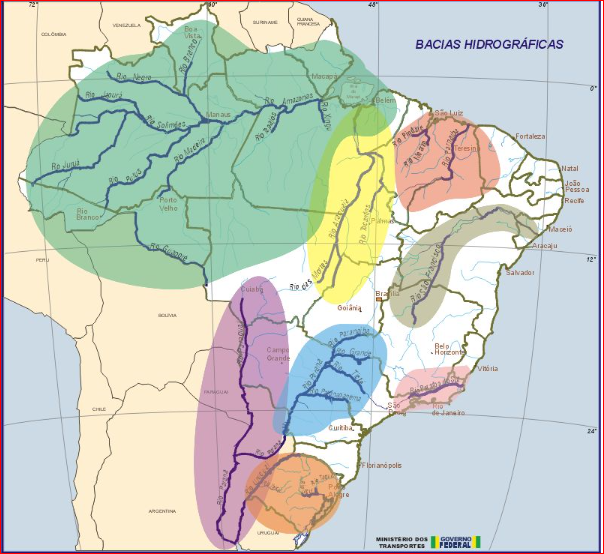 Brazil Water Basins Map zonu.com(HP/2016/7/7)による『Brazil Water Basins Map』から |
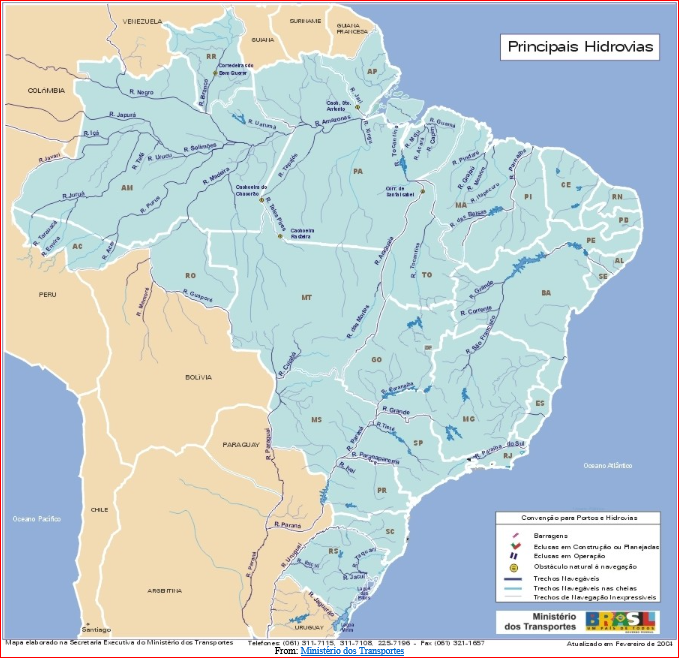 Brazil Main Waterways Map zonu.com(HP/2016/7/7)による『Brazil Main Waterways Map』から |
 Main Hydrographic Regions of Brazil Main Hydrographic Regions of Brazil
Wikipedia(HP/2016/7/7)による『Geography of Brazil』から |
 São Francisco river basin Wikipedia(HP/2016/7/5)による『Río de la Plata』から |
 Southeastern Brazil with major rivers highlighted Wikipedia(HP/2016/7/5)による『Río de la Plata』から |
 Map of the Río de la Plata basin, showing the Río de la Plata at the mouths of the Paraná and Uruguay rivers, near Buenos Aires Wikipedia(HP/2016/7/5)による『Río de la Plata』から |
 アマゾン川流域 ウィキペディア(HP/2016/7/4)による『アマゾン盆地』から |
| 地質 |
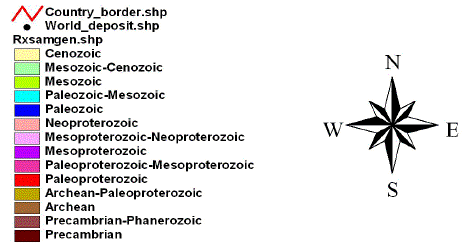
Marlon MachadoによるThe Brazilian Cacti Projectの『Geology of Brazil』(HP/2018/1/23)から |
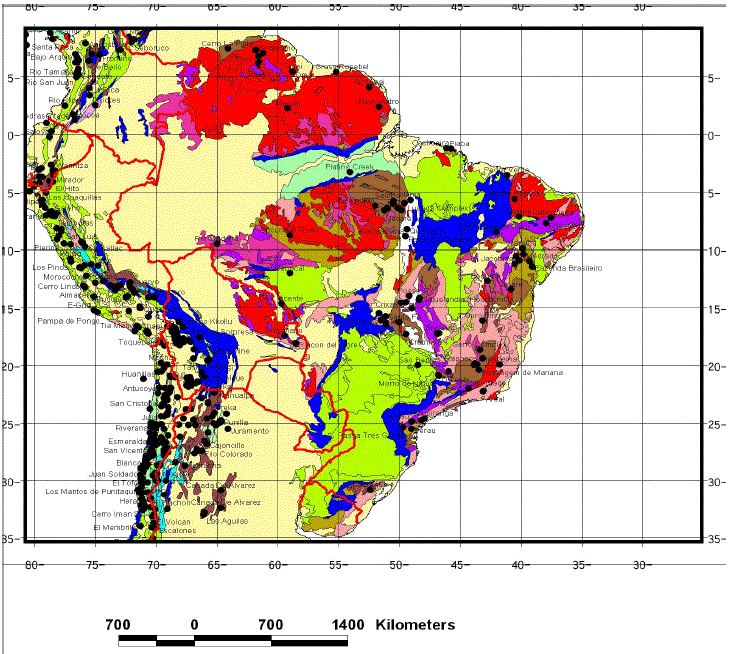  第7-1 図 ブラジルの地質及び主要鉱床分布図 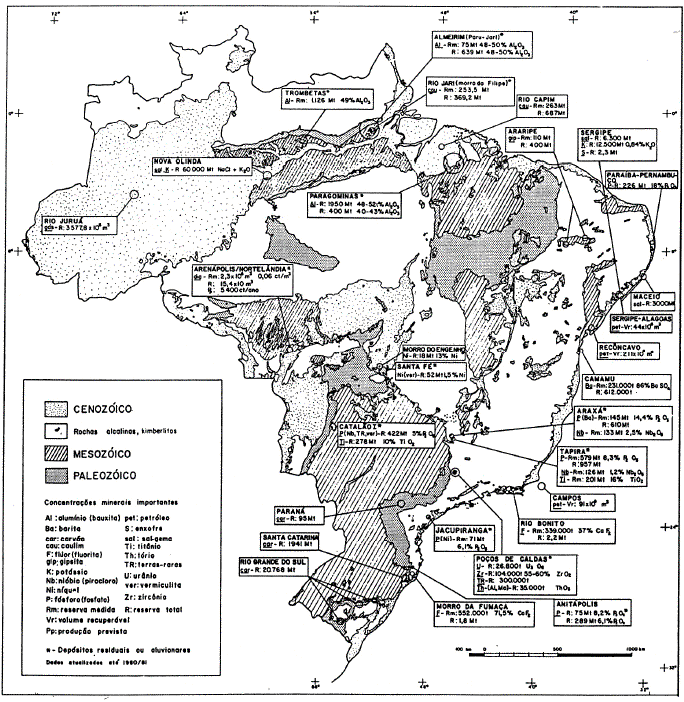 第2-6 図 顕生代の地質と主要鉱床の分布図 (財団法人国際鉱物資源開発協力協会,1992) JOGMECによる『資源開発環境調査 ブラジル連邦共和国 Republica Federativa do Brasil』から |
|
|
| Inácio de Medeiros Delgado et al.による『CHAPTER 4 GEOLOGY AND MINERAL RESOURCES OF BRAZIL』(1993?)から | |
| 土壌 |
|
|
|
|
| Adolpho J. Melfi et al.による『Use of pedological maps in the identification of sensitivity of soils to acidic deposition: application to Brazilian soils』(2004/3)から | |
|
|
TABLE 2 Extent and distribution of soils in Brazil, Brazilian nomenclature |
TABLE 3 Brazilian and FAO soil nomenclature |
| FAOによる『Fertilizer Use by Crop in Brazil』(2004)から | |
| 鉱山 |
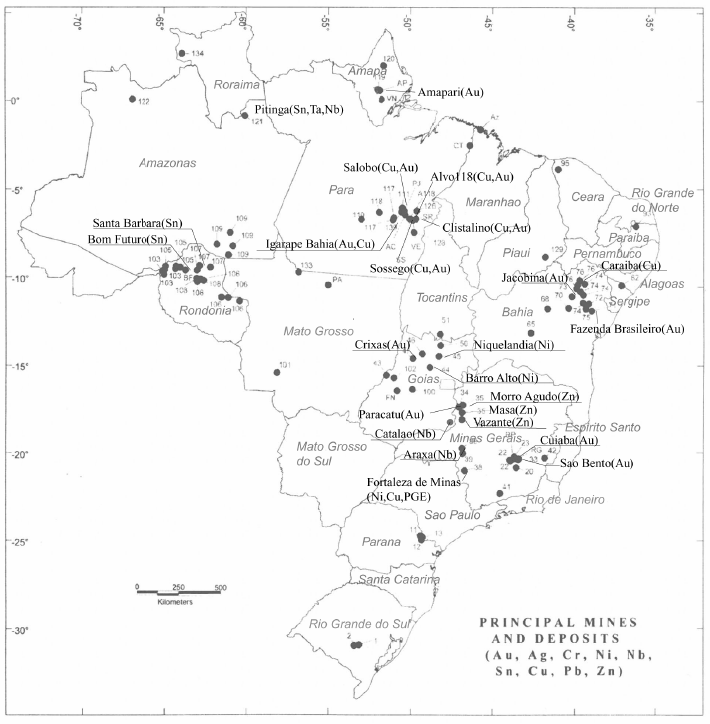 第7-2 図 ブラジル主要鉱山・鉱床位置図 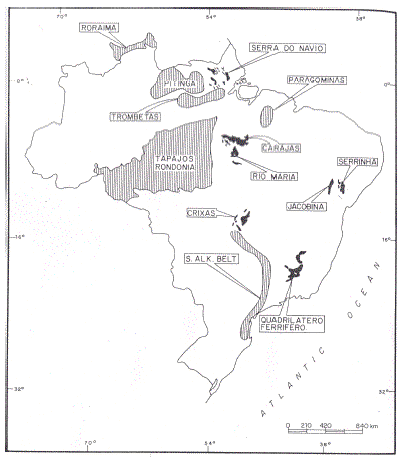 第2-1 図 主要鉱床生成区 (財団法人国際鉱物資源開発協力協会,2003) JOGMECによる『資源開発環境調査 ブラジル連邦共和国 Republica Federativa do Brasil』から |
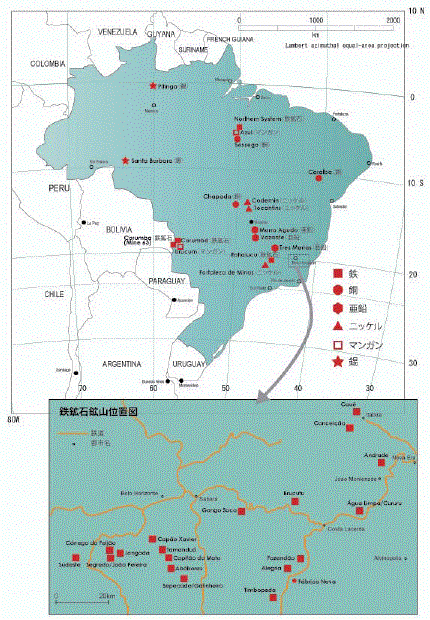 図4. ブラジルの主要鉱山位置図 JOGMECによる『世界の鉱業の趨勢』から |
| エネルギー資源 |
Notas / Notes |
|
|
|
|
|
|
|
EPE–Empresa de Pesquisa Energética(Brasil)による『BALANÇO ENERGÉTICO NACIONAL ano base 2017(BRAZILIAN ENERGY BALANCE year 2017)』(2018?)による |
|
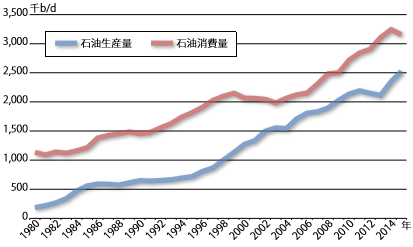 図1 ブラジルの石油生産量・消費量 出所:BP, Statistic Review of World Energy 2016より作成。 |
|
舩木(2016/9)による『苦境からの復活を図るPetrobras -ブラジル沖プレソルトの開発と生産の見通し-』から |
|
|
|
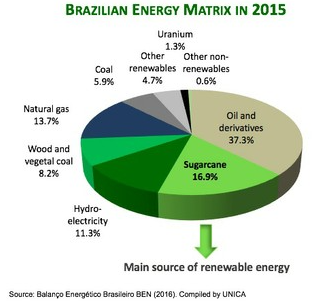
SugarCaneによる『Brazil's Diverse Energy Matrix』から |
|
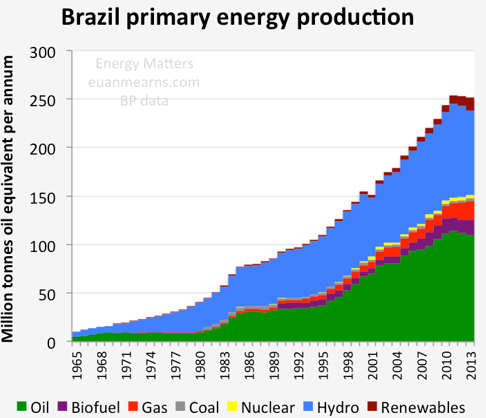 Figure 1 Brazil is a significant oil producer with 2.1 million barrels per day (mbpd) in 2013, but for such a large country with vast offshore areas this is not an unduly large amount. It is one of the few countries in the world where liquid biofuel production is significant and stood at 317,000 bpd in 2013. In 2006, the discovery of vast oil resources in the sub-salt strata of the Santos Basin generated huge excitement. But ultra deep water and sub-salt setting has created enormous technical challenges that translate to high costs and the new play has yet to deliver to expectations. |
|
|
|
|
|
Euan Mearns(2014/7/8)による『Brazil – Samba Energy』から |
|
 ブラジルの1次エネルギー供給力 総量2億4000万石油換算トン(2009年) 出所:国際エネルギー機関(IEA)統計を基に作成。 注:廃棄物発電にはすべての廃棄物が含まれる。 |
 再生可能エネルギーによる発電 総発電量41万5,321GWh(2009年) 出所:IEA統計を基に作成。 注:廃棄物発電にはすべての廃棄物が含まれる。 |
| 冨田(2012/8)による『石油・ガス開発のフロンティア 水力以外の電源開発急ぐ [連載]世界新エネルギー地図 第22回:ブラジル』から | |
Victor Hugo(2011/10/18)による『A Matter of Scale: Energy Flows』から |
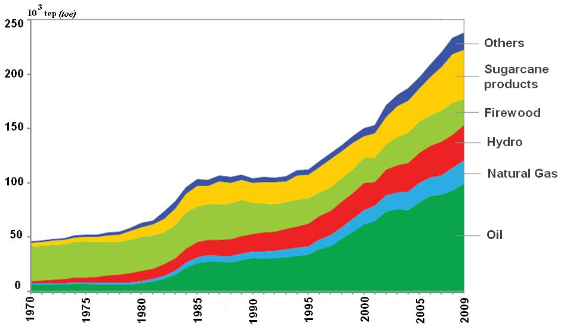 Figure 1. Brazilian Primary Energy Production (BEN 2010) |
|
Silvio Rainho Teixeira et al.(2011)による『Use of Charcoal and PartiallyPirolysed Biomaterial in Fly Ash toProduce Briquettes: Sugarcane Bagasse』から |
|
| バイオ燃料 |
|
|
||||||||||||||||||||||||||||||||||||||||||||||||||||||||||||||||||||
|
|
||||||||||||||||||||||||||||||||||||||||||||||||||||||||||||||||||||
|
|
||||||||||||||||||||||||||||||||||||||||||||||||||||||||||||||||||||
|
|||||||||||||||||||||||||||||||||||||||||||||||||||||||||||||||||||||
| Wikipedia(HP/2016/9/21)による『Ethanol fuel in Brazil』から | |||||||||||||||||||||||||||||||||||||||||||||||||||||||||||||||||||||

農林水産省(2015/3)による『ブラジルのバイオエタノールの現状と見通し』から |
|
|
|
|
|
|
|
|
| PANGEA-GBEP(2013/6/24)による『Bioenergy in Brazil』から | |
 |
|
| 柴田(2012/9)による『ブラジルのバイオエタノールをめぐる動向』から | |
|
|
| 中司・日高(2010/10)による『ブラジルさとうきび産業の情勢 ~砂糖・エタノールの需給状況と最近の業界動向~』から | |
|
|
|
Table 1. Data regarding the production of some agricultural products and the availability of residues in Brazil (residue coefficient was taken from Nogueira and Lora, 2003) |
Table 2. Characteristics of some oleaginous plants that present potential energy use |
Table 3. Potential of electricity generation out of biofuels in Brazil a Potential referring to the electricity surplus that can be supplied to the grid |
|
Table 4. Available technologies for electricity generation out of biomass for different power ranges a ICE—internal combustion engine, GMT—gas micro-turbine, SE—Stirling engine, FC—fuel cell and GT—gas turbine. |
| Lora and Andrade(2009/5)による『Biomass as energy source in Brazil』から | |
| 鉄鉱石 |
Table 2 Production of usable iron ore for the world’s top producers. US Geological SurveyのNational Minerals Information Centerによる『Global iron ore production data; Clarification of reporting from the USGS』(2017/2)から |
Table 2: Generalized percentages of elements of major interest in assessing iron ore quality. |
|
| Abraham J. B. Muwanguzi et al.による『Characterization of Chemical Composition and Microstructure of Natural Iron Ore from Muko Deposits』(2012)から | |
|
表7.Casa de Pedra鉱山の資源量と埋蔵量 表9.Engenho鉱山の資源量と埋蔵量 |
表10.Fernandinho鉱山の資源量と埋蔵量 |
|
| 菱田 元による『ブラジルの鉄鉱石資源』(2011/3)から | |
| 肥料 |
TABLE 1 Land utilization in Brazil |
FIGURE 7 Relationship between agricultural crop production and fertilizer consumption |
TABLE 10 Agriculture, fertilizer use and population (three year averages) (1) Production of the 16 main crops, adjusted to a dry weight basis: sugar cane, cassava and potato (15 percent), citrus and tomato (10 percent). |
TABLE 11 Fertilizer production, consumption and trade (‘000 tonnes nutrient) |
| FAOによる『Fertilizer Use by Crop in Brazil』(2004)から | |
| 食料資源(主に農業) |
|
|
|
|
|
|
|
|
| 米元健太・横田 徹(2016/7)による『』からブラジルの穀物生産動向 ~堅調な生産と加速化が待たれる輸送インフラ整備~』から | |
Michaei R. Rahmによる『Outlook of Brazil』(2015/9/16)から |
農林水産業の概況 (4)主要農産物の生産状況(万トン) 農林水産省(2015/9/1)による『ブラジルの農林水産業概況』から |
|
農業用地の推移 |
|
|
|
|
|
ブラジルの農地の利用状況(2006年) |
主要農作物の作付面積の推移 |
|
主要農作物の生産量の推移 |
|
| 農林水産省(2015/9/1)による『ブラジルの農林水産業概況』から | |
| サトウキビ |
|
|
||||||||||||||||||||||||||||
Wikipedia(HP/2016/9/8)による『Sugarcane』から |
|||||||||||||||||||||||||||||
|
|
|
|
Scarpare(2016/10)による『Sugarcane land use and water resources assessment in the expansion area in Brazil』から |
|
|
|
|
|
 |
 |
 |
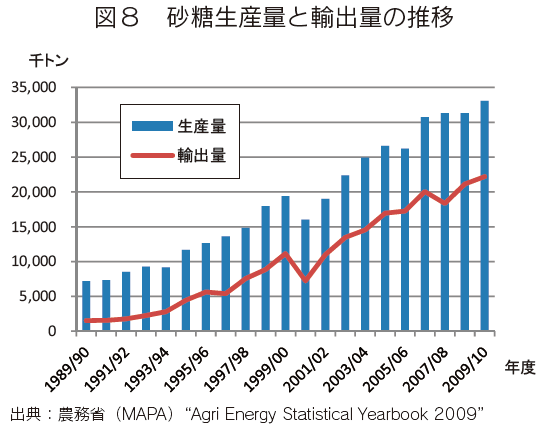 |
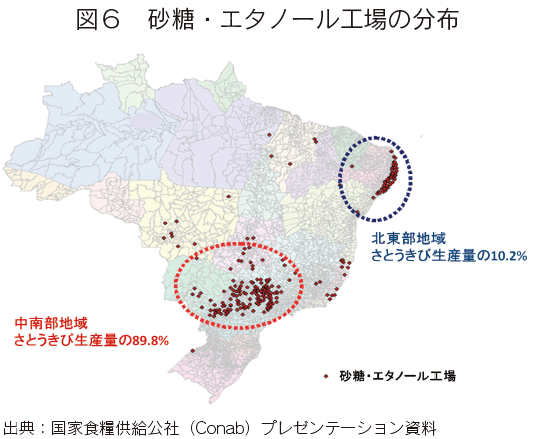
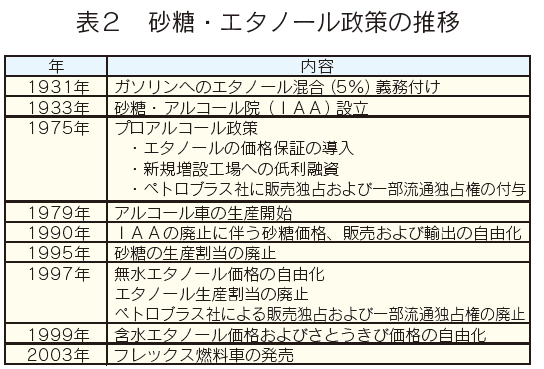
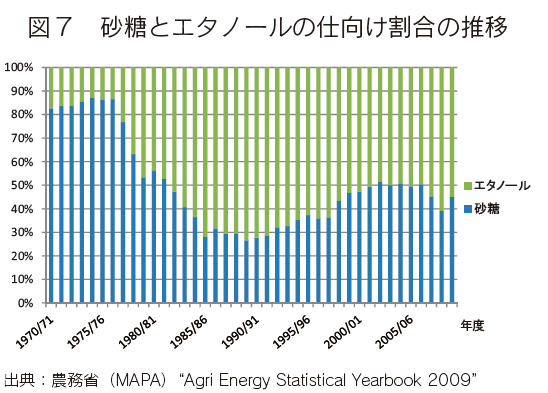
| 中司・日高(2010/10/5)による『ブラジルさとうきび産業の情勢~砂糖・エタノールの需給状況と最近の業界動向~』から | |
| 大豆 |
Wikipedia(HP/2016/9/19)による『Soybean』から |
||||||||||||||||||||||
|
|
| Francisco et al.(2014)による『Increasing Soybean Yields: Brazil’s Challenges』から | |
工藤(2013/6/26)による『ブラジルの大豆生産量がアメリカに並びました。』から |
|||||||||||||||||||||||||||||||||||
清水(2013)による『2012年のブラジル農業(大豆・トウモロコシ)』から |
|
|
|
|
|
|
|
|
| USDAForeign Agricultural Service(2012/8/10)による『Record Soybean and Corn Area Expected for Brazil’s Upcoming 2012/13 Season』から | |
| トウモロコシ |
|
|
|
|
| 山野(2016/8/10)による『ブラジル産トウモロコシ供給不足の影響』から | |
表1 トウモロコシ需給動向 |
|
|
|
|
|
|
|
|
|
表3 地域別トウモロコシの生産動向(2011/12年度) |
|
表8 トウモロコシの生産動向(2011/12年度) |
|
| 岡(2012/11)による『ブラジルのトウモロコシ生産の現状 南部パラナ州を中心に』から | |
|
表1 ブラジルの土地利用 |
|
|
|
|
|
|
|
|
表9 新規開拓可能農地 |
|
| 清水(2010)による『第4章 ブラジル産トウモロコシの需要と供給』から | |
| キャッサバ |
写真は語るPanoraGeoによる『主要10か国のキャッサバ生産量の推移』(HP/2019/3/8)から |
| 森林(林業) |
Wikipedia(HP/2016/9/10)による『Atlantic Forest』から |
フォレストパートナーシッププラットフォームによる『森林及び森林減少の現状』から 1,000 ha = 10 km2。 |
||||||||||||||||||||||||||||||||||||||||||||||||||
| ユーカリ |
Q どうしてユーカリを植林するのですか? Amapa Florestal e Celulose S.A.(AMCEL) アムセル AMCELは、植林やチップ輸出事業などを行っている日本製紙の関連事業の中で最大の植林可能面積を持つプロジェクトです。現在は日本郵船がパートナーに加わっています。 事業対象地はブラジルのアマパ州。植栽樹種はユーカリ・ユーログランディスです。54,000haの植林地を経営しており、現在日本製紙の研究部門が中心となって、精英樹の選抜、育成に取り組んでいます。 |
|
||||||||||||
| 田瀬(2014)による『ユーカリ林を組み込んだ土地利用連鎖系による持続的土地利用の実証と体系化』から | |||||||||||||
研究成果の概要(和文):ユーカリ林の環境・生態学的悪影響などを評価し、ユーカリの特性を利用し、農地からの栄養塩溶脱による地下水汚染とサトウキビの大規模耕作による土壌侵食の防止などを、ユーカリ林の植林地の配置-土地利用連鎖系-などによる営農法を提案することを目的とした。ブラジル,サンパウロ州のRio Claroにおいて、水文、 土壌調査、土地利用・営農調査などを行い、ユーカリ植林の体系や配置を工夫することにより、環境の保全に資する可能性を示した。 |
|
| 田瀬(2014)による『ユーカリ林を組み込んだ土地利用連鎖系による持続的土地利用の実証と体系化』から | |
| ユーカリ植林と環境保全 紙の需要の増大とともに、温暖化対策、薪炭材、あるいはバイオエネルギーなどと関連して木材資源が注目を集めている中で、成長速度が著しく速いユーカリの植林が世界の多くの地域で広く行われている。とくにブラジルでは、南東部(サンパウロ州、ミナス・ジェライス州など)を中心に350万haがすでにユーカリ林となっており、世界最大のユーカリ植林国となっている。また、現在の日本におけるパルプの主な輸入先は、カナダ、アメリカ、ブラジルである。ブラジルにおけるユーカリの植林は、日本の産業・経済と密接に結びついている。ユーカリの木材資源としての有用性は高いが、一方でユーカリの環境への悪影響、生態学的な影響が指摘されてもいる。すなわち、①土壌の栄養分の消費が大きく、土壌の劣化が生じる、②土壌水分を多量に吸収し、周辺の乾燥化を促進する、③外来種の広域植林により生態系の多様性が失われる、そして④ユーカリの出す化学物質が有害である場合がある、などである。これらについてはWhitehead and Beadle(2004)などのレビューがあり、オーストラリアなどの半乾燥地では弊害が出ているところもあるが、ブラジルではこれらの問題がほとんど顕在化していないというのが一般の認識となっている(桜井、1996)。この大きな要因は年平均降水量が800~1300mm位の比較的湿潤な地域に主に植林されていることが想定されるが、詳細な条件については科学的に検討する必要がある。ブラジルの植林企業は、農地や牧草地を借り上げてユーカリを植林している。パルプ用の品種は7年、薪用(製鉄用)の品種は5年で伐採されている。伐採後は、基本的にもとの状態にして地主に返還されるが、一部では土壌侵食や水資源の枯渇により、以前と同じ生産性を上げることが難しくなる場合なども指摘されている。ブラジル南東部は、トウモロコシやサトウキビの主要産地でもあり、農地からの硝酸性窒素による地下水汚染が顕在化ししつあるとともに、近年強度の激しい降雨頻度が増加する傾向にともない畑地からの土壌侵食・流亡も深刻な問題となってきている。前者の地下水汚染については、都市域の発展にともない、大都市郊外での地下水資源の競合が発生し始めている中で、実効性のある防止対策が求められている(Hirata私信、2010)。また、後者の土壌侵食の問題は、新しい問題ではないが、ブラジルではサトウキビの絞りかすや廃液の農地還元の問題と関連して、農用地における土壌保全として総合的に取り組むべき問題となってきている。 世界最大の農業国への歩みを始めているブラジルが、環境に優しい農林業の模範を科学的知見に基づき示し、我が国などとの協力で開発途上国への援助を実施・支援できる学術的体制が求められていることも本研究を推進する背景の一つでもある。 田瀬(代表)ほか(2011~2014)による『ユーカリ林を組み込んだ土地利用連鎖系による持続的土地利用の実証と体系化』から |
はじめに ― ユーカリ植林のメリット・デメリット |
|
第1表:作物別窒素・リン・カリ摂取量比較 (単位:kg/ha) |
第2表:農林作物別年間必要水量 |
第3表:作物別バイオマス生産量比較 (単位:ton/ha) |
|
| 田瀬(2014)による『ユーカリ林を組み込んだ土地利用連鎖系による持続的土地利用の実証と体系化』から | |
| 水力発電 |
Fraser(2015/4/28)による『アマゾンでダムの建設ラッシュ、今後も数百カ所に 水力発電用ダムが川や森林を脅かし、先住民の立ち退きも多発』から |
| 廃棄物/リサイクル |
表 2.2 廃棄物収集量 |
表 2.3 2008 年、ブラジル内で収集された都市廃棄物の組成 |
|
|
表 2.4 2008年の分別収集のリサイクル結果(*2007年データ) |
|
| 新日鉄エンジニアリング(株)による『平成23年度内外一体の経済成長戦略構築にかかる国際経済調査(ブラジルへの我が国企業の展開促進にかかる調査・分析)報告書』(2012/3)から | |
| CO2〔温暖化ガス(GHG)も〕 |
|
|
| FAOによるFAOSTATの『Brazil』(HP/2019/3/6)から | |
Climate Home News Ltd.による『Brazil’s carbon emissions rose 8.9% in 2016, despite recession』(2017/10/27)から |
Han Chenによる『Brazil first developing country to submit an absolute emissions target for 2025』(2015/10/2)から |
Climate Advisersによる『Who Cut the Most? Brazil’s Forest Protection Has Achieved Twice US Emissions Reductions』(2014/1/29)から |
| アマゾン |
ウィキペディア(HP/2016/7/8)による『アマゾン熱帯雨林』から |
|||||||||||||||||||||||||||||||||||||||||||||||||||||||||||||||||||||||||||||||||||||||||||||||||||||||||||||||||||||||||||||
Butler(HP/2016/7/8)による『Map of the Amazon』から |
| 窒素循環 |
|
Table 1. Estimate of cropland area, total nitrogen use in cropland and average fertiliser use in each one of the states belonging to BLPB. |
|
Table 2. Anthropogenic sources and nitrogen outputs in Brazilian La Plata river basin.
|
|
|
|
Table 4. Proportional changes (Δ) in anthropogenic input and output in BLPB considering SRES climate change scenarios A2 and B2 for 2070-2100, compared with 2002 situation. |
Watanabe et al.(2012)による『Nitrogen cycle and ecosystem services in the Brazilian La Plata Basin: anthropogenic influence and climate change』から |
|
Table 1. Nitrogen inputs in Brazil from natural and anthropogenic sources during the pre-colonization, in 1995 and 2002. |
|
|
Table 2. Import and export of N in Brazil in foodstuffs for 2002. |
|
|
Table 3. Nitrogen export in major rivers in Tg/yr. |
|
|
Table 4. Natural N fixation rates in main Brazilian biomes based on values from Cleveland et al. (1999). Fixation rates used for 70% and 30% of the Amazon basin were 14.7 and 25.8, respectively. |
|
Table 5. Anthropogenic N sources in the Amazon, Cerrado and São Paulo State in Tg/yr. Table 6. Anthropogenic N sources in the Amazon, Cerrado and São Paulo State in kg/km2/yr. |
| Filoso et al.(2006)による『Human activities changing the nitrogen cycle in Brazil』から | |
| 窒素濃度 |
|
|
Table 1. Basins, rivers, sampling sites, basin areas, discharges, population density, forest cover, sampling frequency and period of the data used in this study. |
Table 2. Basin, rivers and runoff and dissolved inorganic nitrogen (DIN), dissolved organic nitrogen (DON), total dissolved nitrogen (TDN) median values of the sampling sites. |
Table 3. Number of data, median, and lower and upper quartile of rivers of the State of So Paulo, and of the Amazon region. Concentrations are expressed in μM and flux in kg.ha-1.yr-1. Different letters indicate statistically different results at 5% level. |
|
|
|
|
Table 4. Runoff, population density and dissolved inorganic nitrogen (DIN) concentration and flux of dissolved inorganic nitrogen (FDIN) of rivers used to compare with rivers of this study. *Large tropical rivers other than those tropical rivers included in this study. **Large temperate rivers with unknown low population density. To those rivers we assigned a population density of 1 unh.km-2 because we use a logarithm scale on the horizontal axis of Figure 6. |
Table 5. Nitrogen balance for basins and regions. Nitrogen inputs (kg N.ha-1.yr-1) included biological nitrogen fixation (BNF), agricultural biological nitrogen fixation (BNF-agr), fertiliser applications, atmospheric deposition and import/export of food and feed. |
|
Martinelli et al.(2010)による『Dissolved nitrogen in rivers: comparing pristine and impacted regions of Brazil』から |
|
| 環境影響評価 |
|
|
||||||||||||||||||||||
|
Table 1 Nash-Sutcliffe (NSE) performance ratings for surveyed studies that reported hydrologfic calibration statistical results |
||||||||||||||||||||||
Table 2 Selected recent studies published in English between 2012 and 2015 which reflect key SWAT application trends in Brazil |
Table 3 Selected statistics for the studies (Table 2) that reported baseline sediment testing results |
||||||||||||||||||||||
Table 4 Climate and hydrological data sources for Brazilian SWAT applications |
Table 5 Digital Elevation Map (DEM) data sources for Brazilian SWAT applications |
||||||||||||||||||||||
Table 6 Land Use Map data sources for Brazilian SWAT applications |
Table 7 Soil Map and properties data sources for Brazilian SWAT applications |
||||||||||||||||||||||
|
|||||||||||||||||||||||
Bressiani(2015/6)による『Review of Soil and Water Assessment Tool (SWAT) applications in Brazil: Challenges and prospects』から |
|||||||||||||||||||||||
| 人口 |
|
|
| 経済産業省による『医療国際展開カントリーレポート 新興国等のヘルスケア市場環境に関する基本情報 ブラジル編』(2018/3)から | |
|
|
| (株)ユーザベースによるSPEEDAの『ブラジル経済からオリンピックを考える』(2016/8/20)から | |
| サンパウロ大学 |
| University of São Paulo Other name USP Motto Latin: Scientia Vinces (in English: "science will win" or with knowledge you will conquer, in Portuguese: "ciência vencerá"). Type Public university Established 1934 (São Paulo Law School dates from 1827) Budget R$ 4,725,126,513.00 Rector Marco Antonio Zago Academic staff 5,732 Administrative staff 15,341 Students 88,261 Undergraduates 56,998 Postgraduates 25,591 Location 9 cities: Bauru, Lorena, Piracicaba, Pirassununga, Ribeirão Preto, Santos, São Carlos, São Paulo (headquarters) and São Sebastião, in the State of São Paulo, Brazil. Website www.usp.br |
Divisions |
| ウィキペディア(HP/2013/9)による『ブラジル』から | |
|
|
|
|
Googleマップによる |
|
|
|
International Cooperative Office Universidade de São Pauloによる『International Student and Researcher's Guide』から |
|
| 歴史 |
|
|
|
|
|
|
|
|
Evolution of the administrative division of Brazil Wikipediaによる『History of Brazil』(HP/2019/2/20)から |
|||
ウィキペディアによる『ブラジルの歴史』(HP/2019/2/20)から |
|||||||||||||||||||||||||||||||||||||||||||||||||||||||||||||||||||||||||||||||||||||||||||||||||||||
| 観光・交通・宿泊 |
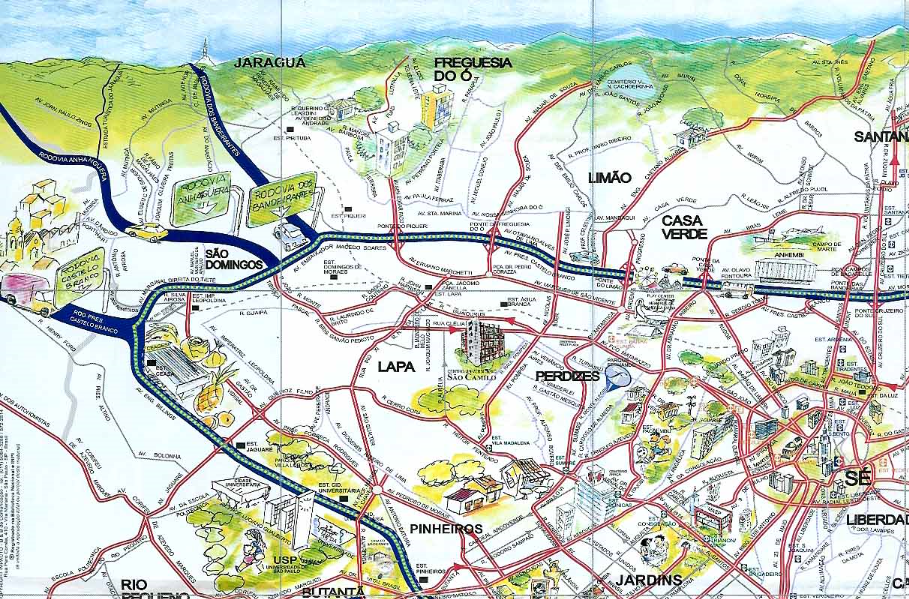 |
|
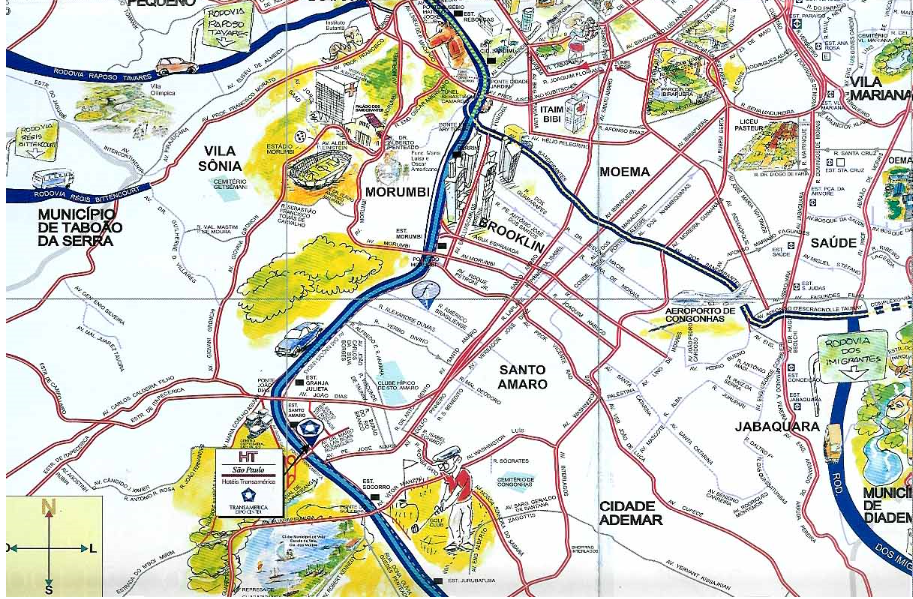 |
|
| PACKTOURS(HP/2016/9/16)による『(Map of São Paulo)』から | |
Booking.com(HP/2016/9/16)による『サンパウロのホテル・宿』から |
|
|
| JAPAN AIRLINES(2015/3/12)による『JAL、ブラジル線でTAM航空とのコードシェアを開始』から | |
| 対蹠地 |
ウィキペディア(HP/2016/9/27)による『ファイル:WorldMapWithAntipodes.png』から |
|
|
| ウィキペディア(HP/2016/9/27)による『対蹠地』から | |
In Deepによる『「日本の裏側」に近年最大の隕石が落ちた日に見る「異常なレベルで激増する小惑星、火球、そして宇宙線」のデータ』(2016/2/23)から |