セントラル科学(株)(HP/2016/8/28)による『全窒素測定法』による |
||||||||||||
東レテクノ(株)(2016/4/7)による『全窒素(総窒素)の分析』から |
|
|
最終更新日:2019年1月8日
| 全般 | 窒素を含む化学種 | 窒素フロー | 窒素資源関連 | その他 |
| リンク|
窒素分析法| 窒素含有量| 環境基準| |
窒素化学種|
Eh-pH| 硝酸塩濃度| |
窒素循環|窒素フットプリント|
硝化-脱窒| |
肥料|
汚水処理| |
根粒|
食料と窒素| 環境問題と窒素| |
| 元素記号Nで原子番号(Atomic Number)7の窒素(Nitrogen)元素について、主に物質循環(Substance Cycle)関連の情報を集めている。 |
| リンク |
| 全般 | 窒素を含む化学種 | 窒素フロー | 窒素資源関連 | その他 |
| 全般|
窒素分析法| 窒素含有量| 環境基準| |
窒素化合物|有機窒素化合物|
窒素酸化物| 硝酸態窒素| アンモニア態窒素| |
窒素フロー| 窒素循環|窒素フットプリント| 硝化と脱窒| 窒素固定| 窒素同化|窒素代謝| |
肥料|
尿| 汚水処理| |
根粒|
窒素細菌| 食料と窒素| 環境問題と窒素| その他 |
【窒素細菌】(硝化細菌+脱窒菌)(窒素固定細菌は根粒菌を参照)
| 窒素分析法 |
| 試料の状態 | 窒素化学種の種類など | 分析法 | 文献 | ||
|---|---|---|---|---|---|
| 液体(淡水) | 全 窒 素 |
無機態窒素 | 硝酸態窒素 | 銅・カドミウムカラム還元ナフチルエチレンジアミン吸光光度法 | ・農研機構(2012):硝酸態窒素分析法 |
| 亜硝酸態窒素 | ナフチルエチレンジアミン吸光光度法 | ・北川ほか(2013):水道水中における亜硝酸態窒素の挙動と分析方法の検討 | |||
| アンモニア態窒素 | インドフェノール青吸光光度法 | ・(株)小川商会(HP/2016):アンモニア態窒素の分析 ・EICネット(2007):アンモニアの分析 |
|||
| 有機態窒素 | ・宮原(1966):有機窒素分析法 | ||||
| ケルダール窒素 | 有機態窒素+ アンモニ ウム態窒素 |
ケルダール法(Kjeldahl method) |
・須藤ほか(2009):ケルダール性窒素とアンモニア性窒素に関する不整合測定試料の事例(資料) | ||
| 全窒素 | 総和法 | ・セントラル科学(株)(HP/2016):全窒素測定法 ・東レテクノ(株)(2016):全窒素(総窒素)の分析 |
|||
| 液体(海水) | 全窒素 | ・井上・林(2006):海水中全窒素の簡易分析法の調査・検討 | |||
| 気体 | 亜酸化窒素(N2O) | ・ジーエルサイエンス(株)(HP/2016):トピックス(亜酸化窒素(N2Oの分析)) |
|||
| 一酸化窒素(NO) | ・小口(2005):一酸化窒素と二酸化窒素の同時濃度測定 | ||||
| 二酸化窒素(NO2) | |||||
| 窒素酸化物 | ・日本工業規格(2011):排ガス中の窒素酸化物分析方法(JISK 0104) | ||||
| 固体 | 植物 | ・京都大学農学部(HP/2016):第4節 植物の生長と施肥:試料の窒素分析法 ・実山(2016):植物組織窒素定量マニュアル ―ケルダール法― |
|||
| 動物 | |||||
| 家畜糞堆肥 | ・農研機構(2011):新たな窒素肥効分析法に基づいた家畜ふん堆肥の施用支援ツール ・加藤(2010):家畜ふん堆肥の適正利用に向けた堆肥と畑土壌地力窒素の簡易測定 ・農研機構(2008):新たな窒素肥効分析法に基づいた家畜ふん堆肥の施用支援ツール |
||||
| 汚泥 | ・坂本ほか(2009):ペルオキソ二硫酸カリウム分解による汚泥系資料の全窒素分析について | ||||
| 土壌 | ・松永・森泉(2012):土壌の可給態窒素分析法と課題 | ||||
| 『文献』の列以外のリンクはウィキペディア。 | |||||
セントラル科学(株)(HP/2016/8/28)による『全窒素測定法』による |
||||||||||||
東レテクノ(株)(2016/4/7)による『全窒素(総窒素)の分析』から |
| 窒素含有量 |
Junko Shindo, Katsuo Okamoto and Hiroyuki Kawashimaによる『A model-based estimation of nitrogen flow in the food production–supply system and its environmental effects in East Asia』(2003/11/1)から |
|||||||||||||||||||||||||||||||||||||||||||||||||||||||||||||||||||||||||||||||||||||||
| 環境基準 |
環境省(HP/2016/8/30)による『大気汚染に係る環境基準』から |
||||||||||||
環境省(HP/2016/8/30)による『水質汚濁に係る環境基準』から |
||||||||||||||||||||||||||||||||||||||||||||||||||||||||||||||||||||||||||||||||||||||||||||||||||
環境省(HP/2016/8/30)による『地下水の水質汚濁に係る環境基準について』から |
||||||||||||
| 窒素化学種 |
|
化学種 (Species) |
名称(Name) | 状態 (State) |
特性(Properties) |
酸化状態 (Oxidation State) |
| N2O5 | 五酸化二窒素(Dinitrogen pentoxide) | 固体 | 白色、融点30℃、沸点47℃(分解)、密度1.642 g/cm3 (18 ℃)。 | +5 |
| NO3- | 硝酸イオン(Nitrate ion) | (液体) | +5 | |
| HNO3 | 硝酸(Nitric acid) | 液体 | 無色、融点-41.6℃、沸点82.6℃、密度1.5129 g/cm3。 | +5 |
| N2O4 | 四酸化二窒素(Dinitrogen tetroxide) | 気体 | 無色、融点-11.2℃、沸点21.1℃、密度1.443 g/cm3 (液体, 21 ℃)。 | +4 |
| NO2 | 二酸化窒素(Nitrogen dioxide) | 気体 | 褐色、融点-11.2℃、沸点21.1℃、密度3.4 kg/m3 (気体、22 ℃)。 | +4 |
| N2O3 | 三酸化二窒素(Dinitrogen trioxide) | 液体 | 濃青色、融点-100.1℃、沸点3℃、密度〔1.4 g/cm3 液体(1.783 g/cm3 気体)〕 | +3 |
| NO2- | 亜硝酸イオン(Nitrite ion) | (液体) | +3 | |
| HNO2 | 亜硝酸(Nitrous acid) | 液体 | 沸点103℃、密度~1 g/cm3。 |
+3 |
| NO | 一酸化窒素(Nitric oxide) | 気体 | 無色、融点-163.6℃、沸点-151.7℃、密度1.3402 g/dm3。 | +2 |
| N2O | 亜酸化窒素(Nitrous oxide) | 気体 | 無色、融点-90.86℃、沸点-88.48℃、密度1.977 g/L (gas)。 | +1 |
| N2 | 窒素ガス(Nitrogen) | 気体 | 無色、融点-210.00℃、沸点-195.79℃、密度1.251 g/L。 | 0 |
| NH2OH | ヒドロキシルアミン(Hydroxylamine) | 固体 | 白色、融点33℃、沸点58℃、密度1.21 g/cm3 (20℃)。 | -1 |
| N2H4 | ヒドラジン(Hydrazine) | 液体 | 無色、融点1℃、沸点114℃、密度1.013(8) g/cm3。 | -2 |
| NH4+ | アンモニウムイオン(Ammonium ion) | (液体) | -3 | |
| NH3 | アンモニア(Ammonia) | 気体 | 無色、融点-77.73℃、沸点-33.34℃、密度0.86 kg/m3 (1.013 bar at boiling point) 。 |
-3 |
| CO(NH2)2 | 尿素(Urea) | 固体 | 白色、融点133-135℃、沸点、密度1.32 g/cm3。 | -3 |
| リンクはウィキペディア。 | ||||
ウィキペディア(HP/2016/8/26)による『炭素-窒素結合』から |
|
|
|
|
|||
|
全窒素 (結合態窒素) |
反応性窒素 | 可給態窒素 |
栄養塩 (DIN)※3 |
||
|
|
アンモニア(NH3)、アンモニウム(NH4+) | ○ | ○ | ○ | ○ |
| 尿素((NH2)2CO) | ○ | ○ | ○ | ||
| 遊離アミノ酸 | ○ | ○ | ○ | ||
| その他の有機態窒素(易分解性)※1 | ○ | ○ | (○) | ||
| その他の有機態窒素(難分解性)※1 | ○ | (○) | |||
| -2 | ヒドラジン(N2H4) | ○ | ○ | ||
| -1 | ヒドロキシルアミン(NH2OH) | ○ | ○ | ||
| 0 | 窒素ガス(N2) | ||||
|
|
一酸化二窒素(亜酸化窒素、N2O)※2 | ○ | |||
| ニトロソ化合物(R-NO) | ○ | ○ | |||
| +2 | 一酸化窒素(NO) | ○ | ○ | ||
|
|
亜硝酸イオン(NO2-) | ○ | ○ | ○ | ○ |
| ニトロ化合物(R-NO2) | ○ | ○ | |||
| +4 | 二酸化窒素(NO2) | ○ | ○ | ||
| +5 | 硝酸イオン(NO3-) | ○ | ○ | ○ | ○ |
|
※1 有機態窒素とは有機化合物の中に共有結合として含まれている窒素原子を指す。-3以外の酸化数を持つ有機態窒素も存在する。 ※2 一酸化二窒素の酸化数は正確には一方の窒素原子が0、他方が+2で、平均して+1となる。 ※3 栄養塩にはDINのほかに、リン酸イオン(PO43-)やケイ酸(Si(OH)4)も含まれる。 |
|||||
| Compound | Oxidation state | |
| Nitrate | NO3- | +V |
| Nitrogendioxide | NO2 | +IV |
| Nitrite | NO2- | +III |
| Nitric oxide | NO | +II |
| Nitrous oxide | N2O | +I |
| Di nitrogen | N2 | 0 |
| Hydroxylamine | NH2OH | -I |
| Hydrazine | N2H4 | -II |
| Ammonium | NH4+ | -III |
| Amino acids | R-NH2 | -III |
| Urea | NH2CONH2 | -III |
| Eh-pH |
/Image696.gif) Figure 4-9. Eh-pH diagram for the nitrogen system at 25℃. N2 = 0.77 atm and activity of the dissolved species = 10-3 mol L-1. The dashed lines indicate the boundary between NO3- and NO2- for activity rations of 1 and 104. Because N2 is a more reduced form of nitrogen, NO2- must exist metastably in this region. Only at very low concentrations of NO2- would it be the stable species relative to N2. faculty.uml.edu/Nelson_Eby/(HP/2014/5)による |
/Image700.gif) Fig. 1 Pourbaix diagram of nitrogen (N) representing the various forms of N in a 100 μM solution at 25℃ as a function of Eh (in V) and pH. Diagram adapted from MEDUSA Software. Puigdomenech 2009.2011 Husson,O.(2012/9)による『Redox potential (Eh) and pH as drivers of soil/plant/microorganism systems: a transdisciplinary overview pointing to integrative opportunities for agronomy』から |
/Image694.gif) Fig. 3 pe-pH diagram for nitrogen system at 25℃. The diagram is valid under the conditions that PN2 = 0.77 atm and the activities of dissolved species are 10-3 unless otherwise specified. Metastable boundaries are indicated by dashed lines. Eh = (2.303RT/F) pe (F is Faraday’s constant) Li,X. et al.(2012)による『Relation between nitrous oxide production in wetland and groundwater: a case study in the headwater wetland』から |
/Image692.gif) Fig. 6 pH-pe diagram for the nitrogen in the Sanjiang Plain. The shallow groundwater was defined as the group with the mean depth smaller than 30 m, while the deep groundwater was defined as the group with the mean depth larger than 50 m. Cao,Y. et al.(2012/7)による『Characteristics of nitrate in major rivers and aquifers of the Sanjiang Plain, China』から |
/Image698.gif) Fig. 2 Fields of the nitrogen species on an Eh-pH diagram. The boundary for theNO3-/NO2- pair occurs in the nitrogen gas field. There is no stability field for nitrite. In most reactions nitrate first converts to nitrite before converting to gaseous nitrogen. |
/Image699.gif) Fig 3. Eh-pH diagram with a more restricted pH range than that shown in Fig. 2 with the calculated Eh based on NO3-/NH4+ for SCWA groundwater data and for dissolved oxygen for SCWA water in the Northport area (Bleifuss et al, 2000). The nitrogen gas field is shown in light green. |
| Xu,S. and Hanson,G.N.(2000?)による『Is there denitrification in Long Island ground Water?』 | |
/Image691.gif) Figure 12.2. pE/pH Diagram for Nitrogen (N-O-H System) |
/Image693.gif) Figure 12.3. Diagram for Nitrogen, Sulfur and Carbon |
| HBCU/MI Environmental Technology Consortium(2007/2)による『Lecture 12 Review of Oxidation/Reduction, Oxidation/Reduction in the Natural Environment』から | |
|
Figure 3 shows that there is a potential for denitrification in Long Island ground water. Nitrogen gas is stable within the NO3-/NO2- field. /Image695.gif) Figure 3. Eh-pH diagram for ground water data of Long Island from Suffolk County Water Authority. Xu,X.(2006/4)による『Groundwater Research Group』から |
/Image711.gif) |
/Image712.gif) |
/Image713.gif) |
/Image714.gif) |
|
|
|||
/Image715.gif) Figure 73: Eh-pH diagrams of the system N-O-H (2). ΣN=10-10, 298.15K, 105 Pa. |
|||
| Takeno,N.(2005)による『Atlas of Eh-pH diagrams Intercomparison of thermodynamic databases』から | |||
/Image697.gif) Figure 12: log-C vs pE diagrams for nitrogen Stephen K. Lower(1998/5)による『Redox equilibria in natural waters』から |
| 硝酸塩濃度 |
環境庁告示第10号(1997年3月)による地下水の水質汚濁に係る環境基準についてには、硝酸性窒素及び亜硝酸性窒素の基準値は10mg/L(=10
mg NO3-N/L)以下とされている。また、環境庁告示第59号(1971年12月)による水質汚濁に係る環境基準についての別表1 人の健康の保護に関する環境基準においても硝酸性窒素及び亜硝酸性窒素の基準値は10mg/L
以下とされている。
なお、10mg NO3-N(硝酸態窒素)≒44.3mg NO3-(硝酸イオン)である。
また、JEFCA(FAO/WHOの食品添加物に関する合同専門家委員会)およびSCF(EU食品科学委員会では、一日体重1kg当たり3.7mg
NO3-(ADI)としている。
農林水産省(HP/2013/8)による『日本の野菜の硝酸塩含有量』から リンクはウィキペディア。 |
||||||||||||||||||||||||||||||||||||||||||||||||||||||||||||||
村上(2011/12/15)による『硝酸イオンの同位体組成を用いた雨天時排水中の窒素起源の評価』から |
/Image35.gif) 図5 全国サンプルのNO3-N 分布図. No.1 ~ 97 までは平成の名水百選データを引用. 藪崎(2010)による『日本の地下水・湧水等の硝酸態窒素濃度とその特徴』から |
| 窒素循環 |
|
|
| 横浜国立大学(種田あずさほか)による『国際貿易が引き起こす窒素汚染の実態を解明-窒素による地球環境汚染、日本は輸入の影響が突出-』(2018/1/26)から | |
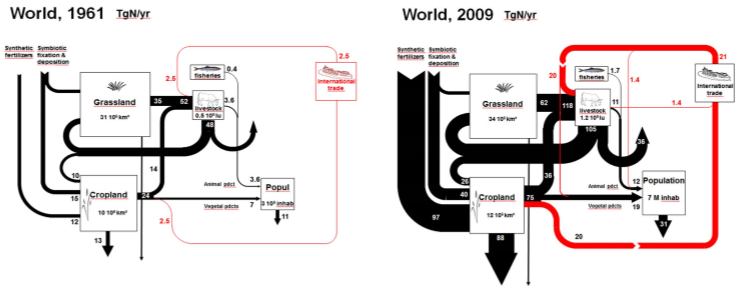 Figure1. Generalized representation of N transfers through the world agro-food system (GRAFS) in 1961 and 2009. |
|
|
|
|
|
|
|
| Lassaletta et al.による『Nitrogen use in the global food system: past trends and future trajectories of agronomic performance, pollution, trade, and dietary demand』(2016/9/14)から | |
|
|
|
|
|
|
|
|
|
|
|
|
| Lassaletta et al.(2016)による『Nitrogen use in the global food system: Past trends and future trajectories of agronomic performance, pollution, trade, and dietary demand』から | |
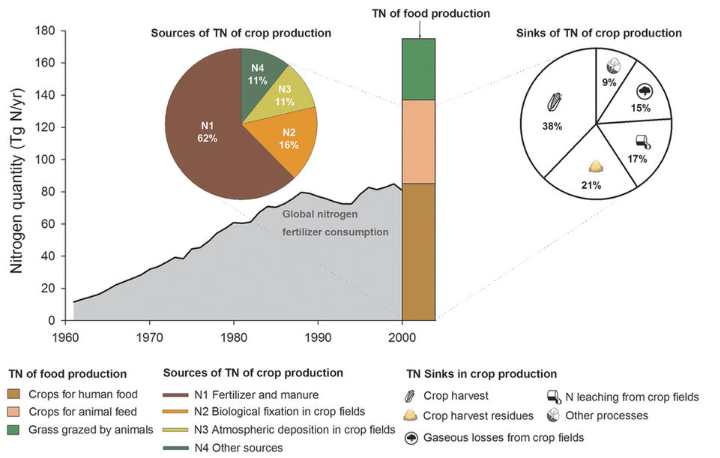 Figure 1: Total nitrogen input (TN) of food production. Left: Sources of reactive N involved in food production (animal and plant products). Right: Sinks of reactive N, showing the fate of this N. Less than 40% of the TN of crop production directly becomes human food. |
|
|||||||||||||||||||||||||||||||||||||||||||||||||||||||||||||||||||||||||||||||||||||||||||
|
||||||||||||||||||||||||||||||||||||||||||||||||||||||||||||||||||||||||||||||||||||||||||||
| Junguo Liu et al.による『Reducing human nitrogen use for food production』(2016/7/22)から | ||||||||||||||||||||||||||||||||||||||||||||||||||||||||||||||||||||||||||||||||||||||||||||
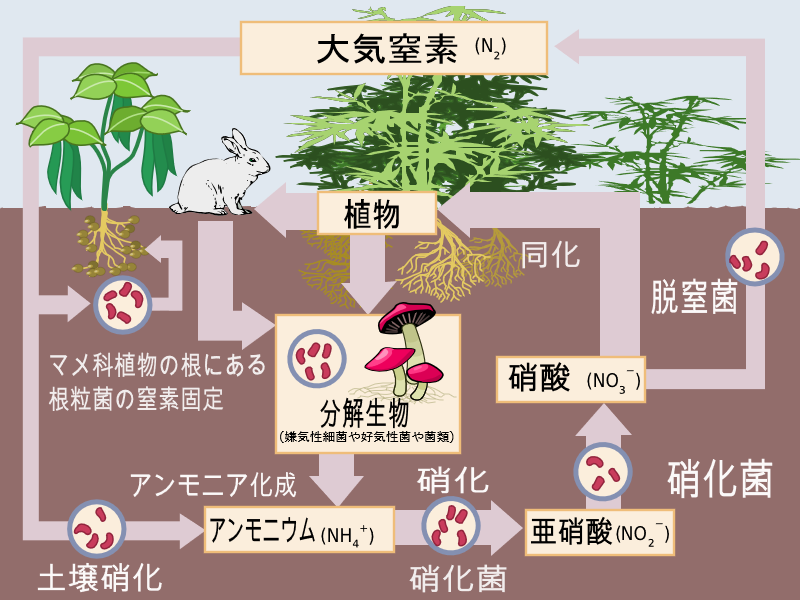 窒素循環のモデル図 ウィキペディア(HP/2016/8/31)による『窒素循環』から |
|
|
※SEAは東南アジア。 |
|
| Chen Liu et al.による『Socioeconomic Driving Factors of Nitrogen Load from Food Consumption and Preventive Measures』(2014/9)から | |
UNEP(2014)による『UNEP Year Book 2014 emerging issues update Excess Nitrogen in the Environment』から |
|
|
|
|
| Sutton,M.A. et al.(Ed)(2011)による『The European Nitrogen Assessment』の中の『Technical summary』から | |
|
|
| Sutton,M.A. et al.(Ed)(2011)による『The European Nitrogen Assessment』の中の『Chapter 10 Nitrogen flows in farming systems across Europe』から | |
Notes : The calculation of fossil fuel input has been based on total gasoline consumption for France, weighted by the urban population of the Paris Metropolitan area. Rough assumptions had to be made regarding gasoline N content, fuel N conversion rate in combustion and that the average per capita consumption for France was a suitable indicator for Paris. In reality, it is likely that the urban population will rely more on public transport and this figure may be an overestimation, however, it indicates that the bulk of emissions from fossil fuel combustion stem from N2 conversion of air N content in the combustion process, whereas the fuel N contribution is comparatively small. It has to be stated as well, that this figure only covers gasoline consumption, which is assumed to be the largest contributor of fossil fuel Nr import into the city. Sutton,M.A. et al.(Ed)(2011)による『The European Nitrogen Assessment』の中の『Chapter 12 Nitrogen flows and fate in urban landscapes』から |
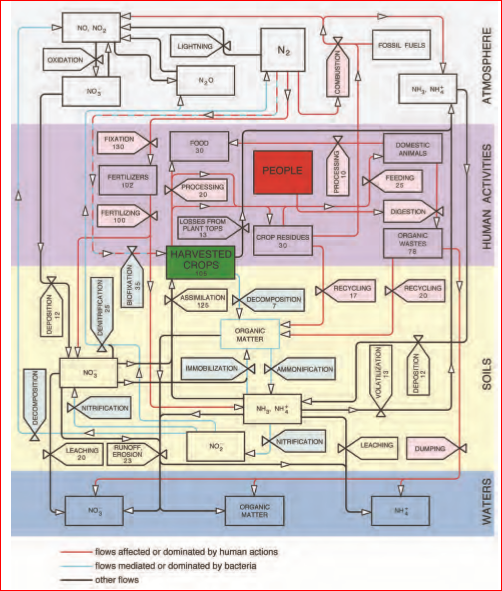 Fig. 1: Nitrogen cycling in the global agroecosystem. Stores are shown as rectangles and flows as valves. The cycle is subdivided into its three principal environmental compartments (atmosphere, soils and waters) and all flows affected or dominated by human actions (and hence the targets of possible efficiency improvements) are shown in red while the flows mediated or dominated by bacterial metabolism are in blue. The latest available crop production, livestock and fertilizer statistics from FAO and IFA and nitrogen contents from Smil (2001) were used to calculate the stores and flows as annual averages for the period 2005-2009. Their accuracy varies from high (fertilizers, food) to poor (runoff, denitrification). Food (30 Mt N) corresponds to average global per capita daily intakes of 50 g of plant and 25 g of animal protein (excluding aquatic species). The difference between fixation and fertilizers is ammonia used as feedstock in chemical syntheses. |
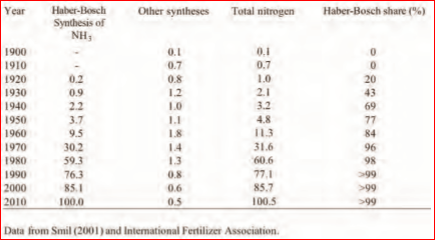 |
| Smilによる『Nitrogen cycle and world food production』から | |
|
|
|
|
| Junko Shindo et al.による『Nitrogen flow associated with food production and consumption and its effect on water quality in Japan from 1961 to 2005』(2010/12/21)から ※図と図の説明とが異なっているものがあるが、原著のままにしている。 |
|
|
|
|
|
| (独)農業環境技術研究所(2009/8/18)による『食料生産・消費に伴う環境への窒素流出と水質汚染の変化を推定するモデルを開発 -将来の食料需給や農業生産の変化が環境に与える影響の予測への利用が期待-』から | |
大串(2008/6/27)による『10. 日本の窒素循環―有機性廃棄物大国日本』から |
大串(2008/5/24)による『3. 自然界における窒素の循環』から |
農業環境技術研究所(2005)による『農業における窒素と環境の関わり』から |
植田(2000/3/3)による『湖沼における窒素の循環』から |
| 窒素フットプリント |
|
表1 窒素フットプリント(NF)評価方法の枠組み |
|
表2 N-Calculatorで用いられる各国の主要食品別の仮想窒素係数 |
表3 水産物分類および漁業形態による水産物の仮想窒素係数(VNF) |
|
|
|
|
|
|
|
| 種田あずさ(Azusa OITA)ほかによる『窒素フットプリント:環境への窒素ロスを定量する新たな指標』(2018/4)から | |
|
|
|
|
|
Table 1: Comparisons of global nitrogen accounting for food |
| Junguo Liu et al.による『Reducing human nitrogen use for food production』(2016/7/22)から | |
|
|
|
|
|
|
| 江口定夫による『日本人の窒素フットプリント』(2015?)から | |
| 硝化-脱窒 |
/Image36.gif) |
AnammoxとはAnaerobic ammonia oxidationの略称であり、3つの単語のアタマの2~3文字を組み合わせた造語である。日本語では「嫌気性アンモニア酸化」である。Anammoxはある特定の微生物が酸素の無い条件で亜硝酸をアンモニアで還元して窒素に変える反応であり、水に溶けている亜硝酸を窒素ガスに変える点ではこれまで良く知られている微生物の働きのひとつである脱窒と同じである。したがって、見かけ上はアンモニアを使う’脱窒’と言ってよい。Anammoxは、理由は解らないがどんどん窒素ガスが出るヨーロッパのある奇妙な廃水処理施設を丹念に研究したオランダの微生物学者たちによって1990年代に発見された、きわめて新しい微生物による環境浄化機能である。 |
| 産総研環境管理技術研究部門による『Anammox』(2007/3)から | |
| 肥料 |
放射線医学総合研究所(2010?)による『肥料』から |
||||||||||||||||||||||||||||||||||||||||||||||||||||||||||||||||||||||||||||||||||||||||||||||||||
| 汚水処理 |
[ 参考 ] 窒素・りん同時除去方法 内藤環境管理(株)による『排水の窒素・りん処理方法』(2004/9)から |
||||||||||||||||||||||||||||||||||||||||||||||||||||||||||||||||||||||||||||||||||
| 根粒 |
植田(2000/3/3)による『湖沼における窒素の循環』から |
南澤(2009?)による『ダイズ根粒根圏からの温室効果ガス発生: 根圏土壌生物のランチタイム』から |
|
|
表1 窒素固定微生物と緑色植物との共生 |
|
表2 根粒菌の3大属とその特徴 |
|
渡辺(1996?)による『根粒菌の共生的窒素固定』から |
|
| 食料と窒素 |
川島博之による『21世紀における世界の食料生産』(2008/8)から |
西尾道徳の環境保全型農業レポートによる『1980年代以降の日本における食料供給システムにおける窒素の収支』(2004/12/8)から |
| 環境問題と窒素 |
林健太郎による『世界の中の日本として窒素問題にどのように向き合うべきか』(2015?)から |
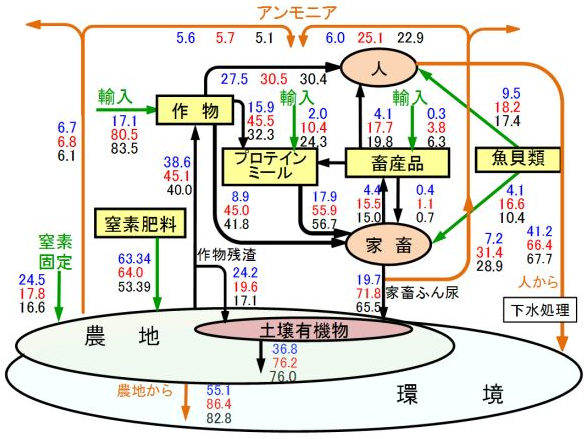 図1 食料生産・消費に伴う窒素循環モデルの概要とわが国の窒素フロー推定結果 青字:1961年、赤字:1988年、黒字:2003年 (単位 万トン)。 肥料や家畜ふん尿から発生するアンモニアは移流、拡散して、ガスや粒子として、また降水に溶けて、陸域に広く沈着する。プロテインミールとは、ダイズなどの油脂作物の絞り滓などを原料とした高タンパク飼料。本推定では魚肉などを原料に作られたミールは、「魚貝類」に含めた。人からの排出量は下水処理前の値。 |
|
|
|
| (独)農業環境技術研究所による『食料生産・消費に伴う環境への窒素流出と水質汚染の変化を推定するモデルを開発-将来の食料需給や農業生産の変化が環境に与える影響の予測への利用が期待-』(2009/8/18)から | |
八千代エンジニヤリング(株)によるちょっとイイ話の『あふれる窒素をどうするか??』(2009/1)から |
大串和紀による農業における窒素循環の視角から循環型社会を展望するの『10. 日本の窒素循環―有機性廃棄物大国日本』(2008/6/27)から |