/Image920.gif) White phosphorus and resulting allotropes /Image921.gif) Wikipedia(HP/2011/8)による『Allotropes of phosphorus』から allotrope(allotropy)=同素体(多形あるいは同質異像であるが、単一元素からなる場合は同素体とも呼ばれる) |
|
|
最終更新日:2016年10月26日
|
|
||||
| 全般 | 資源⇒こちら | フロー⇒こちら |
|
その他 |
|
リンク⇒こちら| リンの化学分析法⇒こちら| 比色分析とICP分析の比較| 元素リン| 吸着⇒こちら| |
全般| 埋蔵量・生産量| 消費量| 価格| ピーク・リン| リン鉱床| モロッコと西サハラ| 肥料| リン回収(資源化) |
リン循環(世界)| リン収支(地域)| リン分布| 各国のリンフロー| |
環境基準(リンおよび窒素)|
Eh-pH| 自然界のリン濃度| リンを含む化学種| 鉄酸化物への収着⇒こちら| |
MAP/HAP(リン酸マグネシウムアンモニウム/ヒドロキシアパタイト)|
生体中のリン| |
|
元素記号Pで原子番号(Atomic Number)15のリン(Phosphorus)元素について、主に物質循環(Substance
Cycle)関連の情報を集めている。 リン資源とは一般にカルシウムリン酸塩鉱物〔燐灰石(りんかいせき)、apatite、アパタイト〕を主体とするリン鉱石を指すが、その用途の大部分(世界で約9割)は肥料(Fertilizer)である。植物(Plant)の生育(Growth)には窒素(N)およびカリ(K)と並んで必須(Essential)であるが、いわゆる生元素(Bio-element)として重要な元素である。自然界(Nature)では、リン酸塩鉱物(Phosphate Mineral)として存在するものが圧倒的に多い。 |
| 比色分析とICP分析の比較 |
※溶液中のリン(P)の定量分析法として、もっとも汎用されている2つの方法の比較の例である。比色分析は、物質が光を吸収する現象を利用した分析法である。一方のICP分析は、ICP(inductively coupled plasma、高周波誘導結合プラズマ)を光源とする発光分光分析の一種であり、試料は約6000K(ケルビン温度)に加熱されるとされる。
|
1)一般的に、ICP分析による方が、比色分析〔Colorimetric
P Analysis:Murphy and Riley(1962)が開発した方法が代表的〕によるよりもP濃度が高くなる場合が多い。とくに、P濃度が低い場合に、相違は大きくなる。 SERA-17 Task ForceMembers(HP)による『Comparing Methods of P Analysis- ICP and Spectroscopy』から |
| 元素リン |
※リンだけから構成される物質、つまり化学組成Pの物質には、結晶構造が異なるものが複数存在する。一般に化学組成が同じで結晶構造が異なるものを多形(polymorphism)あるいは同質異像と呼ぶが、単一元素の場合は同素体(allotrope)とも呼ばれる。リンの他に炭素(C)の場合が良く知られている。リンの同素体は10数種類存在すると主張する研究者もいるが、代表的なものは白(white)と紫(violet)と黒(black)とされる場合が多い。黄は白の表面の一部が紫に変わったもので、赤は紫に白が少し混じったものとされている。これら同素体の相関係は明確ではないし、それぞれの物性も研究者によって変動する。つまり、良く知られた元素であるにもかかわらず、不明な点が多く残されている。【参考】(リンの同素体について)
/Image920.gif) White phosphorus and resulting allotropes /Image921.gif) Wikipedia(HP/2011/8)による『Allotropes of phosphorus』から allotrope(allotropy)=同素体(多形あるいは同質異像であるが、単一元素からなる場合は同素体とも呼ばれる) |
/Image924.gif) 図5 リンの高温高圧状態図 液体の低圧相(低密度相)から高圧相(高密度相)への転移は1GPa(-1万気圧)付近、900°C以上の高温で起こる。低圧液体相ではリンの4原子からなるピラミッド構造が、高圧液体相では切れ切れになったポリマー構造が主要な構成要素であると考えられ、それらの構造が相境界を境に突然変わる。 |
/Image922.gif) Figure 5 The possible P-T diagram of the stable region for red phosphorus, when ΔVb→l= 0.95ΔVr→b. Brazhkin and Zerr(1992)による『Relative stability of red and black phosphorus at P<1 GPa』から |
/Image923.gif) Goh(1983)による『Teaching phase diagrams of sulphur and phosphorus』から |
| 環境基準(リンおよび窒素) |
環境省(1997/3)による『地下水の水質汚濁に係る環境基準について』から |
|||||||||
1 河川(2) 湖沼(天然湖沼及び貯水量が1,000万立方メートル以上であり、かつ、水の滞留時間が4日間以上である人工湖) イ
環境省(1971/12)による『水質汚濁に係る環境基準について』から |
||||||||||||||||||||||||||||||||||||||||||||||||||||||||||||||||||||||||||||||||||||||||||||||||||||||||||||||||||
| Eh-pH |
/Image704.gif) Fig. 2. Thermodynamic stability diagrams for P species. (A) Eh-pH diagram for P species at 298 K, 10-6 M, with dashed lines representing the present-day atmosphere (Upper) and lower limit on water stability (Lower). (B) Condensation sequence for P minerals assuming 10-4 bar and solar elemental abundances. |
/Image705.gif) Fig. 5. Eh-pH diagram for radical aqueous P species, 10-6 M, with dashed lines representing the present-day atmosphere (Upper) and lower limit on water stability (Lower). |
| Pasek,M.A.(2008)による『Rethinking early Earth phosphorus geochemistry』から | |
/Image706.gif) |
/Image707.gif) |
/Image708.gif) |
/Image709.gif) |
|
|
|||
/Image710.gif) Figure 87: Eh-pH diagrams of the system P-O-H (2). ΣP=10-10, 298.15K, 105 Pa. |
|||
| Takeno,N.(2005)による『Atlas of Eh-pH diagrams Intercomparison of thermodynamic databases』から | |||
/Image702.gif) Fig. 1. Species abundance, as a percentage of the total concentration are shown for phosphate (A), phosphite (B), and hypophosphite (C) species. At circumneutral pH (typical of surface waters), the dominant species are H2PO4- and HPO42- for phosphate, H2PO3- and HPO32- for phosphite, and H2PO2- for hypophosphite. |
/Image703.gif) Fig. 2. Eh/pe-pH diagram for P species in water. For calculations involving equilibrium between reduced P species and phosphine (i.e., dashed lines including PH3), an equilibrium concentration of 10-6 M for the reduced P compound was assumed. The dashed line with PH2 = 1 atm is shown as a reference for a reducing environment on Earth. |
| Hanrahan,G. et al.(2005)による『Reduced inorganic phosphorus in the natural environment: significance, speciation and determination』から | |
/Image690.gif) Figure 1. Influence of pH on the distribution of orthophosphate species in solution. Tisdale, S.L., W.L. Nelson, J.D. Beaton, and J.L. Havlin. 1993. Soil Fertility and Fertilizers. 5th ed. MacMillan, New York, NY. Thomason(2002)による『Understanding Phosphorus Behavior in Soils』から |
/Image701.gif) Fig.5. Theoretical pe/pH diagram with stability fields for strengite and apatite. Squares represent actual pe/pH measurements at time of sampling. Moor,P.A.,Jr. and Reddy,K.R.(1994)による『Role of Eh and pH on phosphorus geochemistry in sediments of Lake Okeechopbee, Florida』から |
| 自然界のリン(P)濃度 |
| 固体 | 地球 | 690 | Allegre(最初のeの頭に`)ほか(2001) | |
| 1,000~2,130 | 鹿園(1992) | |||
| 核 | 2,000~5,000 | 松尾(監修)(1989) | ||
| 地殻 | 520(日本の上部地殻) | Togashi et al.(2000) | ||
| 700(上部地殻) | McLennan(2000) | |||
|
665(上部地殻)、 872(下部地殻)、 757(大陸地殻) |
Wedepohl(1995) | |||
| 1,000 | 南川・吉岡(編)(2006) | |||
| 1,050 | Krauskopf & Bird(1995)、西村(1991) | |||
| 岩石 |
390(花崗岩)、 610(玄武岩)、 700(頁岩) |
Krauskopf & Bird(1995) | ||
|
830(花崗岩)、 1,960(玄武岩) |
都城・久城(1975) | |||
|
2,288(塩基性~超塩基性深成岩)、 704(酸性深成岩)、 1,364(塩基性・中性火山岩)、 308(酸性火山岩)、 946(頁岩)、 344(砂岩)、 484(炭酸塩岩)、 264(蒸発岩)、 528(沖積堆積物) |
Yang,X.ほか(2013) | |||
| 堆積物 |
14.4~27.2(有機態)、 47.8~73.0(無機態) |
朝日ほか(2014) | ||
| 140~740 | Bretzほか(2006) | |||
| ~1,000 | Liほか(2003)、Sondergaard(oに/が重なる)ほか(2003) | |||
| ~2,000 | Chaoほか(2008) | |||
| 2,700~5,400(湖底) | 対馬ほか(2008) | |||
| 土壌 | 650 | 北野(1992) | ||
| 800 | 浅見(2001)、一國(1989) | |||
|
1,000、 20~50(土壌テスト) |
Bundy(2003?) | |||
| 1,000~1,500(森林土壌・水田土壌) | 井上ほか(2004) | |||
| 懸濁物 | 約5,000(河川) | 井上ほか(2004) | ||
| 19,000~44,000(河川) | 対馬ほか(2008) | |||
| 液体 | 海水 |
<0.02(Ⅰ類)、 <0.03(Ⅱ類(水産1種))、 <0.05(Ⅲ類(水産2種))、 <0.09(Ⅳ類(水産3種)) |
環境省による海域環境基準 | |
| 0.01~0.05 | 石井・柳(2004) | |||
| 0.01~0.05(湾懸濁態) | 朝日ほか(2014) | |||
| 0.01~0.07 | 伊藤ほか(2010) | |||
| 0.02~0.04 | 瀬戸内海環境情報センター(2013) | |||
| 0.04 | 大阪湾環境保全協議会(2014) | |||
| 0.05 | coral-shop(2014) | |||
| 0.06 | ホランド(1979) | |||
| 0.062 | 南川・吉岡(編)(2006) | |||
| 0.09 | Krauskopf & Bird(1995) | |||
| 河川水 | 0.006 | 西村(1991)、ホランド(1979) | ||
| 0.0066(<0.0015~0.116mg/l)(渓流水の溶存無機態) | 若松ほか(2006) | |||
| 0.023(溶存反応性リン) | Fitzgerald(2013) | |||
| 0.025 | 南川・吉岡(編)(2006) | |||
| 0.10 | Bundy(2003?) | |||
| 0.106~0.173(懸濁態) | 朝日ほか(2014) | |||
| ~0.5 | 松本ほか(2012) | |||
| 湖沼水 |
<0.005(Ⅰ類、自然環境保全)、 <0.01(Ⅱ類、水道1・2・3級、水産1種)、 <0.03(Ⅲ類、水道3級)、 <0.05(Ⅳ類、水産2種)、 <0.1(Ⅴ類、水産3種、工業用水、農業用水、環境保全) |
環境省による湖沼環境基準 | ||
| 0.001~0.004 | Bretzほか(2006) | |||
|
0.01(溶存)、 0.05(溶存+粒子状) |
Bundy(2003?) | |||
| 地下水 |
0.003~0.082(地下水と湧水:甲府盆地)、 0.089~0.212(地下水と湧水:富士山麓) |
小林・輿水(1999) | ||
| 0.04~0.12(溶存反応性リン) | Holmanほか(2008) | |||
| 0.1~10(主に0.1~3) | 井岡ほか(2009) | |||
| ~1(溶存反応性リン) | Fitzgerald(2013) | |||
| 湧出水 | ~17 | 川原谷ほか(2010) | ||
| 間隙水 | 0.005~0.07(ピエゾメーター) | Bretzほか(2006) | ||
| 0.01~0.30(土壌) | Bundy(2003?) | |||
| ~1.6(土壌) | 山口(2009) | |||
| 0.6~2.0(湖底堆積物) | 対馬ほか(2008) | |||
| ~2 | Chaoほか(2008) | |||
|
工業用水 農業用水 |
<0.1 | 環境省による湖沼環境基準 | ||
| 排水 | 16 | 環境省による一律排出基準の生活環境項目 | ||
| 生物 | 植物 | 木本類 | 120~2,000(被子植物) | 南川・吉岡(編)(2006) |
| 1,000~3,000(裸子植物) | 南川・吉岡(編)(2006) | |||
| 参照植物 | 2,000 | 南川・吉岡(編)(2006) | ||
| 植物 |
2,300(陸)、 3,500(海) |
西村(1991) | ||
| 藻類 | 2,800(海洋褐藻類) | 南川・吉岡(編)(2006) | ||
| 3,000(海洋紅藻類) | 南川・吉岡(編)(2006) | |||
| 4,000(海洋緑藻類) | 南川・吉岡(編)(2006) | |||
| 5,800 | 井上ほか(2004) | |||
| 草本野菜 | 130~10,000 | 南川・吉岡(編)(2006) | ||
| 海洋植物プランクトン | 4,000~18,000 | 南川・吉岡(編)(2006) | ||
| 動物 | 動物プランクトン | 7,500 | 南川・吉岡(編)(2006) | |
| 動物 |
4,000~18,000(海)、 17,000~44,000(陸) |
西村(1991) | ||
| 魚類 | 18,000 | 南川・吉岡(編)(2006) | ||
| 参照ヒト | 27,900 | 南川・吉岡(編)(2006) | ||
| 家畜肥やし | ~10,000 | Danielsほか(1998) | ||
| 3,000~40,000(家畜ふん堆肥) | 小柳ほか(2005) | |||
| 食品 |
3,000~7,000(植物性食品)、 3,000~12,000(動物性食品) |
(独)国立健康・栄養研究所(2014) | ||
| その他 | 化学肥料 | 56,000~66,000 | 小柳ほか(2005) | |
| 生ゴミ処理物 | 1,000~9,000 | 小柳ほか(2005) | ||
/Image683.gif) Figure 3. Concentrations of dissolved phosphorus (P), in milligrams per liter (mg/L) as P, in different hydrologic compartments at each study area relative to USEPA recommended total phosphorus criteria for each region. Numbers above each plot refer to the total number of samples analyzed. Domagalski & Johnson(2012/1)による『Phosphorus and Groundwater: Establishing Links Between Agricultural Use and Transport to Streams』から |
/Image689.gif) 伊藤ほか(2010)による『沖縄島沿岸海水中リンの存在形態別分析並びに溶存リン酸イオンと栄養塩型微量金属の濃度相関』から |
/Image684.gif) Fig.6. Spatial distributions of TP(a) and TN(b) concentrations in the coastal and entire area of the Seto Inland Sea, and averaged TP and TN loads during 1979-1999. 石井・柳(2005)による『瀬戸内海の沿岸域と全域におけるTP・TN濃度変動』から |
/Image686.gif) 図6-2 日本の湖沼のクロロフィルa濃度とT-P、T-Nとの関係(湖心部における年間平均値) |
|
/Image687.gif) |
/Image688.gif) |
|
|
|
| 環境省(1995?)による『第6章 水質環境基準(湖沼の窒素、りん)』から | |
/Image685.gif) 図7-8 わが国の内湾及び沿岸海水のN/P比
環境省(1995?)による『第7章 水質環境基準(海域の窒素、りん)』から |
||||||||||||||||||||||||
| リンを含む化学種 |
|
|
|||||
| 固体 | 天然物 | 岩石 | 鉱物(リン酸塩) | アパタイト(リン酸カルシウム)グループ | |
| 堆積物 |
鉱物(リン酸塩)、 吸蔵P(鉄酸化物など)、 吸着P(鉄酸化物など) |
アパタイトグループ | |||
| 土壌 | アパタイトグループ | ||||
| 懸濁物 | ? | ||||
| P鉱床 | 鉱物(リン酸塩) | アパタイトグループ | |||
| 人工物 | 化学肥料 | 過リン酸石灰 | リン酸二水素カルシウム(第一リン酸カルシウム)1水和物 Ca(H2PO4)2・H2O | ||
| 重過リン酸石灰 |
リン酸二水素カルシウム1水和物+リン酸二水素カルシウム Ca(H2PO4)2・H2O+Ca(H2PO4)2 |
||||
| 熔成リン肥 |
リン酸イオン(PO43-)を持つケイ酸塩アモルファス質 〔主成分はCa3(PO4)2+Ca2SiO4〕 |
||||
| 農薬 | 有機リン系 | ||||
| 洗剤 | STP(Na5P3O10)、TSPP(Na4P2O7) | ||||
| 生ゴミ処理物 | ? | ? | |||
| 汚泥 | MAP/HAP | ストルーバイト | |||
| 液体 | 天然物 | 海水 |
リン酸のイオン、 有機リン化合物 |
リン酸水素イオン(HPO42-) | |
| 河川水 | リン酸のイオン |
リン酸二水素イオン(H2PO4-)、 リン酸水素イオン(HPO42-) |
|||
| 湖沼水 | |||||
| 地下水 | |||||
| 湧出水 | |||||
| 間隙水 | |||||
| 人工物 |
工業用水 農業用水 |
リン酸のイオン | |||
| 排水 | |||||
| 生物 | 天然物 | 植物 | (全体) |
ヌクレオシド(塩基+糖)+リン酸=ヌクレオチド、 ヌクレオシド二リン酸⇒ADP、 ヌクレオシド三リン酸⇒ATP |
ATP(アデノシン三リン酸、 C10H16N5O13P3)、 ADP(アデノシン二リン酸、 C10H15N5O10P2)、 核酸(DNA、RNA)、 フィチン酸(phytic acid、 C6H18O24P6)塩 |
| 動物 | (全体) |
ヌクレオシド(塩基+糖)+リン酸=ヌクレオチド、 ヌクレオシド二リン酸⇒ADP、 ヌクレオシド三リン酸⇒ATP |
ATP(アデノシン三リン酸、 C10H16N5O13P3)、 ADP(アデノシン二リン酸、 C10H15N5O10P2)、 核酸(DNA、RNA) |
||
| (骨や歯など) | リン酸カルシウム(哺乳類の骨・歯、シャミセンガイの殻) | ||||
| 人工物 | 有機肥料 | 家畜肥やし | |||
| 食品 | |||||
| (注) 動物の殻などは炭酸カルシウム(貝殻、鳥類の卵の殻、サンゴの骨格、耳石)からなる。 | |||||
燐酸塩鉱物はこちらも参照。リンの鉱物としては燐灰石(apatite)グループが主要。他に、モナザイト(モナズ石、monazite)グループ、藍鉄鉱(vivianite)グループなど。
|
|
||||
|
|
|
|
|
|
| ゼノタイム | xenotime-(Y) | YPO4 | 正方 | Barthelmy氏による、Ralph氏による。 |
| モナザイトグループ(monazite group) | Barthelmy氏による、Ralph氏による。 | |||
| モナザイト(-Ce)〔モナズ石〕 | monazite-(Ce) | CePO4/(Ce,La,Nd,Th)PO4 | 単斜 | Barthelmy氏による、Ralph氏による。 |
| モナザイト(-La) | monazite-(La) | LaPO4/(La,Ce,Nd)PO4 | 単斜 | Barthelmy氏による、Ralph氏による。 |
| モナザイト(-Nd) | monazite-(Nd) | NdPO4/(Nd,La,Ce)PO4 | 単斜 | Barthelmy氏による、Ralph氏による。 |
| 燐灰石グループ(apatite group) | Barthelmy氏による、Ralph氏による。 | |||
| 燐灰石(-F)(フッ素燐灰石) | fluorapatite | Ca5(PO4)3F | 六方 | Barthelmy氏による、Ralph氏による。 |
| 燐灰石(-Cl) | chlorapatite | Ca5(PO4)3Cl | 単斜 | Barthelmy氏による、Ralph氏による。 |
| 燐灰石(-OH) | hydroxylapatite(hydroxyapatite) | Ca5(PO4)3(OH) | 六方 | Barthelmy氏による、Ralph氏による。 |
| 緑鉛鉱 | pyromorphite | Pb5(PO4)3Cl | 六方 | Barthelmy氏による、Ralph氏による。 |
| アンブルゴ石グループ(amblygonite group) | ||||
| アンブリゴ石 | amblygonite | (Li,Na)Al(PO4)(F,OH) | 三斜 | Barthelmy氏による、Ralph氏による。 |
| 銀星石 | wavellite | Al3(PO4)2(OH,F)3・5H2O | 斜方 | Barthelmy氏による、Ralph氏による。 |
| バリッシャイトグループ(variscite group) | ||||
| バリッシャイト | variscite | Al(PO4)・2H2O | 斜方 | Barthelmy氏による、Ralph氏による。 |
| ストレンガイト | strengite | Fe3+(PO4)・2H2O | 斜方 | Barthelmy氏による、Ralph氏による。 |
| ラブドフェーングループ(rhabdophane group) | Barthelmy氏による(La、Nd)、Ralph氏による。 | |||
| ラブドフェーン | rhabdophane-(Ce) | (Ce,La)PO4・H2O | 六方 | Barthelmy氏による、Ralph氏による。 |
| 人形石 | ningyoite | (U,Ca,Ce)2(PO4)2・1-2H2O |
斜方・ 擬六方 |
Barthelmy氏による、Ralph氏による。 |
| 藍鉄鉱グループ(vivianite group) | ||||
| 藍鉄鉱 | vivianite | Fe2+3(PO4)2・8H2O | 単斜 | Barthelmy氏による、Ralph氏による。 |
| トルコ石グループ(turquoise group) | ||||
| トルコ石 | turquoise |
Cu(Al,Fe)6(OH)8(PO4)4・5H2O/ Cu2+Al6(PO4)4(OH)8・4H2O |
三斜 | Barthelmy氏による、Ralph氏による。 |
| 燐灰ウラン石グループ(autunite group) | Barthelmy氏による、Ralph氏による。 | |||
| 燐灰ウラン石 | autunite | Ca(UO2)2(PO4)2・10-12H2O | 正方 | Barthelmy氏による、Ralph氏による。 |
| 燐銅ウラン石 | torbernite | Cu(UO2)2(PO4)2・8-12H2O | 正方 | Barthelmy氏による、Ralph氏による。 |
| Mandarino,J.A.(1999)による『Fleischer's Glossary of Mineral Species 1999』などから。リンクはウィキペディア、『鉱物の一覧#リン酸塩鉱物』も参照。Barthelmy氏によるMineralogy Database、およびRalph氏によるmindat.orgへのリンク。 | ||||
|
|
||||
| monetite | Ca(PO3OH)=Ca(HPO4) | 三斜 | Barthelmy氏による、Ralph氏による。 | |
| brushite | CaHPO4・2H2O | 単斜 | Barthelmy氏による、Ralph氏による。 | |
| ストルーバイトグループ | Ralph氏。 | |||
| ストルーバイト | struvite | (NH4)MgPO4・6(H2O) | 斜方 |
Barthelmy氏による、Ralph氏による。 『MAP/HAP』を参照。 |
| struvite-(K) | KMg(PO4)・6H2O | 斜方 | Barthelmy氏による、Ralph氏による。 | |
| hazenite | KNaMg2(PO4)2・14H2O | 斜方 | Barthelmy氏による、Ralph氏による。 | |
| リンクはウィキペディア。Barthelmy氏によるMineralogy Database、およびRalph氏によるmindat.orgへのリンク。 | ||||
/Image2451.gif) Figure 7. The P mass balance of the Black Sea with values in x 107 mol P/yr. The fluxes related to the Sea of Marmara are excluded as their effect is minimal. The Black Sea is divided into two areas: the shelf with generally oxic bottom waters (<200 m water depth) and the basin with anoxic bottom waters (>200 m water depth). The relative P fractions are based on values below 5 cm depth to limit the effect of short-term burial on total P burial. Based on this balance, 11×107 mol P is added to the water column on a yearly basis. doi:10.1371/journal.pone.0101139.g007 Dijkstra et al.(2014/7)による『Are Iron-Phosphate Minerals a Sink for Phosphorus in Anoxic Black Sea Sediments?』から |
|
|||||||||||||||||||||||||||||||||||||||||||||||||||||||||||||||||||||||||||||||||||||||||||||||||||||||||||||||||||||||||||||||||||||||||||||||||||||||||||||||||||||||||||||||||||||||||||||||||||||||||||||||||||||||||||||||||||||||||||||||||
Wikipedia(HP/2014/5)による『Phosphorus』から |
/Image2452.gif) Fig.2.16 Kafkafi(HP/2011/8)による『Topics in fertilization and plant nutrition - 2nd meeting Seven lectures on selected topics』から |
Hou et al.(2009)による〔『Phosphorus speciation and availability in intertidal sediments of the Yangtze Estuary, China』〕【見る→】 |
/Image919.gif) Figure 1.3 The effect of pH on the form of orthophosphate present in solution. Menzies(2009)による『The science of phosphorus nutrition: Forms in the soil, plant uptake, and plant response』から |
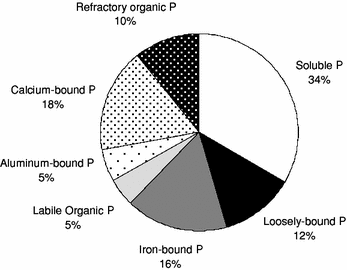
 Fig. 9 Contribution of biologically labile (solid shades) and refractory (dotted shades) phosphorus (P) fractions to the annual average (i.e., between 2004 and 2006 for RM 39.4 and RM 3.5 combined) total P load of the lower Minnesota River James,W.F. and Larson,C.E.(2008)によるPhosphorus dynamics and loading in the turbid Minnesota River (USA): controls and recycling potentialから |
Lukkari et al.(2008)による〔『Vertical distribution and chemical character of sediment phosphorus in two shallow estuaries in the Baltic Sea』〕【見る→】 |
|||||||||||||||||||||
Schena et al.(2005)による〔『Phosphorus burial as a function of paleoproductivity and redox conditions in Arabian Sea sediments』〕【見る→】 |
|||||||||||||||||||||||||||||||||||||||||||||||||
Baturin(2003)による〔『Phosphorus cycle in the ocean』〕【見る→】 |
|||||||||||||||||||||||||||||||||||||||||||||||||||||
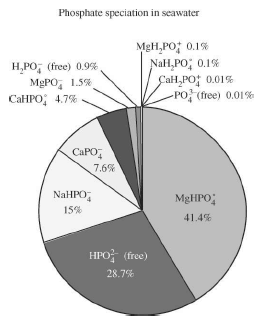
 図14 20℃で34.8パーミルでpH 8の海水中の無機リン酸塩の計算による化学種割合(Atlas et al.,1976から) |
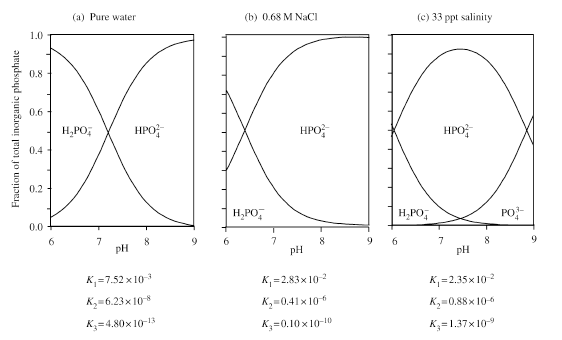
 Figure 13 Distribution of phosphoric acid species as a function of pH, and dissociation constants, in (a) pure water; (b) 0.68 M NaCl; and (c) artificial seawater of salinity 33 ppt (after Kester and Pytkowicz, 1967). 図13 (a)純水と(b)0.68モルNaCl溶液と(c)塩分33パーミルの人工海水における、pHと解離定数の関数としてのリン酸塩化学種の分布(Kester and Pytkowiez,1967から) |
||||||||||||||||||||||||||||||||||||||||||||||||||||||||||||||||||||||||||||||||||||||||||||||||||||||||||||||||||||||||||||||||||||||||||||||||
|
|||||||||||||||||||||||||||||||||||||||||||||||||||||||||||||||||||||||||||||||||||||||||||||||||||||||||||||||||||||||||||||||||||||||||||||||||
| Ruttenberg(2003)による『8.13 The global phosphate cycle』から | |||||||||||||||||||||||||||||||||||||||||||||||||||||||||||||||||||||||||||||||||||||||||||||||||||||||||||||||||||||||||||||||||||||||||||||||||
| MAP/HAP |
廃棄物(下水など)からのリン回収法に関連して用いられる用語である:
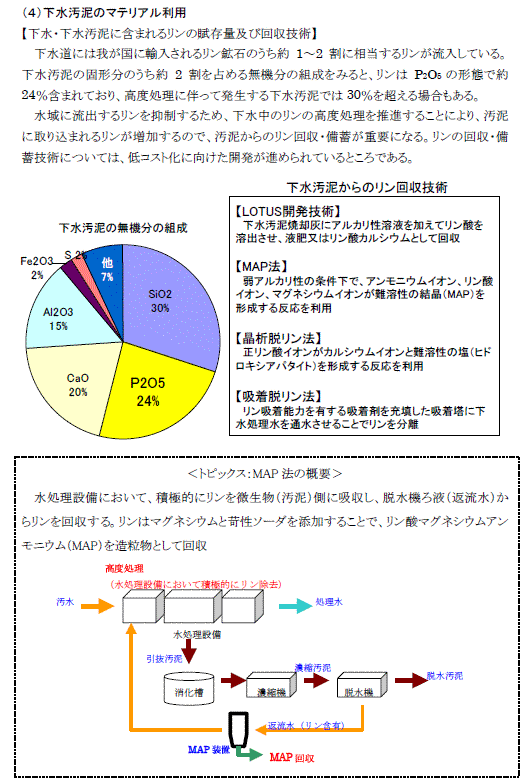
MAP(Magnesium Ammonium Phosphate、リン酸マグネシウムアンモニウム)は、天然産のものは鉱物名struvite(ストルーバイト:※鉱物名は正式にはストルーバイトであるが、下水汚泥関連の分野ではストラバイトと呼び習わされている)と呼ばれ、Mg(NH4)(PO4)・6H2Oという化学式を持つ。この物質は、下水処理施設の配管などを詰まらせて、人工的に生成していることが知られている。下水処理水中から人為的にこの物質を沈殿させて、リンを回収し、肥料等として利用する目的で研究が行われている。この方法はMAP法と総称されている。
HAP(Hydroxylapatite、Hydroxyapatite、ヒドロキシアパタイト)は、天然には微量ではあるが広範に産出する鉱物(一般に、燐灰石あるいはアパタイトと呼ばれるが、これはグループ名である)である。化学組成はCa5(PO4)3(OH)〔またはCa10(PO4)6(OH)2〕である。廃棄物に含まれるリンをカルシウム・リン酸塩の形で分離する方法はHAP法と総称されている。
 資源のみち委員会による資源のみちの実現に向けて報告書(案)から |
| 生体中のリン |
/Image2503.gif) |
|
/Image2504.gif) |
/Image2505.gif) |
/Image2506.gif) |
|
| 堀口(1991)による『生体C-P化合物30年』から | |