Baturin,G.N.(2003): Phosphorus cycle
in the ocean. Lithology and Mineral Resources, 38(2),
101-119.
『海洋におけるリン循環』
『Abstract
The behavior of phosphorus is considered at major stages of the
sedimentary cycle beginning with supply sources for its delivery
into the ocean to precipitation and its sedimentation, localization
and subsequent diagenetic redistribution in bottom sediments.
River runoff represents the main phosphorus source in the ocean.
It delivers annually about 1.5 Mt of dissolved phosphorus and
more than 20 Mt of suspended phosphorus into the ocean. Up to
80% of the suspended phosphorus incorporated in the lithogenic
material precipitates within submarine continental margins. Phosphorus
dissolved in seawater repeatedly participates in biogeochemical
processes owing to its assimilation by phytoplankton that annually
consumes from 1.5 to 2.5 Gt of phosphorus. Dissolved phosphorus
is incorporated in organic remains and precipitates from seawater
by a biogenic mechanism, too. Only a part of phosphorus settled
onto the bottom is buried in sediments. Due to reducing diagenetic
processes, up to 30-40% of the primarily precipitated phosphorus
diffuses from the upper layer of sediments into bottom water.
Diffusion flux into the ocean significantly exceeds the supply
of dissolved phosphorus from river runoff. The absolute mass phosphorus
dispersed in sediments is several orders of magnitude greater
than the mass concentrated in phosphorite deposits. However, the
majority of phosphorite formation epochs coincide with the intensification
of total phosphorus accumulation in marine sediments in conditions
of humid climate, intense chemical weathering of rocks on continents,
and considerable expansion of the oceanic shelf area.』
(Introduction)
Phosphorus delivery into the world ocean
Phosphorus in oceanic water, suspended matter, and biota
Phosphorus precipitation from oceanic waters
Phosphorus in marine and oceanic sediments
Phosphorus in pore water
Phosphorus flux from sediments into bottom water
Phosphorus residence time in oceanic waters and its budget
Phosphorus cycle, climate, and phosphorites
Conclusions
Acknowledgements
References
Table 1. Total present-day phosphorus supply into the World
Ocean (Savenko, 2001)
|
Source |
Supply, Mt/yr |
|
River runoff |
24.2 |
|
Glacier discharge and glacier erosion |
1.4 |
|
Groundwater discharge |
0.1 |
|
Coastal abrasion |
0.4 |
|
Atmospheric precipitation |
1.7 |
|
Volcanism of active continental margins |
3.3 |
|
Total |
31.1 |
Table 2. Forms of present-day and preanthropogenic phosphorus
supply into the World Ocean, Mt/yr (Compton et al., 2000)
|
Phosphorus sources and species |
Preanthropogenic supply |
Present-day supply |
|
1. River runoff |
|
|
|
Dissolved P: |
|
|
|
inorganic |
0.3-0.5 |
0.8-1.4 |
|
organic |
0.2 (maximum) |
0.2 (average) |
|
Suspended P: |
|
|
|
inorganic |
0.9 (maximum) |
0.9 (average) |
|
organic |
1.5-3.0 |
1.3-7.4 |
|
detrital |
6.9-12.2 |
14.5-20.5 |
|
2. Eolian |
1.0 (including 20% of reactive P) |
1.05 (including 20% of reactive P) |
|
Total |
10.8-17.8 |
18.7-31.4 |
|
Reactive |
3.1-4.8 |
3.4-10.1 |

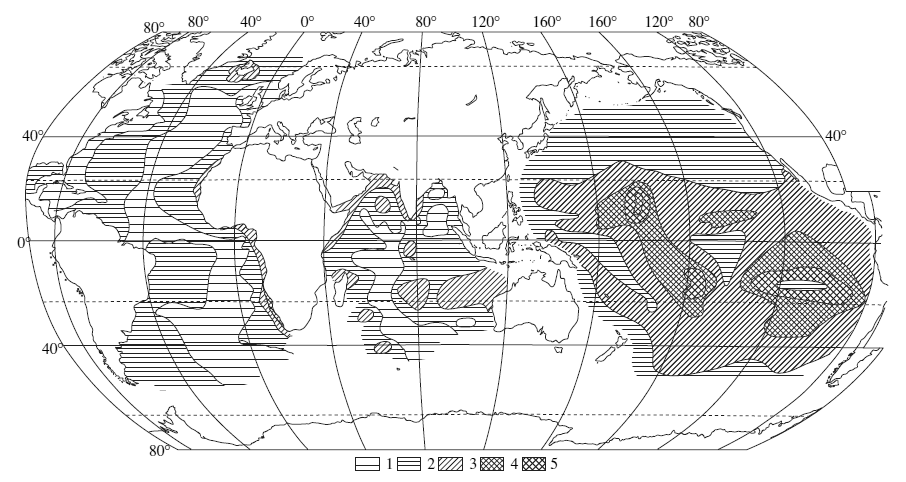
Fig. 1. Phosphorus distribution (%) in the upper sediment layer
of the World Ocean, based on data from (Baturin, 1988; Baturin
and Sevast’yanova, 1986; Baturin et al., 1995; Emel’yanov and
Romankevich, 1979). (1) <0.05%; (2) 0.05-0.1%; (3) 0.1-0.2%;
(4) 0.2-0.3%; (5) >0.3% (for the Indian ocean: (2) 0.05-0.08%;
(3) >0.08%)
Baturin(2003)によるPhosphorus
cycle in the oceanから |
Table 6. Phosphorus species in sediments, % of total P content
(Berner et al., 1993)
|
Species |
Region |
|
Mississippi delta |
Amazon delta |
Long Island Sound |
Equatorial Atlantic |
Black Sea |
|
Organic P |
29 |
26 |
20 |
27 |
43 |
|
P bound with iron hydroxides |
23 |
46* |
0 |
20 |
19 |
|
P bound with carbonates |
28 |
22 |
29 |
49 |
20 |
|
Detrital P |
15 |
6 |
47 |
1 |
11 |
|
Absorbed P |
5 |
- |
4 |
2 |
7 |
|
Total P, % |
0.067 |
0.054 |
0.059 |
0.078 |
0.061 |
|
Number of samples |
18 |
12 |
6 |
6 |
13 |
ホームへ
