 〔UNEPの『Maps & Graphics』の『Vital Water Graphics』の『FRESHWATER RESOURCES』から〕 |
|
|
最終更新日:2017年2月20日
| 全般 | 海 | 陸 | その他 |
|
リンク⇒こちら| 水の総量| 水収支/水循環| |
海洋循環| 海水| 海底| |
陸水| 河川| 地下水| 雪氷 |
エルニーニョ| 水文学| 地表の高度| 海水準| |
| ここでは、地球(Earth)を地圏(Geosphere)・水圏(Hydrosphere)・気圏(Atmosphere)・生物圏(Biosphere)の4つに分けている。水圏は主に海洋の海水(Seawater)と、陸上の様々な水である陸水〔Inland Waters:氷河(Glacier)・地下水(Groundwater)・湖沼水(Lake Water)・河川水(River Water)・水蒸気(Vapor)など〕から構成される。 |
| 全般 |
|
環境と災害 | 地下 | その他 |
|
| 水の総量 |
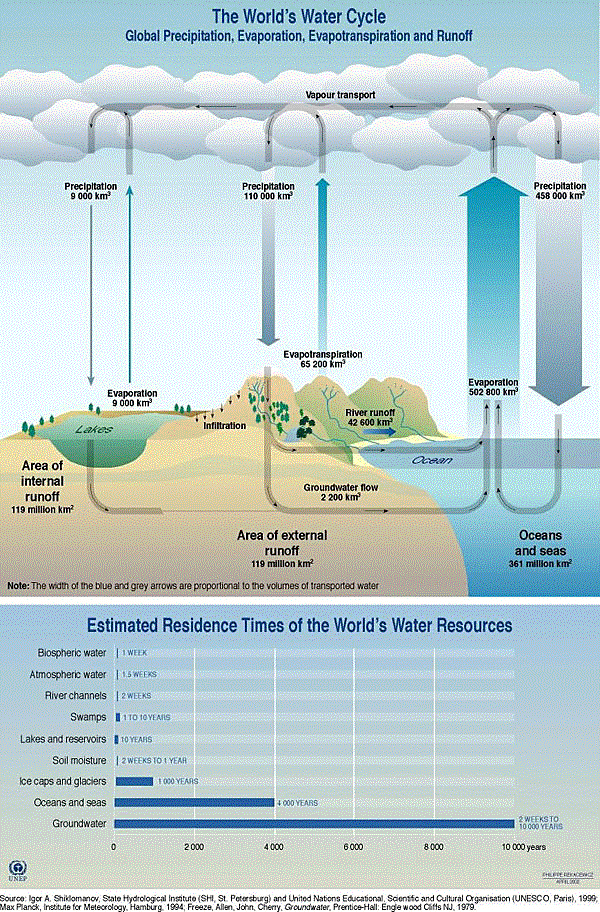
※地表付近に存在する水の約97%は海水(Seawater)である。残りは陸に存在する陸水(Inland Waters、Terrestrial Waters)であるが、約2%は氷河(Glacier)である。存在量の他に循環する速度〔滞留時間(Residence Time)として表わすことが多い〕も重要である。
地表において水は蒸発し、水蒸気(Water Vapor)として大気中を上空へ移動する。水蒸気は雲(Cloud)を形成し雨(Rain)や雪(Snow)として地表へ戻る。その循環の速度は、過程によって大きく異なる。
 〔UNEPの『Maps & Graphics』の『Vital Water Graphics』の『FRESHWATER RESOURCES』から〕 |
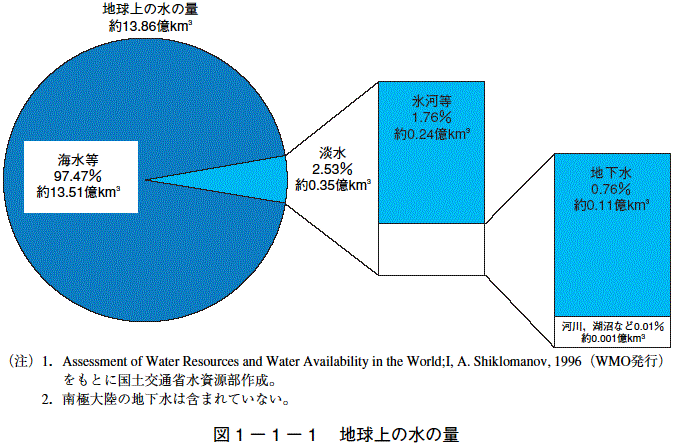 〔国土交通省の『土地・水資源関係』の『水資源部』の中の『日本の水資源』の『平成16年版 日本の水資源』の『第Ⅱ編第1章本文』から〕 |
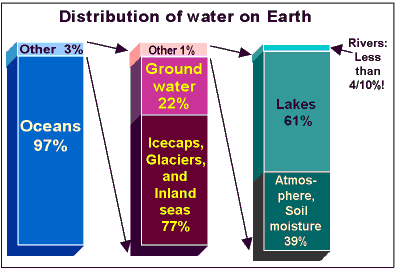
Source: Nace, U.S. Geological Survey, 1967 〔米国地質調査所によるWater Science for Schoolsの『Earth's Water』の『Earth's water distribution』から〕 地球上の水の分布。 |
| 水収支/水循環 |
/Image778.gif) 図1 地球上の水文循環量(1,000km3/year)と貯留量(1,000km3).自然の循環と人工的なを様々なデータソースから統合した.大きな矢印は陸上と海洋上における年総降水量と年総蒸発散量(1,000km3/year)を示し、陸上の総降水量や総蒸発散量には小さな矢印で主要な土地利用ごとに示した年降水量や年蒸発散量を含む.( )は主要な土地利用の陸上の総面積(百万km2)を示す.河川流出量の約10%と推定されている地下水から海洋への直接流出量は河川流出量に含まれている.(初出:Oki and Kanae, 2003). 沖・鼎(2007)による『地球表層の水循環・水収支と世界の淡水資源の現状および今世紀の展望』から |
| 海洋循環 |
※地表の温度は、赤道地域で高くて極地域で低いが、その温度差をなくすように大気と海水は動く。大気の場合は大気の大循環と呼ばれる循環となるが、海水の場合は表層での海流(Ocean Current)とよばれる循環ならびに深層も含めた海洋の大循環〔熱塩循環、Thermohaline Circulation:『海洋ベルトコンベア(Ocean Conveyor Belt、Great Ocean Conveyor、Global Conveyor Belt)』とも呼ばれる〕として循環する。海流はとくに大気(風、Wind)の影響を強く受ける。
/Image669.gif) 海洋表層の循環の模式図 (北半球冬季における循環を模式化) 気象庁(HP/2011/6)による『海洋の循環』から |
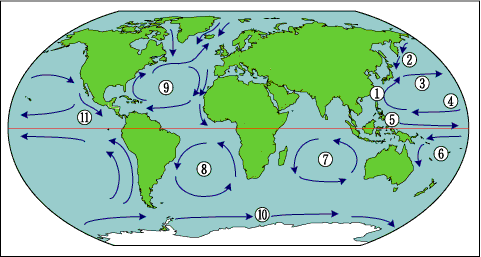 ①黒潮/②親潮/③北太平洋海流/④北赤道海流/⑤赤道反流/⑥南赤道海流/⑦南インド海流/⑧南大西洋海流/⑨北大西洋海流/⑩南極海流/⑪カリフォルニア海流 |
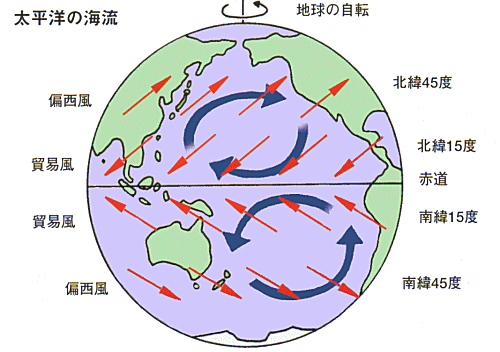 〔(財)日本海事広報協会による海と船なるほど豆事典の『海の自然のなるほど』の『海流はどうしておきるの』から〕 |
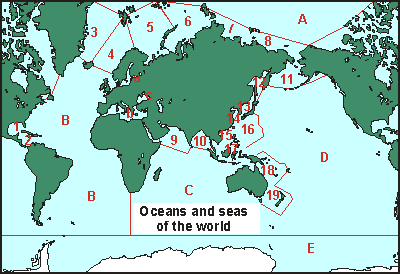 |
Oceans Enclosed or almost |
Large coastal seas 1 Gulf of Mexico 2 Caribbean Sea 3 Greenland Sea 4 Norwegian Sea 5 Barents Sea 6 Kara Sea 7 Laptev Sea 8 East Siberian Sea 9 Arabian Sea 10 Bay of Bengal 11 Bering Sea 12 Sea of Okhotsk 13 Sea of Japan 14 East China Sea 15 South China Sea 16 Philippine Sea 17 Indonesian Archipelago 18 Coral Sea 19 Tasman Sea 20 North Sea |
| 〔Seafriends Marine Conservation and Education Centreによるseafriendsの『oceanography』の中の『Oceanography: Oceans』から〕 | ||
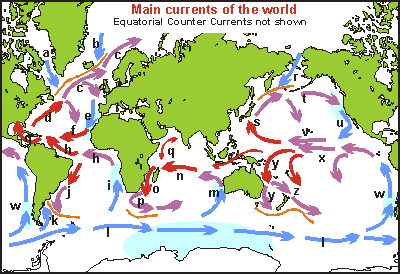 |
a Labrador Current b East Greenland C. c North Atlantic Drift d Gulf Stream e Canary C. f North Equatorial C. g Caribbean C. h South Equatorial C. i Benguela C. j Brazil C. k Falkland C. l West Wind Drift m West Australian C. |
n South Equatorial C. o Mozambique C. p Agulhas C. q Monsoon Drift r Kamchatka C./Oya Shio s Kuro Shio C. t North Pacific Drift u California C. v North Equatorial C. w Peru/ Humboldt C. x South Equatorial C. y East Australia C. z East Auckland C. |
| 〔Seafriends Marine Conservation and Education Centreによるseafriendsの『oceanography』の中の『Oceanography - currents』から〕 | ||
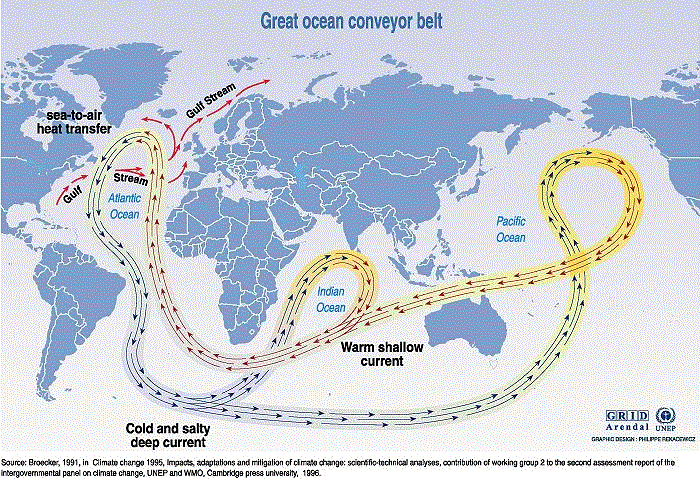 〔UNEPの『Maps & Graphics』の『Vital Climate Graphics』の『Potential impacts of climate change』から〕 |
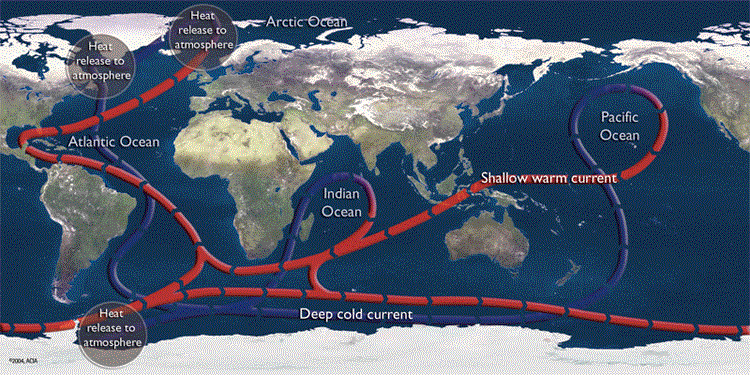 Figure 8q-2: The following illustration describes the flow pattern of the major subsurface ocean currents. Near surface warm currents are drawn in red. Blue depicts the deep cold currents. Note how this system is continuously moving water from the surface to deep within the oceans and back to the top of the ocean. (Source: Arctic Climate Impact Assessment -ACIA). 〔Okanagan University CollegeのDepartment of GeographyのMichael Pidwirny氏によるPhysicalGeography.netの『FUNDAMENTALS OF PHYSICAL GEOGRAPHY』の『CHAPTER 8: Introduction to the Hydrosphere』の中の『(q). Surface and Subsurface Ocean Currents』から〕 |
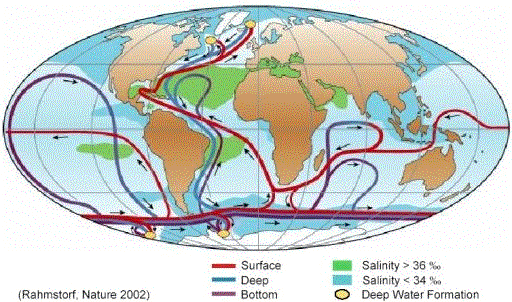 Figure 1. Schematic representation of the global thermohaline circulation.Surface currents are shown in red, deep waters in light blue and bottom waters in dark blue. The main deep water formation sites are shown in orange. (After [1], modified by S.R.) [1] Broecker, W.S., The great ocean conveyor. Oceanography, 1991. 4(2): p. 79-89. 〔Potsdam Institute for Climate Impact ResearchのStefan Rahmstorf氏による『The Thermohaline Ocean Circulation A Brief Fact Sheet』から〕 |
| 海水 |
※海水(Seawater)に含まれる塩分(Salinity)は約3%〔=3‰(パーミル、千分率、Per Mil、Per Mille、Permil、Per Mill、Promille)〕強であり、比較的均質である。表層海水の水温は季節と緯度の違いに応じて変動が大きいが、深層海水では2℃程度の一定した水温を示す。
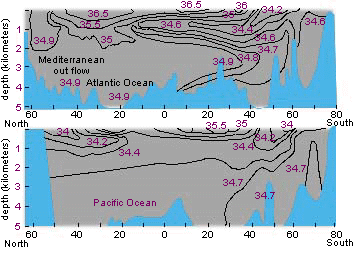 Figure 1. The salinities of Earth's Oceans measured in ppm |
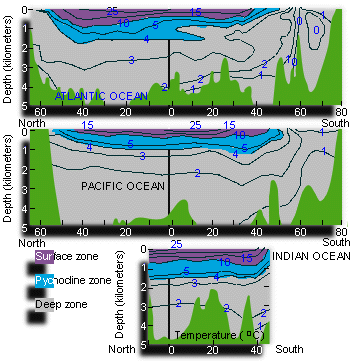 Figure 2: Thermal structure of Earth's Oceans |
|
〔The University of Michigan's Global Change CurriculumのIntroduction to Global Changeの『Global Change 1』の中の『The Blue Planet: Salinity, Circulation, and the Conveyor Belt』から〕 平均塩分は35‰で、表面付近を除けば変動は少ない。 |
|
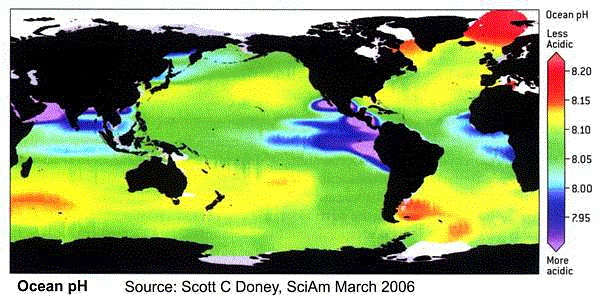 This world map of ocean acidity shows that ocean pH varies from about 7.90 to 8.20 but along the coast one may find much larger variations from 7.3 inside deep estuaries to 8.6 in productive coastal plankton blooms and 9.5 in tide pools. The map shows that pH is lowest in the most productive regions where upwellings occur. It is thought that the average acidity of the oceans decreased from 8.25 to 8.14 since the advent of fossil fuel (Jacobson M Z, 2005). 〔Anthoni,J.F.氏によるThe chemical composition of seawaterから〕 海水(Seawater)のpH〔水素イオン指数、水素イオン濃度指数、ピーエイチ、ピーエッチ、ペーハー(ドイツ語読み)、pH〕は、7.5~8.4程度の中性~弱アルカリ性(塩基、Base)である。 |
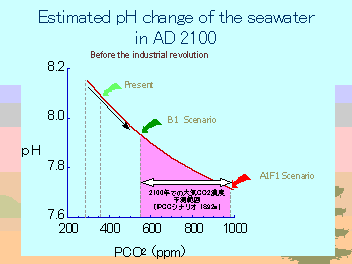
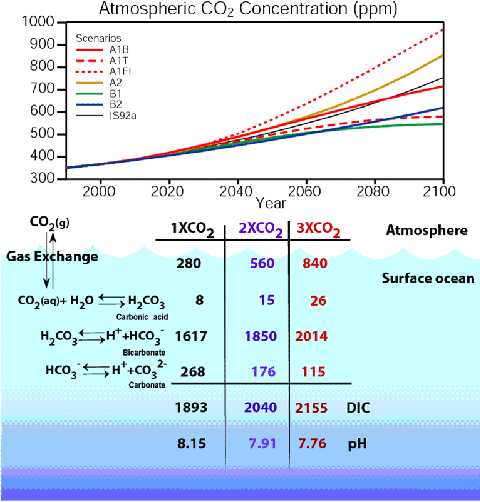 Summary of surface ocean carbon chemistry with rising atmospheric CO2 levels Air-sea gas exchange is a physico-chemical process, primarily controlled by the air-sea difference in gas concentrations and the exchange coefficient, which determines how quickly a molecule of gas can move across the ocean-atmosphere boundary. It takes about one year to equilibrate CO2 in the surface ocean with atmospheric CO2, so it is not unusual to observe large air-sea differences in CO2 concentrations. Most of the differences are caused by variability in the oceans due to biology and ocean circulation. The oceans contain a very large reservoir of carbon that can be exchanged with the atmosphere because the CO2 reacts with water to form carbonic acid and its dissociation products. As atmospheric CO2 increases in the future, the interaction with the surface ocean will change the chemistry of the seawater. The total dissolved inorganic carbon (DIC) content of the waters will increase. Because CO2 is an acid gas, the carbonate ion (CO32-) concentration and pH of the surface waters will decrease. The physiological effects of these changes on ocean biology are not fully understood, but studies have suggested that these changes may decrease calcification rates in coccoliths, corals, and coralline algae. 〔NOAAのPMEL CO2 Programから〕 現在の海水は pH 8.15 程度であるが、大気中二酸化炭素濃度が2倍になれば pH 7.91 に、3倍になれば pH 7.76 になると予想される。 |
 〔UNESCOのAn International Science Symposium(10-12 MAY 2004)でのYoshihisa Shirayama氏による『Biological impacts on marine organisms in a high-CO2 world (3 MB ppt)』から〕 |
 |
 |
 |
 |
 |
 |
 |
|
|
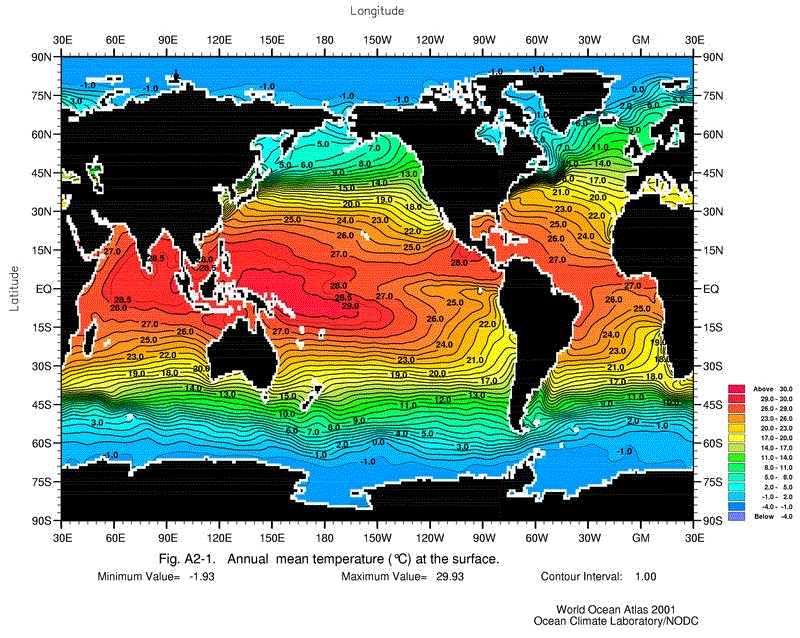
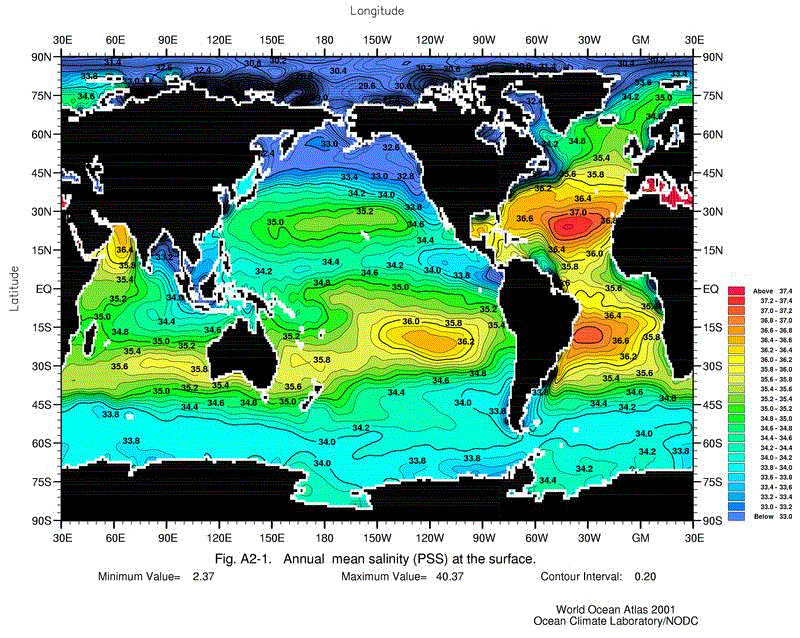
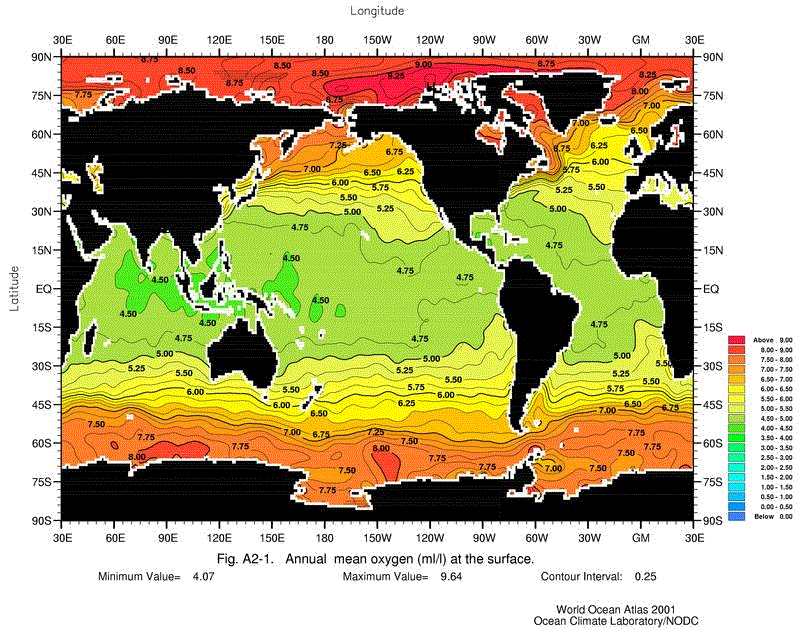
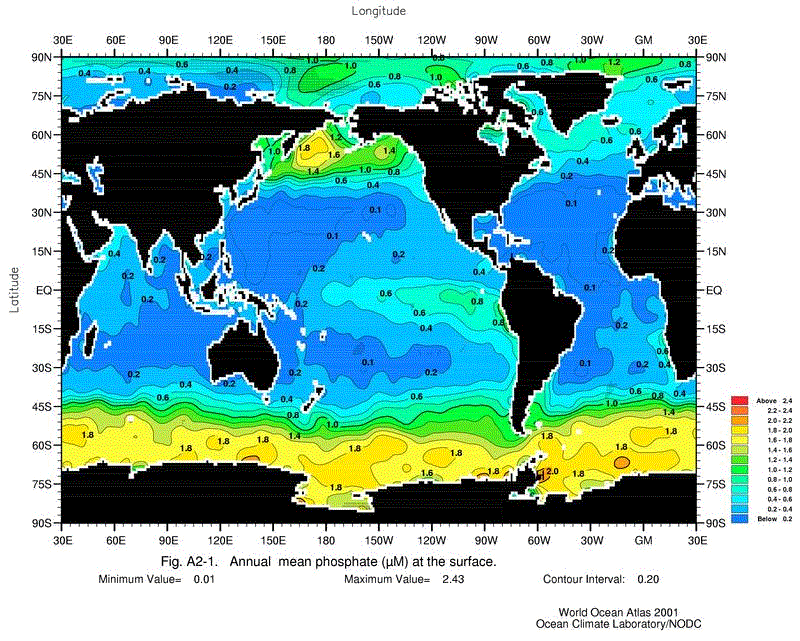
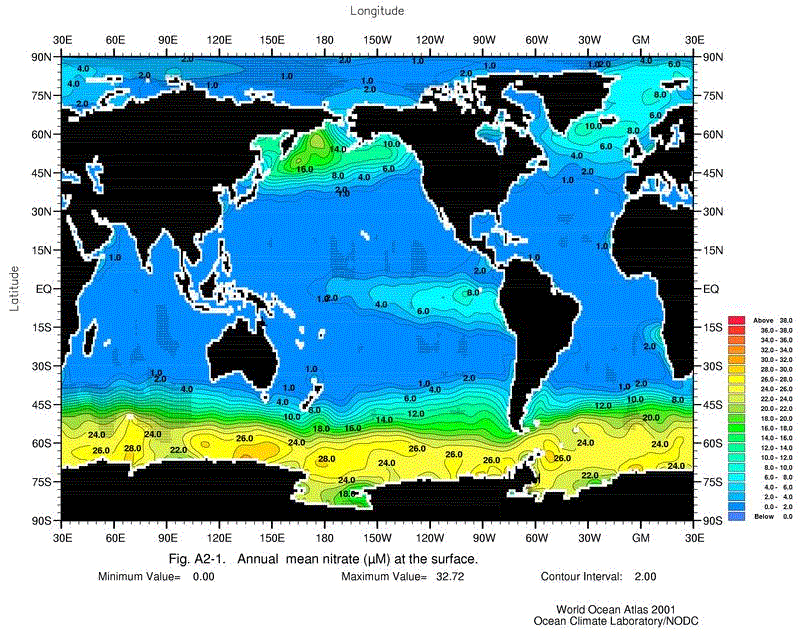
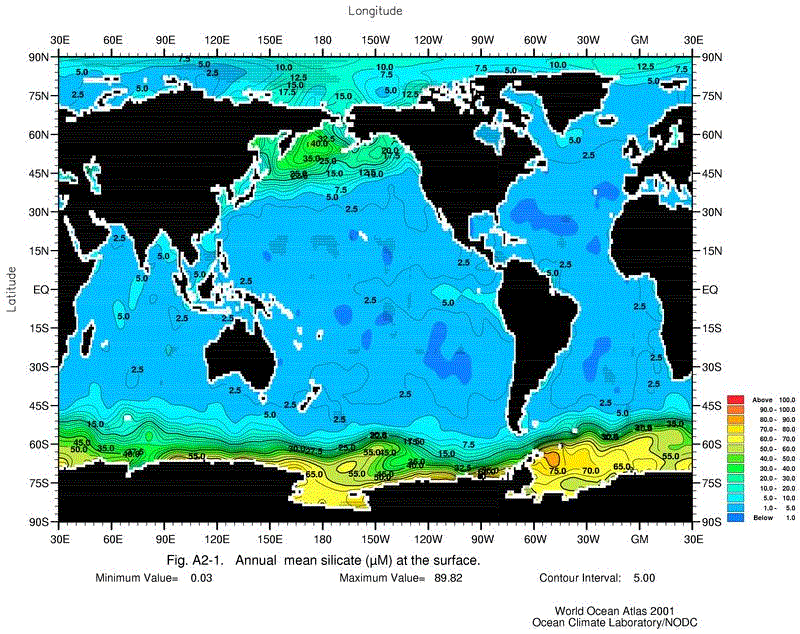
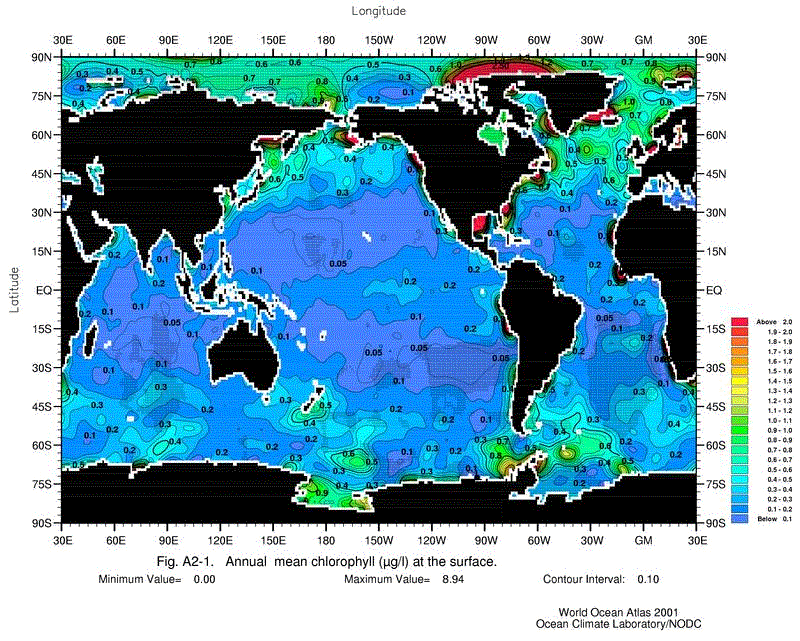
〔NODCの『OCL』の『OCL Products』の中の『World Ocean Atlas 2001 Figures (WOA01F) 』から〕 上から、表面の年間平均温度(℃)・塩分(‰)/酸素濃度(ml/l)・リン(リン酸塩)濃度(μM)/・窒素(硝酸塩)濃度(μM)・ケイ素(珪酸塩)濃度(μM)/クロロフィル濃度(μg/l)。 |
|
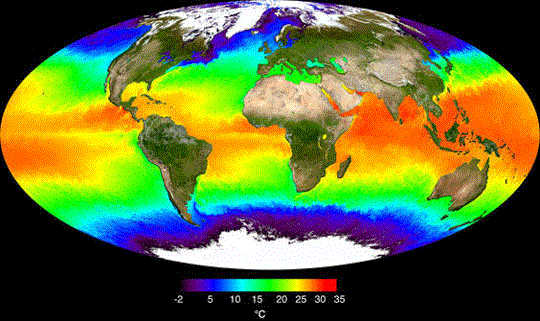 〔NASAによるVisible Earthの『Oceans』の中から〕 地表温度。2001年5月のデータ。 |
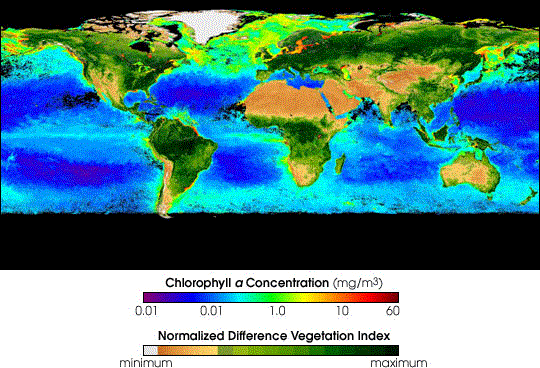 〔NASAによるVisible Earthの『Biosphere』の中から〕 クロロフィル(葉緑素)aの濃度分布。 |
| 海底 |
/Image1376.gif) Fig. 8. Generalised, schematic 3D diagram contrasting the geomorphic attributes characteristic of submarine canyons occurring on passive and active continental margin types. The mean values with standard deviations listed are from Table 1, with values that are significantly different between active and passive margins (at 95% confidence intervals) highlighted in yellow. Harris and Whiteway(2011)による『Global distribution of large submarine canyons: Geomorphic differences between active and passive continental margins』から |
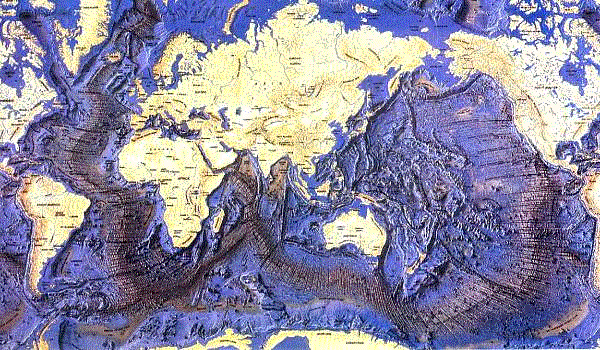 A three-dimensional map of the oceans 〔Seafriends Marine Conservation and Education Centreによるseafriendsの『oceanography』の中の『Oceanography: Oceans』から〕 海水を取り去った海底(Seabed、Seafloor、Sea Floor、Ocean Floor)の地形である。このような海底地形の成因はプレートテクトニクスによって説明されている。 |
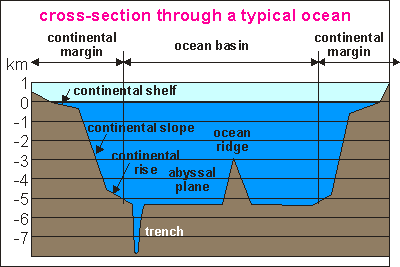 〔Seafriends Marine Conservation and Education Centreによるseafriendsの『oceanography』の中の『Oceanography: Oceans』から〕 大陸側から大陸縁辺〔Continental Margin:大陸棚(Continental Shelf)、大陸斜面(Continental Slope)、コンチネンタルライズ(Continental Rise)〕、海溝(Oceanic Trench)、深海底(Abyssal Plane)、海嶺(中央海嶺、Mid-Ocean Ridge、Mid-Oceanic Ridge)。 |
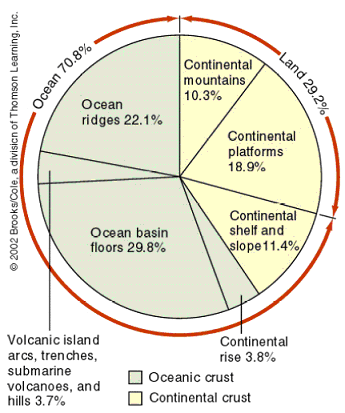 〔BIOS 429/529 Marine Biology Spring 2006 Ohio University, Athensの『Ocean provinces & Properties of seawater』から〕 海:Ocean basin floors=海盆底(深海底);Ocean ridges=海嶺;Continental shelf and slope=大陸棚と大陸斜面/陸:Continental platforms=大陸プラットフォーム(平地);Continental mountains=大陸山地。 |
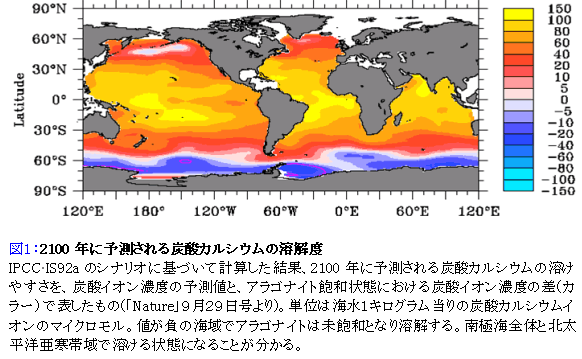 〔(独)海洋研究開発機構の地球環境フロンティア研究センターの中の『二酸化炭素濃度上昇がもたらす海洋酸性化による海洋の生物に迫る危険』から〕 ⇒Movie of this surface saturation state (with respect to aragonite) during the 21st century 海洋における炭酸塩(Carbonate)鉱物〔主に炭酸カルシウム(Calcium carbonate)〕の安定性については、炭酸塩補償深度(Carbonate compensation depth、CCD)と呼ばれる深さより以深では溶解することが知られており、その深度は炭酸塩鉱物を含む生物組織の違いだけでなく、温度・圧力・イオン濃度〔反応に関係するカルシウム(Calcium)イオンと炭酸水素イオン(重炭酸イオン、炭酸水素塩、重炭酸塩、Bicarbonate、Hydrogencarbonate)など〕にも影響される。海水が酸性化すると、CCDはより浅くなり、さらに全般的に炭酸カルシウムは溶解しやすくなることが予想される。 |
| 陸水 |
| 河川 |
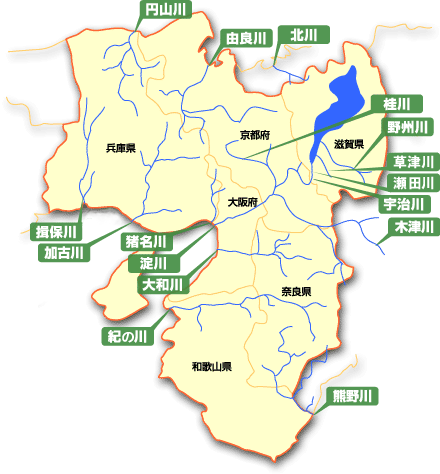
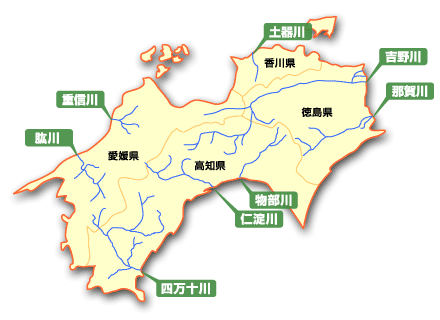
世界の大河川(River)の流域は広大である。このような河川の河口部(Estuary)では膨大な量の堆積物(Sediment)が集積している。
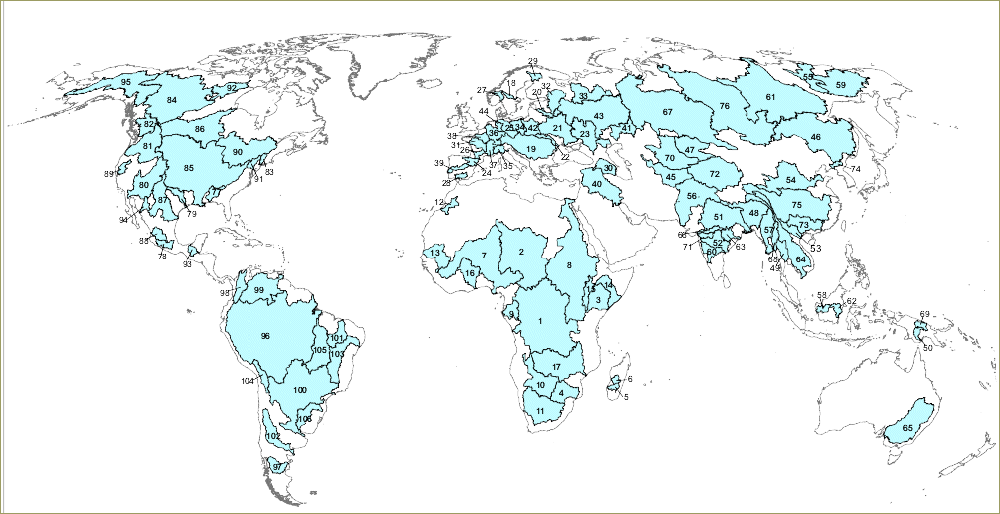  〔World Resources InstituteによるEarthTrendsの中の『Watersheds of the World』から〕 |
〔総務省統計局・政策統括官(統計基準担当)・統計研修所の『世界の統計』から〕 |
||||||||||||||||||||||||||||||||||||||||||||||||||||||||||||||||||||||||||||||||||||||||||||||||||||||||||
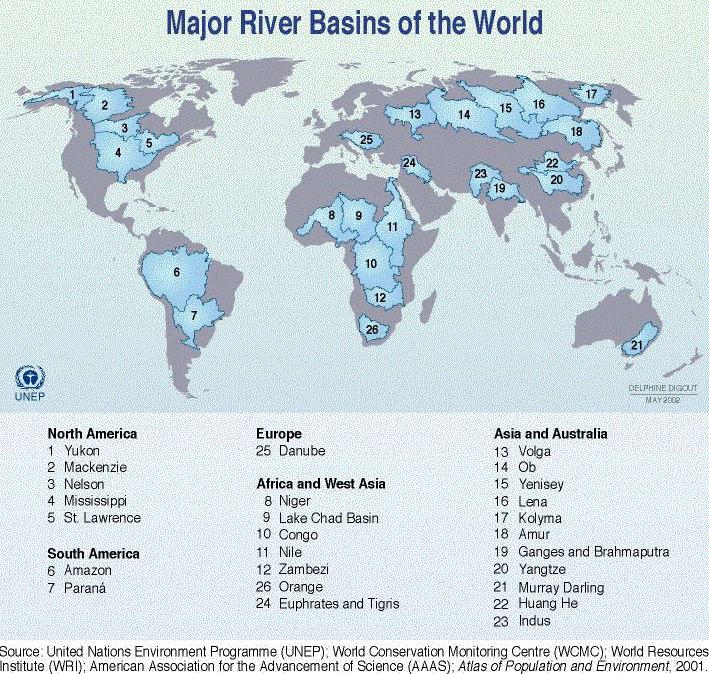 〔UNEPの『Maps & Graphics』の『Vital Water Graphics』の『FRESHWATER RESOURCES』から〕 |
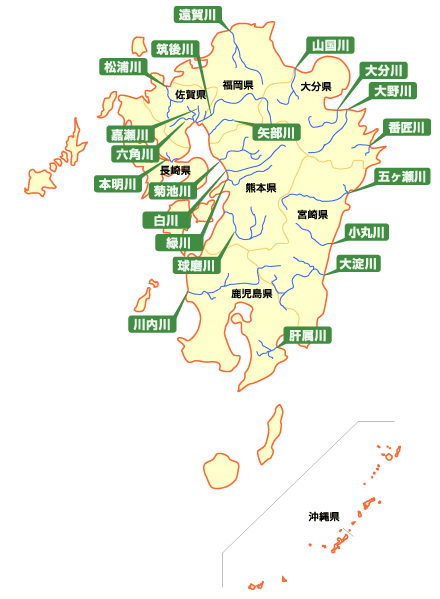 |
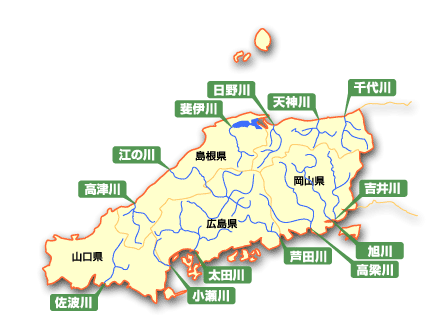 |
 |
 |
||
| 〔国土交通省河川局の中の『日本の川』から〕 | ||
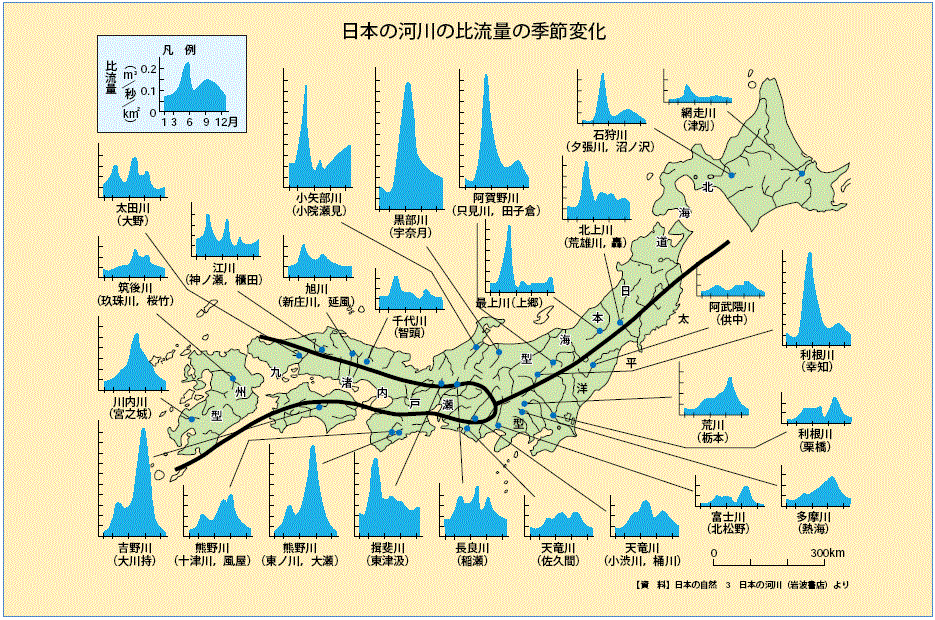 日本の河川の比流量の季節変化 〔(財)ダム水源地環境整備センターの中の『ダム関連資料(日本のダムの必要性と現況)』から〕 |
| 地下水 |
陸水の中で、液体の水の存在量が最も多いのは地下水(Groundwater)である。
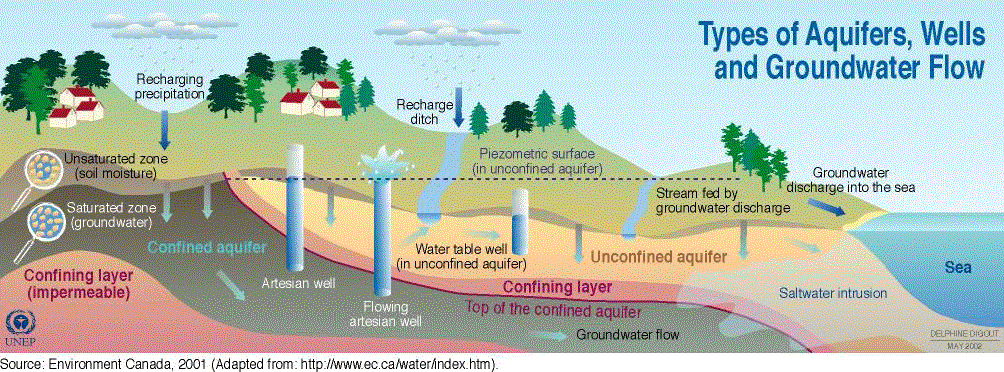 〔UNEPの『Maps & Graphics』の『Vital Water Graphics』の『FRESHWATER RESOURCES』から〕 帯水層(Aquifer)、井戸(Well)、地下水流(Groundwater Flow)のタイプ。 |
| 雪氷 |
ウィキペディア(HP/2015/6)による『氷河』から |
||||||||||||||||||||||||||||||||||||||||||
 巨大な氷の塊、南極氷床 |
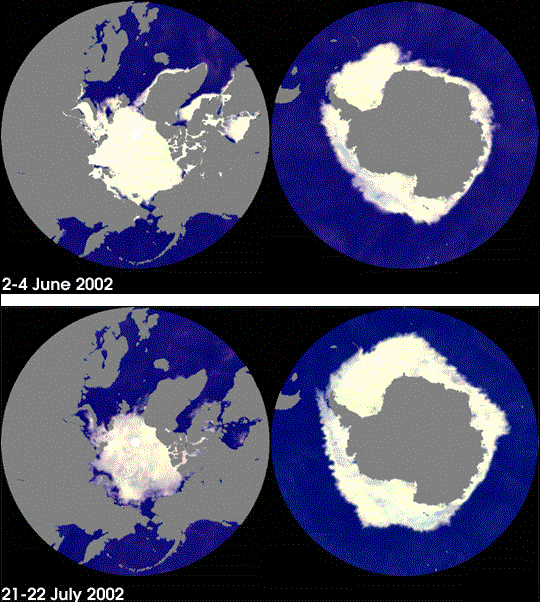 〔NASAによるVisible Earthの『Oceans』の中から〕 海氷の分布。人工衛星AquaのAdvanced Microwave Scanning Radiometer - EOS (AMSR-E)により、2002年6月2日~7月22日に観測されたデータから。 |
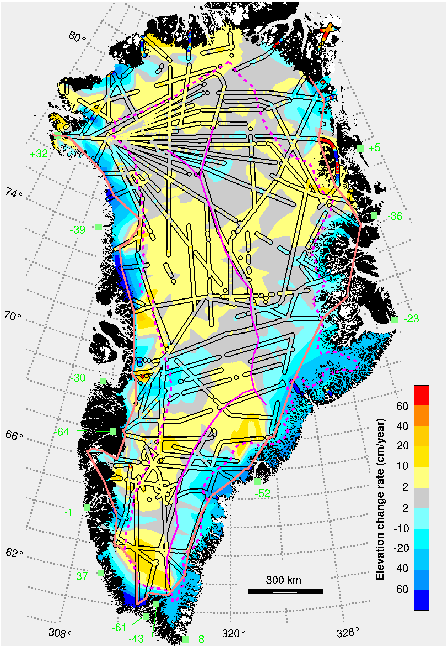 Fig. 1. Greenland, showing sight tracks (outlined in black)
of laser-altimeter surveys color-coded according to the rate
of change in surface elevation (dH/dt). Pale
gray segments are in balance within the survey errors (62 cm/year).
Regional values of dH/dt were obtained over most of the ice sheet
by interpolating between sight-track data. In areas near the
coast (outside the pink boundary) that were not bounded by survey
data, we interpolated between sight-track data and hypothetical
values of dH/dt derived from PDD anomalies at coastal weather
stations (10). The 13 coastal stations are shown in green along
with the dH/dt (cm/year) values derived from the PDD anomalies.
The lines of major icesheet ridges are shown in 〔NASA Goddard Space Flight CenterのWallops Flight FacilityによるAirborne Topographic Mapperの『Arctic Ice Mapping』の中の『ATM Greenland Ice Mapping』から〕 |
| エルニーニョ |
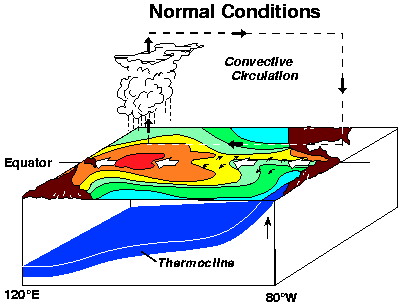
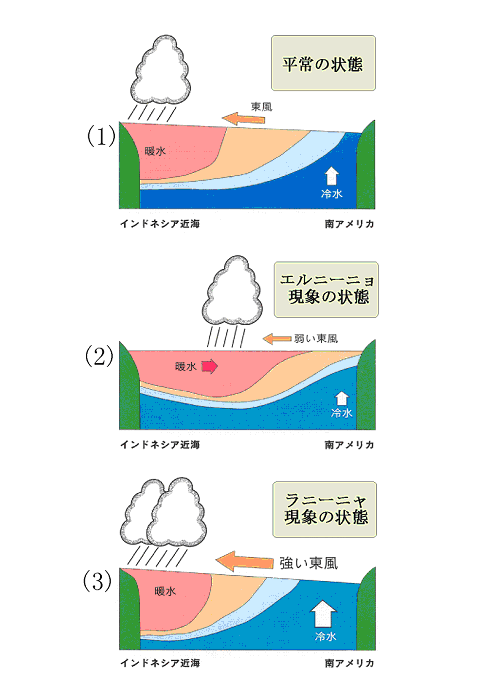 〔気象庁の『気候・環境の情報』の中の『エルニーニョ/ラニーニャ現象の情報』から〕 |
 |
 |
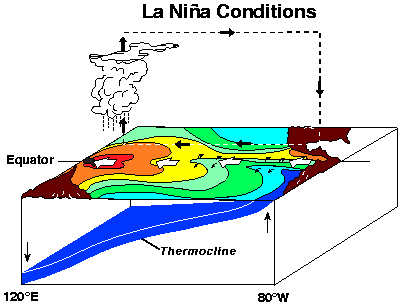 |
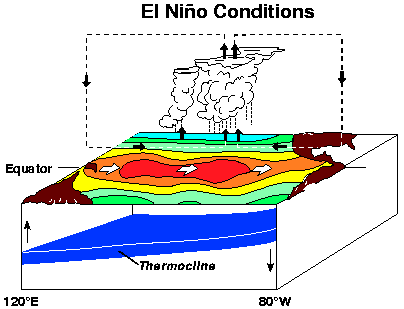
| 〔NOAAのNancy Soreide氏とMichael J. McPhaden氏によるEl Nino Theme Page Homeから〕 | ||
| 水文学 |
| 地表の高度 |
 |
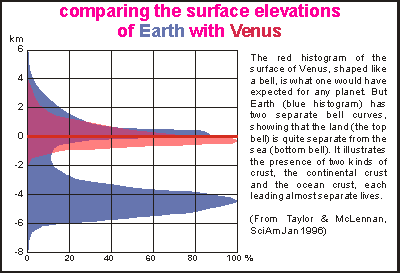 |
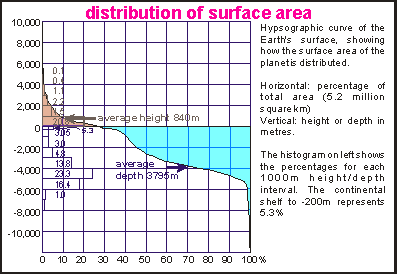
| 〔Seafriends Marine Conservation and Education Centreによるseafriendsの『oceanography』の中の『Oceanography: Oceans』から〕 | |
| 海水準 |
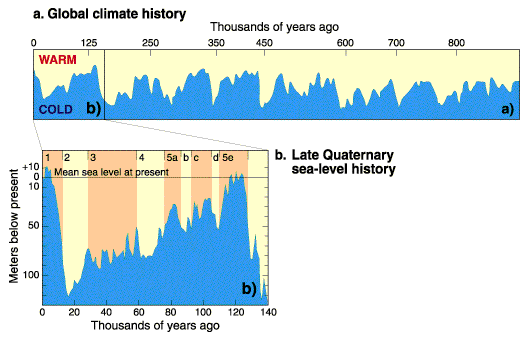 Sea Level Changes The figure below shows the relative temperature over the past million years and highlights how sea level has changed over the past 140,000 years. 〔Climate TimeLineのExploring
Weather & Climate Change Through the Powers of 10の『Climate
Science: Investigating Climatic and Environmental Processes |