白石史人による『地球生物学(Geobiology)』(HP/2019/2/7)から |
|
|
最終更新日:2019年2月7日
地球(Earth)は誕生して約46億年が経過しているが、その概略的な変遷についての情報を集めている。 |
| リンク |
①~46億年・人類への旅~ 第1集 生命の星 大衝突からの始まり http://www.dailymotion.com/video/x34t3ar(59:00) |
|
(1)地球誕生(2002年度) (2)生命誕生(2002年度) (3)全球凍結 Snowball Earth(2002年度) (4)生物の大爆発(2002年度) (5)史上最大の生物大量絶滅事件(2002年度) (6)恐竜絶滅のナゾ(2002年度) (7)人類誕生(2002年度) (8)地球磁場のナゾ(2003年度) (9)全地球ダイナミクス(2003年度) (10)大陸移動(2003年度) |
【大気】(【海】の『リンク』も参照)
【海】(【大気】の『リンク』も参照)
【生命の起源】(【海】の『リンク』も参照)
【ジャイアント・インパクト】(原始地球に火星サイズの惑星が衝突して、月が誕生したという説)
| 地球 |
白石史人による『地球生物学(Geobiology)』(HP/2019/2/7)から |
/Image921.gif) 図38 生命と地球の歴史46億年と未来15億年(modified after Maruyama et al., 2007a).東工大グループは1992-2010年までの世界の造山帯の地質調査に基づいて,(1)横軸46億年研究と(2)特異点研究を通して,生命と地球の歴史の解読を進めてきた.それらの成果を総合化して生命進化に焦点を当てて,表層環境の変化との関係を図示した.大気の酸素濃度は,パルス状の変化(Komiya et al., 2008)をしつつも,大局的には26億年前以前は<10-3PAL,21億年前頃になると10-2PAL,5億年前頃には1PALになった.2回の重大な時代の節目に先行して全球凍結事件が23億年前と8-6億年前に起きた.生物は原核生物から真核生物へ21億年前に進化し,6-5億年前に多細胞動物が誕生し,5億年前には34-38のすべての動物の門が出揃った.海水の総量は惑星としては少なく,大気もまた少量であったことが,酸素大気をつくるきわめて重要な初期条件であった.6億年前に海面上に広大なTTG地殻が露出し,大気-海洋間の大規模物質循環がはじまったことが表層環境(酸素大気)の一方向の進化を導いた.TTGに濃集した栄養塩が海水の逆流に伴って海に急増し,それが後生動物の誕生と多様な進化の原因となった.地球は太平洋型造山運動によって表層に大量のTTGを蓄え,それが栄養塩となって後生動物進化のソースとなった. |
|
/Image920.gif) 図42 日本列島,アジア東部,アフリカ,南米大陸を通る大円断面図で示す第1,第2,第3大陸の分布図.第1大陸と第2大陸はTTGで構成されるが,第3大陸はアノーソサイト組成である(Kawai et al., 2009).第2大陸の分布はアジア大陸の下で最大のサイズに発達している.それは遷移層最下部(520-660km)だけでなく,下部マントル最上部にも漂移している.断面図はMaruyama et al.(2007b)とHuang and Zhao(2006)のP波トモグラフィーに基づいてつくった図30から合成し,模式的に表示した.太平洋とアフリカ大陸直下の2つのスーパープルームとアジア直下の大下降流(Maruyama, 1994; Maruyama et al., 2007a,b)が地球内部の大局的なマントル対流である. |
/Image919.gif) 図43 ウイルソンサイクルにおける第2大陸の役割(Senshu et al., 2009を修正).超大陸ができると,その直下はプレート沈み込みによって冷却するとともに流体の移動による交代作用によって化学的な汚染が起きている.超大陸の中心部の直下のマントル最下部には大量のスラブが集積しているであろう.超大陸の直下の上部マントル最下部には花崗岩からなる第2大陸が生まれ,その自己発熱効果によって,遷移層が過熱され,410km深度から含水ウオズレアイト=カンラン石+水の反応を通して含水プルームが生まれる.それが上昇して超大陸を分裂させる.最下部マントルではスラブの墓場からリサイクルMORBの部分溶融によってスーパープルームが生まれる(Maruyama et al., 2007a,b).これら2つは直後に連結するはずである.上部が下部のダイナミクスをコントロールするのか,下部が上部のダイナミクスを決めるのか,どちらが正しいのだろうか? |
/Image918.gif) 図44 地球誕生時のマグマオーシャン(46億年前)から25億年前までのマントルの密度成層変化を示す模式図(Kawaiet al.,2009).地球誕生時に地球がマグマオーシャンに覆われたならば,厚いアノーソサイトの層が地表を覆ったはずである.これらは対流とともに相転移を起こして,ザクロ石を主とする岩石となり,上部マントル最下部に集積したが,40億年前にプレート運動がはじまると,MORBを主としたスラブが遷移層まで落下したために,相転移によって,MORBはアノーソサイトよりも高密度になるので,アノーソサイトは下部マントルへと引きずり込まれ,最下部マントルで重力的に安定化して第3大陸を構成した.Ca-ペロブスカイトに相転移すると,下部マントルでは最高密度になるからである.その後,遷移層から崩落するスラブに含まれるMORBがD”層内部で部分溶融することによって,スーパープルームが周期的に生まれ,間欠的な全マントル対流が起きた.プレート運動によって表層のTTG物質が40億年前以降につくられると,それらのほとんどは上部マントルに沈み込み,遷移層の最下部に集積し,第2大陸となった(Maruyamaet al.,2007b).その量は,第1大陸の約10倍に達する. |
|
| 丸山ほか(2011)による『太平洋型造山帯―新しい概念の提唱と地球史における時空分布―』から | |
/Image1182.gif) Short(HP/2011/10)による『The Earth as a Planet』から |
/Image2340.gif) (3)地球の形成史 |
/Image2341.gif) (6)地球磁場の成長「28~27億年前」 |
/Image2342.gif) (8)超大陸ヌーナの誕生「19億年前」 |
/Image2343.gif) (9)再び全球凍結「8~6億年前」 (9)再び全球凍結「8~6億年前」 |
| 青森県東青地域県民局地域整備部駒込ダム建設所による『(地球のお話し)』から | |
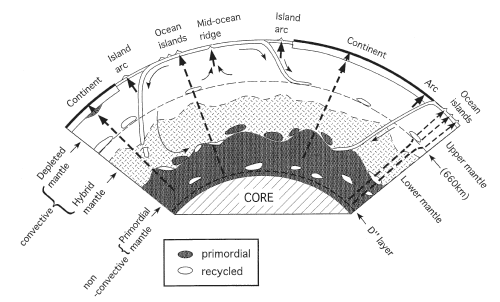 図1 放射性起源同位体比に基づいた地球内部の化学的構造モデル(Kaneoka, 2008). Fig. 1 A model of the chemical structure of the Earth's interior based on radiogenic isotopes(Kaneoka, 2008). 兼岡(2008)による 『“時間”を武器に地球を探る― 年代測定の現状と,同位体比による地球深部の化学的環境の解明―』から Kaneoka, I.(2008): On the degassing state and the chemical structure of the Earth's interior inferred from noble gas isotopes-Past and recent views. Geochemical Journal, 42, 3-20. |
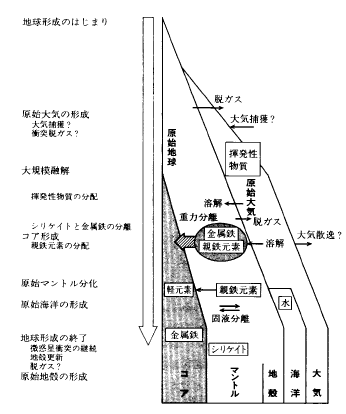 図4: 地球初期進化の概念図. 岩波講座地球惑星科学13 巻. 横畠(2001)による『地球史セミナー第1 回地球史概論』から |
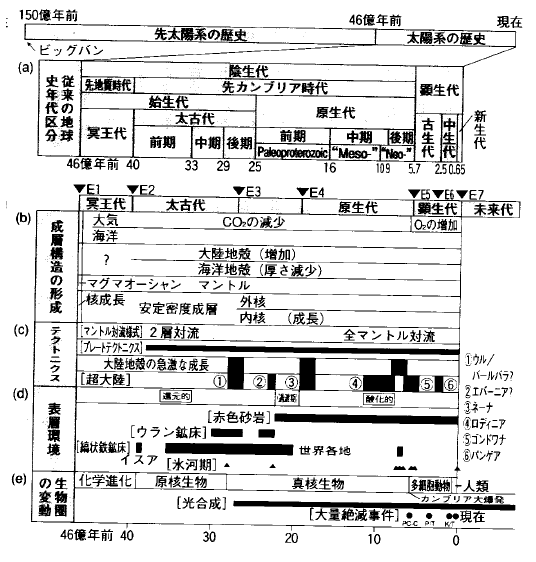 図2: 地球史年表. (a) 従来の時代区分, (b) 地球史7 大事件に基づく時代区分. 川上(2000), p 33. 横畠(2001)による『地球史セミナー第1 回地球史概論』から |
| 大気 |
/Image2361.gif) (大気の変遷の推定例) 「地球の進化」(岩波地球惑星科学13)の図5.16より作成 |
/Image2362.gif) (過去6億年間における酸素(O2)と二酸化炭素(CO2)の量の変化の推定例) 「地球の進化」(岩波地球惑星科学講座13,1998年)の図6.15より作成。 |
| 山賀(HP/2012/10)による『第二部-1- 地球の歴史』から | |
/Image1360.gif) Fig. 7. Some estimates of Cenozoic and Cretaceous atmospheric CO2 levels, based on different proxies and models. Proxy values often represent special extreme variations (e.g. sudden CO2 rise after release of methane from decomposition of clathrates; sharp CO2 decline after burial of organic carbon). Note that estimates based on paleosol carbonates are generally higher than estimates based on other proxies. Many proxies agree on Neogene values, but the spread of estimates increases markedly in the Paleogene and Cretaceous. Most researchers assume that during most of the Cretaceous atmospheric CO2 levels were between 2 and 8 times present. R values on right axis are ‘times pre-industrial.’ Numbers in parentheses are estimates for the time in the future when these levels will be reached, assuming the entire 5000 Gt reserves of petroleum, natural gas, and coal will be used at the increasing rate determined from past history (1958.2008). Data from Cerling (1991), Ekart et al. (1999), Freeman and Hayes (1992), Haworth et al. (2005), Pagani et al. (1999), Pearson and Palmer (2000), Retallack (2001), Royer et al. (2001b), Berner and Kothavala (2001), Wallmann (2001), and Yapp and Poths (1996). Hay(2011)による『Can humans force a return to a ‘Cretaceous’ climate?』から |
/Image1171.gif) Fig. 2 Evolution of the Sun's luminosity with time in the last 4.6 Ga, as predicted by the computer model of Gough (1981). The increase is around 7% every Ga. The young Earth therefore experienced a fainter Sun ~30% less powerful 4.5 Ga ago than at present |
|
/Image1172.gif) Fig. 3 Long-term evolution of the relative concentrations of CO2 and CH4, as well as of O2. To be noticed are (1) the rapid decrease in methane coinciding with an O2 rise, leading to the Huronian glaciation (2.2-2.4 Ga) and (2) the drop in CO2 at the beginning of the Neoproterozoic leading to major glaciation (750 Ma). (From Kasting 2004) |
|
/Image1173.gif) Fig. 6 This curve depicts the most recent results from the GEOCARB model of Berner for the evolution of CO2 concentration in units of PAL (1 PAL = 280 ppm). The grey envelope shows the importance of uncertainties. The window inside the vertical lines corresponds to the Cretaceous-Palaeocene period. (From Berner 1994) |
/Image1174.gif) Fig. 7 Reconstruction of atmospheric CO2 concentrations for the Mesozoic and the Cenozoic since 250 Ma, derived from two different models GEOCARB (circles Berner 1994) and GEOCLIM (squares Donnadieu et al. 2006). The major difference between these two models is the evaluation of the sink. Large uncertainties remain independently of the models used. (Reconstruction from compilation by Royer D.A. 2006) |
/Image1175.gif) Fig. 9 Evolution of the biodiversity and of atmospheric CO2 (crosses) during the Triassic and the Jurassic periods. The red and black curves correspond to calcareous plankton evolution during the same period. The dashed curve corresponds to the GEOCARB III model. (Godde´ris et al. 2008) |
|
| Ramstein(2011)による『Climates of the Earth and Cryosphere Evolution』から | |
/Image1169.gif) Figure 1: Changing concentrations of atmospheric carbon dioxide with time on Earth in response to the steady increase in solar luminosity (after Kasting 1993). The amount of past CO2 that has been calculated in this figure (using the model of J.F. Kasting, 1993) is the concentration required to keep the surface warm enough for liquid water to exist even with past lower solar output. PAL = present atmospheric level of CO2. The Moon formed between 4.5 and 4.45 billion years ago (dark blue field). The Earth could have started with an atmosphere extremely enriched in carbon dioxide (gray field). The rise in land plants after 500 million years ago ("C3" on the figure) defines a inimum limit for CO2 in the air after that time. /Image1170.gif) Figure 2: This plot (after Kasting, 1993) shows estimates of changing concentrations of free oxygen in the atmosphere over geologic time. The area (in light blue) represents the range in possible concentrations of oxygen based on model calculations, and the study of ancient soils (paleosols), fossil organisms, and marine sediments that only form in the absence of oxygen. These sediments are preserved as Banded Iron Formations (BIF) and only appear in the geologic record up to about 1.8 billion years ago. Although it is not known when photosynthesis began, it is clear that photosynthesis only became an important producer of oxygen in the atmosphere late in Earth’s history. PAL = present atmospheric level of O2. Mojzsis(HP/2011/10)による『Life and the Evolution of Earth’s Atmosphere』から |
/Image1168.gif) 大気中の酸素とオゾン濃度の進化 JAXA(HP/2011/10)による『超伝導サブミリ波リム放射サウンダ(SMILES)』から |
/Image1160.gif) 井上(HP/2011/10)による『酸素発生型光合成と藻類』から |
/Image1183.gif) Short(HP/2011/10)による『The Earth as a Planet』から |
/Image1165.gif) O2 build-up in the earth's atmosphere. Red and green lines represent the range of the
estimates while time is measured in billions of years ago (Ga).
Wikipedia(HP/2011/10)による『Great Oxygenation Event』から |
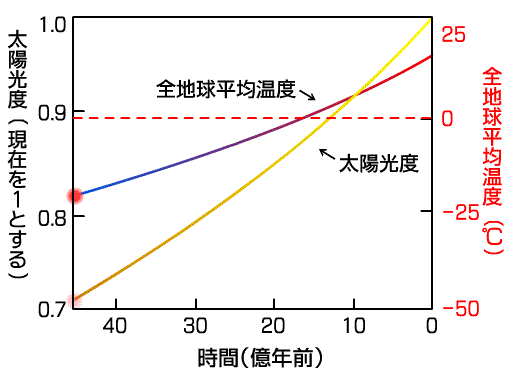 理科ネットワークの『地球と生命の誕生』の中の『暗い太陽のパラドックス』から 約46億年前に誕生した太陽は核融合反応により輝いているが、初期は暗かった(現在の7割程度の明るさ)と予想されている。地球の表面温度(全地球平均温度)は、主に太陽光度の大きさによって決まると考えると、初期の地表面温度はマイナス数10℃になってしまう。現在知られている証拠は、そのような低温環境を示さない。これが『暗い太陽のパラドックス』である。これは、初期の地球大気には大量の二酸化炭素が存在したため、その温室効果によって暖められ、地表面温度は適度な値であったと説明されている。 |
/Image2344.gif) (15)地上最大の動物「恐竜」の盛衰「2.4億年~0.65億年前」 青森県東青地域県民局地域整備部駒込ダム建設所による『(地球のお話し)』から |
/Image1166.gif) 過去の地球大気組成 倉本(2004)による『海と惑星はなぜ存在するのか 惑星大気起源論への招待』から |
| 海 |
/Image2514.gif) Figure 1: Evolution of Earth's atmospheric oxygen content through time. The faded red curve shows a ‘classical, two-step’ view of atmospheric evolution, while the blue curve shows the emerging model (pO2, atmospheric partial pressure of O2). Right axis, pO2 relative to the present atmospheric level (PAL); left axis, log pO2. Arrows denote possible ‘whiffs’ of O2 late in the Archaean; their duration and magnitude are poorly understood. An additional frontier lies in reconstructing the detailed fabric of ‘state changes’ in atmospheric pO2, such as occurred at the transitions from the late part of the Archaean to the early Proterozoic and from the late Proterozoic to the early Phanerozoic (blue boxes). Values for the Phanerozoic are taken from refs 96 and 97. |
/Image2515.gif) Figure 3: Ocean ventilation and evolving ocean redox structure. a, Contours of globally averaged deep ocean O2, which is largely set by a balance between O2 introduced from the atmosphere and the respiration of settling organic matter in the ocean (the ‘biological pump’). Calculations are performed as in Canfield and Sarmiento et al. but are recast in terms of atmospheric O2 levels and carbon fluxes through the biological pump (both normalized to the modern Earth). Grey contours reflect globally averaged deep ocean O2 concentration (in μM), with the red contour showing the boundary below which the modelled deep ocean becomes anoxic. b-d, Summary of an emerging model for the evolving first-order redox structure of the ocean (see text): b, Archaean; c, early/mid-Proterozoic; d, late Proterozoic/Phanerozoic. Left and right insets in each panel b-d show average profiles of O2 (blue), H2S (green) and Fe2+(red); also shown (colour bar) is the general offshore decrease in local organic carbon (Corg) fluxes and its impact on the redox profile of the water column. Double-headed arrows denote expected expansion and contraction of sulphidic and/or ferruginous conditions (grey shading) along the productive and correspondingly reducing ocean margins. We emphasize that the Ediacaran, and much of the late Proterozoic more broadly, was most likely to have been marked by transient oscillation between states depicted in c and d. It is also important to note that small amounts of oxygen were probably present, locally and perhaps transiently, in the Archaean atmosphere and shallow ocean (b), perhaps as local oxygen oases for the latter. |
/Image2516.gif) Figure 2: Summary of carbon (black) and sulphur (red and grey) isotope data through Earth’s history. Data are shown as δ13C (left axis and Δ33S ( = δ33S-0.515δ34S; right axis). Grey sulphur data were generated by secondary ion mass spectrometry (SIMS); red circles designate all other data?bulk and small sample (micro-drilled and laser) analyses. Notable features include the large range of Δ33S values during Archaean time, the large δ13C excursion during the early Proterozoic, relative stasis in δ13C during the mid-Proterozoic, and the large negative δ13C excursions during the late Proterozoic. Data are from references as compiled in refs 33 and 53. |
|
| Lyons et al.(2014/2)による『The rise of oxygen in Earth's early ocean and atmosphere』から | |
/Image2523.gif) Figure 1. Earth's surface oxygenation through time and its relationship to significant steps in biological evolution. The upper panel shows atmospheric oxygen abundances in % relative to present atmospheric levels (PAL). The lower panel shows the relative distribution of oxygen- (O2), sulfide- (H2S), and iron-rich (Fe2+) waters in the shallow and deep oceans. Lighter blue shading indicates lower dissolved O2 levels. Lighter pink shading means less H2S and more Fe2+. Kendall(2013/3)による『Earth's oxygen revolution』から |
/Image1191.gif) Fig. 1. Compilation of new and previously published oxygen isotope data for screened chert samples over geologic time. All samples except the 3800 Ma examples are for unmetamorphosed cherts or cherts metamorphosed no higher than Greenschist Facies. The history of long-lived continental cratons is taken from Rogers (1996) and the horizontal lines represent periods of stability of specific cratonic masses identified by him. The 10‰ variation in δ18O for cherts at any given time is caused by the presence of low 18O meteoric waters present during diagenetic chert formation and/or formation of cherts during deeper burial at elevated temperatures. The overall increase in δ18O with time is interpreted as global cooling over the past 3500 Ma. New data are given in Tables 1 and 2. Published data are from Knauth and Lowe (1978, 2003), Force et al. (1986), Gao and Land (1991), Suchecki and Hubert (1984), Kenny and Knauth (1992), Beeunas and Knauth (1985), Winter and Knauth (1992) and references cited therein. /Image1192.gif) Fig. 2. Halite accumulations in the Phanerozoic. Data were originally listed by geologic time period (Zharkov, 1981; Land et al., 1988) and are centered here on the absolute age of these designated periods. Precambrian halite has never been inventoried. The Neoproterozoic value estimated here is based on the assumption that the enormous accumulations in Australia, Oman, Iran and Pakistan are spread over basins larger in extent than that hosting the Luann salt, USA (180 Ma). Most of the known salt was clearly deposited in two large pulses, one in the interval 180-250 Ma and one in the interval 500-700 (?) Ma. Sequestration of these “saline giants” requires a rare combination of geographic, geologic, climatic, oceanographic and depositional conditions. /Image1193.gif) Fig. 3. Dissolved oxygen in seawater as a function of salinity and temperature for the present atmosphere (1 PAL O2) and an ancient one with 10% of the present atmospheric level of O2 (0.1 PAL) using experimentally determined algorithms by Weiss (1970). An example threshold level of 0.5 ml/l for dissolved O2 required for Neoproterozoic metazoans is shown together with example trajectories for the evolution of dissolved O2 in seawater with time. Curve B invokes a minimum salinity in the Archean and a relatively steady decrease throughout the Precambrian. Curve A is for high initial salinity with little decline until deposition of the great Neoproterozoic saline giants. Under an atmosphere of 0.1 PAL O2 and temperatures of 15-25 ℃, reduction of ocean salinity by deposition of these salt deposits could shift dissolved O2 to values above that required for metazoan respiration, as shown by the arrow labeled “Neoproterozoic”. Knauth(2005)による『Temperature and salinity history of the Precambrian ocean: implications for the course of microbial evolution』から |
| 生命 |
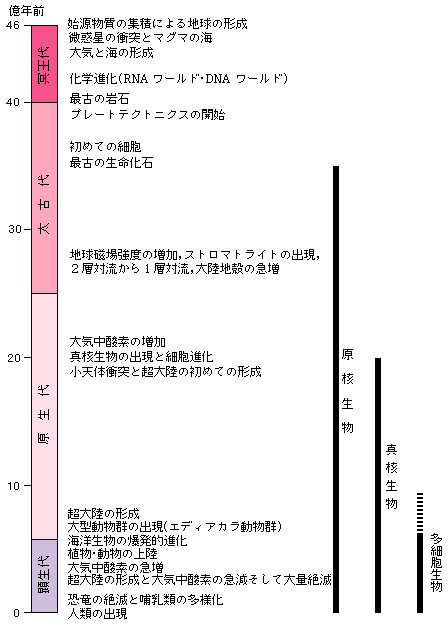 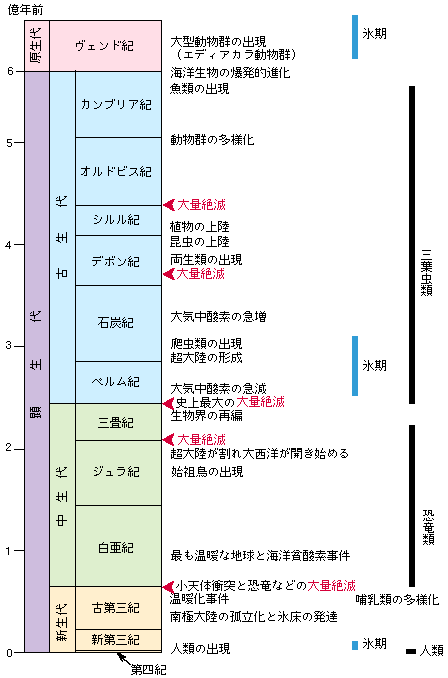 〔東北大学理学部自然史標本館の『ツアーコース』の中の『地球生命の進化』から〕 |
| ジャイアント・インパクト |
/Image2180.gif) Strobel(2011)による『Moons and Rings』から |
/Image1180.gif) Figure 2: The effect on Earth of the giant impact that formed the Moon. a, A giant planetary embryo collides with the nearly complete Earth. b, A magma disk is in orbit about Earth, while blobs of iron from the planetary embryo settle down through the mantle to join the existing core. c, The outermost part of the magma disk coalesces to form the Moon as the result of radioactive cooling, while the rest falls back to Earth. Inside Earth, the mantle nearest the core has partly solidified, and the mantle might acquire a layered structure. Stevenson(2008)による『A planetary perspective on the deep Earth』から |
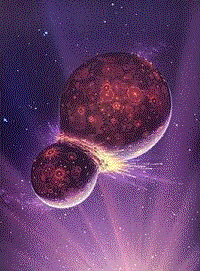 The Earth's core was formed in two stages, which could explain why scientists have been coming up with two different dates for its age (Image: Universe Today/NASA) 〔Anna Salleh氏によるGiant impact added to Earth's coreから。ABCの『News in Science』の中のページ(Thursday, 27 October 2005)。〕 |
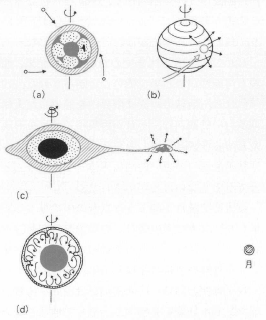 図5 月のマグマオーシャン起源仮説.(a)表層が融解していた地球に、(b)天体が衝突し、(c)地球自転が加速されて一部が分離し、(d)月を形成する。高橋(1993)より。 奥地・高橋(1994)による『地球化学的月起源論』から |