|
最終更新日:2017年2月16日
|
|||
|
大陸移動説 | プレート・テクトニクス | その他 |
リンク⇒こちら| プレート・テクトニクス⇒こちら| 超大陸| |
ウェゲナー| 大陸移動説| |
地殻とプレート| プレート境界| プレート運動の原動力| 造山帯| 沈み込み帯|構造浸食作用| 日本周辺のプレート| アフリカ大地溝帯| |
LIP| ホットスポット| マグマ| プレートテクトニクス用語⇒こちら| |
プレート・テクトニクス(Plate Tectonics)とは、地球表層(リソスフェア、Lithosphere)は100〜150キロメートル程度の厚さの比較的硬い岩盤(Rigid Bedrock)からなり、それが大きいもので十数枚に分かれており、水平運動(Lateral Movement)を行う過程で、それらの境界部(Boundary)において地球内部からの熱(Heat)と物質(Substance)が地表へ放出されるために起こる様々な地質現象(Geologic Phenomenon)を説明するモデル(Model)である。1910年代のウェゲナー(Alfred Wegener)による大陸移動説(Continental
Drift)が発展した形で、1960年代後半頃に世界的に確立され、日本でも1980年代頃に導入された。硬い岩盤はマントル最上層部(Uppermost Part of Mantle)と地殻(Crust)とからなり、プレート(Plate)と呼ばれる。これはリソスフェア(Lithosphere)とも呼ばれる。また、テクトニクス(Tectonics、変動構造地質学)とは構造運動のことである。地球科学分野で最大のモデルである。 このモデルにより、地震(Earthquake)や火山活動(Volcanic Activity)などが理論的に説明できるようになった。 |
超大陸 |
Wikipedia(HP/2015/8)による『Supercontinent』から |
太古の超大陸
未来の超大陸
ウィキペディア(HP/2012/7)による『超大陸』から |
図2 原生代中期-後期の超大陸ロディニア(Rodinia)およびゴンドワナ(Gondwanaland)の古地理図と原日本の位置(Rino et al., 2004から一部変更).右:ロディニアは約1300-1000Maの間の一連の大陸衝突によってできた超大陸で,衝突した大陸塊間にグレンビル造山帯(濃紺色の領域)が形成された.日本主部と近縁な南中国(S.China)地塊は北米(Laurentia; Laur)地塊,オーストラリア(Aust)地塊そして東南極(E.Ant)地塊に挟まれた位置にあった.南中国地塊自体はグレンビル期に揚子(Yangtze)ブロックとカタイシア(Cathaysia)ブロックが衝突してできたが,両者間の衝突帯は四堡(Sibao)造山帯となった.当時の日本の位置は,低緯度地域にあって,南中国地塊,とくに北米地塊に接したカタイシアの縁辺にあった.ちなみに北中国(N.China)地塊はシベリア(Sib)地塊の横に位置していたらしい.超大陸ロディニアは,原生代後期に巨大な太平洋スーパープルーム(赤色円で示す)などの複数のマントル・プルームの活動によって約7億年前頃に分裂した.左:超大陸ロディニアのなかでは北米地塊をとり囲んでいた多数の大陸塊は,分裂後は四方へ離散したが,約540Ma(カンブリア紀最初期)頃までに地球の反対側で再度集結して別の大陸ゴンドワナを形成した(Hoffman, 1991; Dalziel, 1992; Li, 1999).当時の南中国地塊はオーストラリア地塊からは分離していたものの,その東側の近接した地域に位置していた.現在の日本主部にあたる部分は,ロディニアのなかでは低緯度にあって,南中国地塊のカタイシア・ブロックの北米側に位置していた.北中国地塊はゴンドワナ北西部のアフリカと南米の北側に隣接していた. 磯崎ほか(2011)による『活動的大陸縁の肥大と縮小の歴史―日本列島形成史アップデイト―』から |
図32 大陸地殻成長率曲線は何を意味するか?河口の河砂中のジルコンの年代頻度分布を世界の主要河川をほぼ全部カバーして分析し,全大陸のカバー面積(約40%)から見積もった大陸地殻成長率曲線(Rino et al., 2008を部分的に修正).これまでにさまざまな手法で大陸地殻の成長率が見積もられてきた(図中の略字はそれらを示す)が,太線の曲線がジルコン法で見積もられた結果である.これは,造山帯の形成年代分布(図31)から得られた曲線(M)とほぼ同じパターンを示す.地球は形成後20億年経過した26億年前に至っても,現在の大陸(100%とする)面積の18%しか存在しなかった.地球史後半の20億年で残りの80%が増加した.これは太古代造山帯の熱史と岩石学的研究から導かれる常識的な解釈,すなわち80%以上の大陸地殻が太古代末までにできていたとする考えに矛盾する.太古代マントルは現在よりも150-200K高温のマントルであり,マントル対流は二層対流であったと考えられるので,長大な海嶺と海溝が存在したはずで,したがって大量のTTG地殻を生産したはずである.この矛盾を説明するのは大量の大陸地殻の沈み込みである. |
図34 超大陸の形成と地球史(Senshu et al., 2009; 千秋ほか, 2010).超大陸は,18億年前のNuna,10億年のRodinia,5.4億年前のGondwana,3-2億年前のPangea,2-3億年未来のAmasiaがあげられる.これらは,地表に残された記録の解読と,プレート運動の未来予測から推定される(a).一方,超大陸内部に残された縫合線のパターンから,重複沈み込みの時空配列を解析すると,マントル深部に向かう強力な下降流の発生とその場所を特定することができる(b).そのパターンから真の超大陸形成のメカニズムを解析できる(c).パンゲアは真の意味の超大陸ではない.また超大陸は20億年前頃になってはじめて出現した.(d)は超大陸の復元図を示す(Senshu et al., 2009). |
丸山ほか(2011)による『太平洋型造山帯―新しい概念の提唱と地球史における時空分布―』から |
Figs. 3-10. Secular trends for 0 to 550 Ma. (Table 1 takes the place of these captions). Figs. 11-45. Secular trends for 0 to 4560 Ma. (Table 1 takes the place of these captions). Fig. 46. (A) Published assessments of the tenures of various supercontinents according to the identified authors. (B) Age distributions (in black) of variables that have bear on the tenures of supercontinents, from sources cited in Figs. 11, 14, 15, 16, and 20. For each plot, the blue, green, lavendar, orange, and pink swaths indicate tenures of supercontinents as inferred from minima in those data alone. Dimmer and brighter colors represent more and less inclusive interpretations, respectively. The colored swaths agree in general but diffe in many details. (C) Proposed tenures of supercontinents based on the present study, combining information from Phanerozoic plate reconstructions, passive-margin age distributions, and zircon age distributions. Bradley(2011)による『Secular trends in the geologic record and the supercontinent cycle』から |
Figure 6.7 Schematic diagram showing the approximate timing of amalgamation and dispersal of the major continents through time (after Rogers, 1996). Robb(2006)による『Introduction to Ore-Forming Processes』から |
ウェゲナー |
|
Alfred Lothar Wegener (1880-1930), the originator of the theory of continental drift. (Photograph courtesy of the Alfred Wegener Institute for Polar and Marine Research, Bremerhaven, Germany.) |
〔W. Jacquelyne Kious and Robert I. TillingによるThis Dynamic Earth: the Story of Plate Tectonicsから〕 |
大陸移動説 |
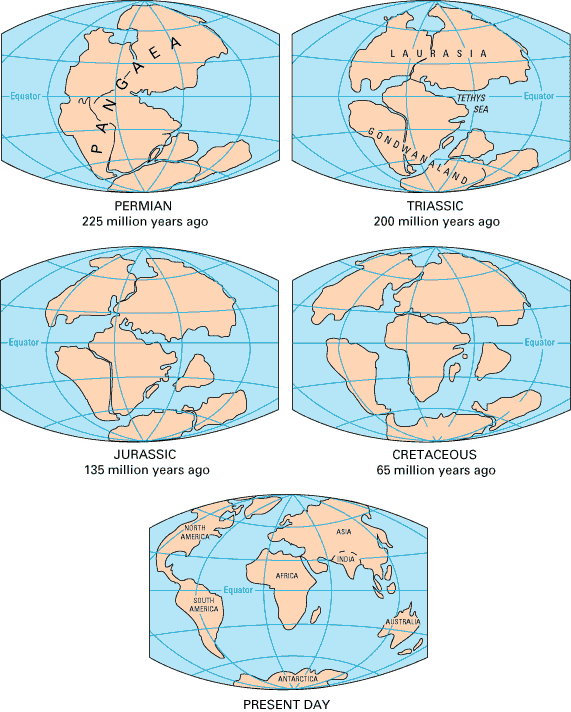
According to the continental drift theory, the supercontinent Pangaea began to break up about 225-200 million years ago, eventually fragmenting into the continents as we know them today. 〔W. Jacquelyne Kious and Robert I. TillingによるThis Dynamic Earth: the Story of Plate Tectonicsから〕 |
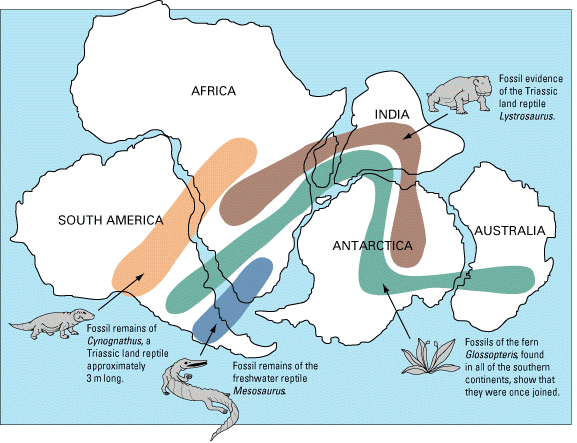
As noted by Snider-Pellegrini and Wegener, the locations of certain fossil plants and animals on present-day, widely separated continents would form definite patterns (shown by the bands of colors), if the continents are rejoined. 〔W. Jacquelyne Kious and Robert I. TillingによるThis Dynamic Earth: the Story of Plate Tectonicsから〕 |
地殻とプレート |
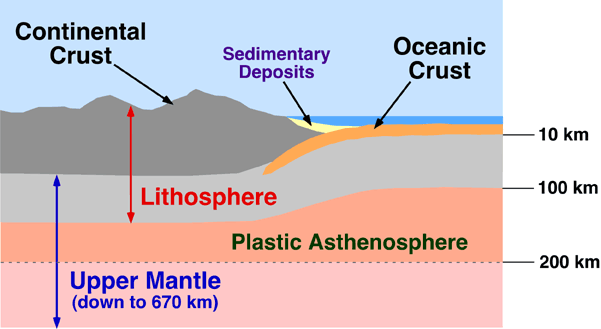
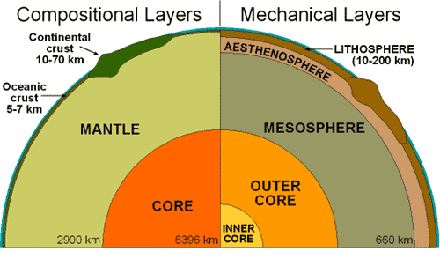
Figure 10h-2: Structure of the Earth's crust and top most layer of the upper mantle. The lithosphere consists of the oceanic crust, continental crust, and uppermost mantle. Beneath the lithosphere is the asthenosphere. This layer, which is also part of the upper mantle, extends to a depth of about 200 kilometers. Sedimentary deposits are commonly found at the boundaries between the continental and oceanic crust. 〔Michael Pidwirny氏によるPhysicalGeography.netの『FUNDAMENTALS OF PHYSICAL GEOGRAPHY』の『CHAPTER 10: Introduction to the Lithosphere』の中の『(h). Structure of the Earth』から〕 地殻(crust:海洋地殻と大陸地殻)+マントル(Mantle)最上部=リソスフェア(Lithosphere:プレート)。プレートの厚さは100〜150kmで、剛板(硬い板)のように振舞う。アセノスフェア(Asthenosphere)は軟らかく(温度が高く、一部溶融しているらしい)、その上をプレートが滑るように水平移動する。 |
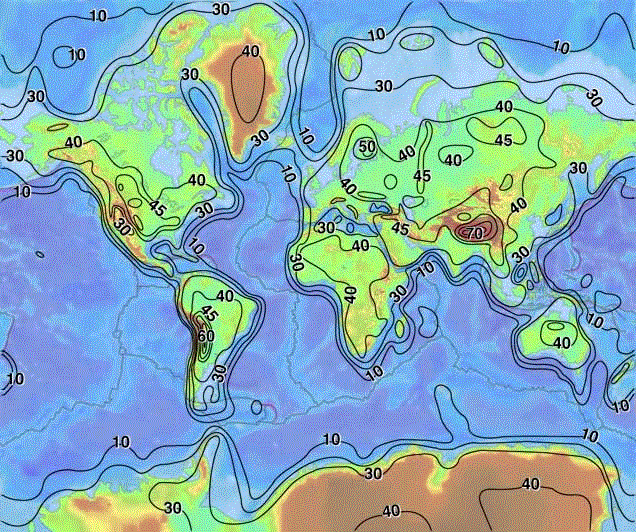
How Thick Is the Earth's Crust? This contour map of the thickness of the Earth's crust was developed from the CRUST 5.1 model. The contour interval is 10 km; we also include the 45 km contour for greater detail on the continents. 〔USGSによるEarthquake Hazardsの中の『The Earth's Crust』から〕 大陸地殻の厚さは30〜40kmだが、70kmを越すところもある。一方、海洋地殻は10km以下。 |
大陸 | 海洋 | ||||
|
30km ↓ |
(6km/s) |
|
||
(7km/s) |
7km ↓ |
(プレート) |
|||
(7km/s) |
|||||
(8km/s) |
↑ 80km ↓ |
||||
|
↑ 120km ↓ |
(8km/s) |
|||
(7.8km/s) |
|
||||
(7.8km/s) |
earth structure - The compositional and mechanical layers of the earth. 〔Visionlearning, Inc.によるViosionlearningの中の『Earth Structure』から〕 左側は化学的性質の違いにより、右側は物理的性質の違いにより分けられている。つまり、地殻+マントル最上部=リソスフェア(プレート)。 |
プレート境界 |
|
|
|
|
離れあう (発散、Divergent) |
海嶺(Ridge) | 海洋地殻−海洋地殻 | 大洋の中央部の海底大活火山脈。 |
リフト(Rift) | 大陸地殻−大陸地殻 | 東アフリカの大地溝帯など。 | |
ぶつかりあう (収束、Convergent ) |
沈み込み帯(Subduction Zone) | 海洋地殻−大陸地殻 | 日本列島など。 |
造山帯(Orogenic Belt) | 大陸地殻−大陸地殻 | ヒマラヤ山脈など。 | |
すれ違う | トランスフォーム断層(Transform Fault) | (主に、海洋地殻−海洋地殻) | 主に、逆断層。 |
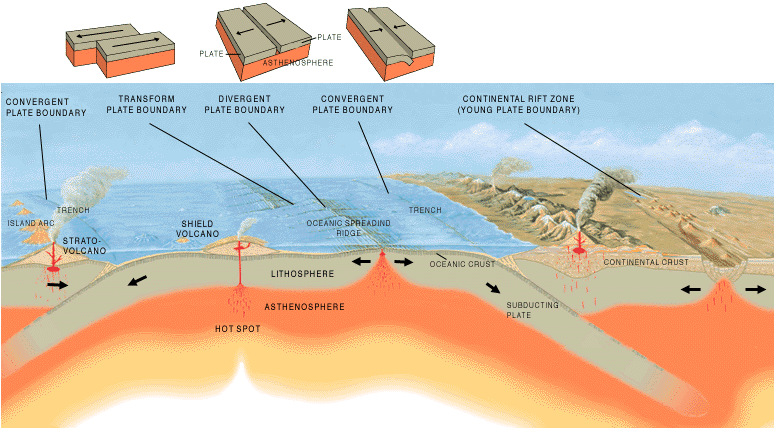
・プレート境界は、力学的弱部にあたるため、地下のエネルギー(熱)と物質(マグマなど)が地表に放出されやすい。従って、地震や火山活動が活発であり、地質学的に顕著な現象が起こっている。とくに、発散境界と収束境界で大規模な活動が発生している。 ・プレート境界以外で火山活動などが活発な場所は、ホットスポットと呼ばれることがあるが、プレートを貫いてマントルからのプルームが地表に達している場所である。ハワイ諸島が代表的な例である。 ・アイスランド島は、大西洋中央海嶺が地表に現れている場所であり、カーテン状噴火が特徴的である。 |
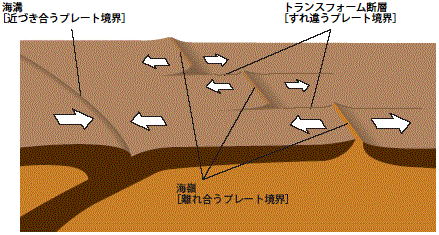
プレートの動きと境界 〔文部科学省地震調査研究推進本部の『地震の基礎知識』の中の『地震発生のメカニズムを探る』から〕 プレート境界は次の3種:
|
A cross section illustrating the main types of plate boundaries. Illustration by Jose F. Vigil from This Dynamic Planet -- a wall map produced jointly by the U.S. Geological Survey, the Smithsonian Institution, and the U.S. Naval Research Laboratory. 〔USGSのIndex of pubs.usgs.gov/gip/の『Earthquakes』の『Where Earthquakes Occur』から〕 プレート境界は、1)発散(divergent)、2)収束(convergent)、3)すれ違い〔transform;トランスフォーム断層(Transform fault)〕の3つ。発散が起こっている場所の例は海嶺(ridge)とリフト(rift)、収束の例は海溝(trench)〔あるいはもっと広く沈み込み帯(subducting zone)〕。ホットスポット(Hotspot)は、マントル(Mantle)の深い部分からプレートを貫いてプルームが上昇する場所〔例えば、ハワイ島(Hawaii (island))〕。 |
プレート運動の原動力 |
図6:プレート運動・大陸移動の原動力に関する二つの考え方。(上)1970年代半ば以降の考え方(Forsyth and Uyeda, 1975, Geophys. J. R. Astron. Soc.)。この場合、「マントル曳力」(マントルがプレートの底面を引きずる力)はスラブ引っ張り力よりも小さく、また、プレート運動・大陸移動の抵抗力として働く。(下)本研究のシミュレーション結果に基づく考え方。この場合、「マントル曳力」はプレート運動・大陸移動の原動力として働く。Jain (2014, Fundamentals of Physical Geology)の図に加筆。 吉田(2015)による『パンゲア時代から現在までの2億年間のマントル対流の数値シミュレーション』から |
図6:大陸移動の原動力に関する二つの考え方。(上)1975年以降の考え方(Forsyth & Uyeda, 1975, Geophys. J. R. Astron. Soc.)。この場合、「大陸下マントル曳力」(マントルが大陸の底面を引きずる力)は大陸移動の抵抗力として働く。(下)本研究のシミュレーション結果に基づく考え方。この場合、「大陸下マントル曳力」は大陸移動の原動力として働く。 |
図7:超大陸下の上昇プルームの発生と、超大陸の熱遮蔽効果による高温異常領域の発生のメカニズムを表した模式図(Yoshida & Santosh, 2011, Earth-Sci. Rev.; Heron & Lowman, 2014, J. Geophys. Res.)。 |
(独)海洋研究開発機構(吉田・浜野)(2015/2)による『スーパーコンピューターでパンゲアの分裂から現在までの大陸移動を再現し、その原動力を解明−ヒマラヤ山脈はマントルのコールドプルームが作った!−』から |
造山帯 |
図1 2つの対照的な造山帯の構造と要素.上:衝突型造山帯の構成要素と大構造.ヒマラヤ山脈の南北断面図.下:太平洋型造山帯の構成要素と大構造.ともに広域変成帯を中核とした構造をもつが,衝突型は花崗岩のバソリス帯が欠如する.変成岩の源岩にも大きな違いがある(Maruyama et al., 1996; Maruyama,1997). |
図2 太平洋型造山帯のできるメカニズム(Maruyama, 1997). (a)中央海嶺の接近によって,海洋スラブが部分溶融して大量の花崗岩質地殻が成長する.すると,付加体が深部(50-60km)まで引きずり込まれ,BS-EC相の広域変成作用を受け,スラブの低角度化によって,表層に向かって地下10kmまで搾り出され,非火山性外弧が生まれ,前弧盆地が生まれる.(b)中央海嶺が沈み込んだ後で,海溝に大量に堆積した堆積物が10km深度まで上昇し定置した広域変成帯の下部に底付けされ,正断層で囲まれたドーム状の変成帯の隆起が起きる. |
図3 現在進行形の造山運動の場所(Maruyama et al., 2010を部分的に改定).衝突型と太平洋型造山運動(ともに約1億年かかる)の発展を6-7段階に区分して,それぞれの段階が起きている地域を示す. |
|
図24 太平洋型造山運動の新しいモデル.(a)Dewey and Bird(1970)の古典モデルと(b)新しいモデル(Maruyama, 1997を改変).Dewey and Bird(1970)は海洋プレートが沈み込むと時間の経過とともに,巨大なバソリス帯が発達すると考えた.彼らが定義したコルディレラ造山帯(太平洋型)は陸側に成長する巨大な花崗岩帯と海側のオフィオライトを含むメランジュの形成であり,太平洋型造山帯の1つのセット(花崗岩帯,広域変成帯,前弧盆地堆積体の形成,付加体)の短期間の形成(Maruyama, 1997)を指すわけではない.Maruyama(1997)の定義によれば日本列島は5回の太平洋型オロゲンの集積でできたことになる.しかし,各時期の太平洋型造山帯の4つの要素すべてが保存されているのではなく,繰り返して起きた構造侵食によって,古いオロゲンの大部分はマントルに消失した.太平洋型造山運動は若いスラブが沈み込む4000万年間にスラブの溶融によって大陸地殻の急激な成長が起きるとともに高圧変成帯の隆起が起きるが,その後で起きる大規模な構造侵食によって島弧地殻はほぼ消失する.これらの激しい繰り返しによって太平洋型造山運動は成り立ち,結果的に大量のTTGをマントル遷移層へと運び,第2大陸の成長を促す. |
|
丸山ほか(2011)による『太平洋型造山帯―新しい概念の提唱と地球史における時空分布―』から |
沈み込み帯 |
Geometry of a subduction zone - insets to show accretionary prism and partial melting of hydrated asthenosphere Wikipedia(HP/2014/4)による『Subduction』から |
図2 沈み込み帯で提案されている水やマグマの輸送モデル.(a)マントルウェッジ底部からのダイアピル発生のモデル(Tatsumi et al., 1983),(b)スラブ直上の蛇紋岩層(低密度層)のRT不安定とコールドプルームの上昇モデル(明るい部分ほど水を多く含む,Gerya and Yuen, 2003(原図はカラー)),(c)(b)よりさらに深部におけるスラブ直上の含水ウォズリアイト層(低密度層)のRT不安定・ウエットプルームの発生と背弧マグマ活動を説明するモデル(スラブ直上の黒あるいは灰色部分が含水ウォズリアイト層に対応する,Richard and Iwamori, 2010),(d)「割目系の配向」によるメルトの集中的上昇と火山フロント形成のモデル(Furukawa, 1993),(e)温度構造,スラブの脱水反応,溶融を考慮した浸透流モデル(明るい部分ほど水を多く含む,Iwamori, 2007(原図はカラー)). 岩森・中村(2012)による『沈み込み帯での地殻流体の発生と移動のダイナミクス』から |
構造浸食作用 |
図 1 世界の海洋プレート沈み込み帯.△は構造浸食型(非付加型),▲は付加型の海溝を示す.(von Huene and Scholl, 1993; Clift and Vannucchi, 2004; Scholl and von Huene, 2009 をもとに改変). |
図 2 海洋プレート沈み込み帯における大陸地殻の増加および減少プロセスの模式図. |
図 20 構造浸食(非付加) 型および付加型縁辺における特徴的な地質構造とプロセス.(Scholl and von Hune, 2007 の図に加筆修正).非付加型縁辺は,世界の海洋プレート沈み込み帯のうち約 75%を占め,残り25%が付加型である.(a) 構造浸食( 非付加) 型縁辺の特徴は,@構造浸食( 前縁浸食および下底浸食) によって前弧地殻が削られるため,海溝軸は時間とともに陸側へ移動し,かつ前弧地殻は広域的に沈降する,Aそのために,上盤プレートの基盤岩( 多くの場合,島弧地殻・変成岩・オフィオライト・古い時代の付加体など) が海溝に接近し,海溝近傍に付加体が存在しないか,あっても 10 km 程度の小規模な前縁付加体( Frontal prism)しか存在しない(前縁付加体はおもに前弧斜面堆積物の崩壊によるもので,小規模で一時的である),B海溝軸に達した堆積物はほとんどそのまま沈み込む,Cプレート沈み込み角度が変わらない場合,火山フロントも内陸側へ移動する.(b) 付加型縁辺の特徴は,@海溝軸から陸側へ大規模に( 50 km 以上)付加体が発達し,その年代は海側へ向かって若くなる,A付加体の成長に伴って海溝軸は海側へ移動し,前弧斜面は上昇する,B海溝に供給された堆積物は,剥ぎとり付加や底付け付加によって上盤プレートの一部となるが,半分以上の堆積物はそのまま沈み込む,Cもしプレート沈み込み角度が変わらない場合,火山フロントも海側へ移動する. |
図 21 大陸増加および減少に寄与する各プロセスとその推定量.(上: Clift et al., 2009, 下: Stern and Scholl, 2010). |
山本(2010)による『構造浸食作用―太平洋型造山運動論と大陸成長モデルへの新視点―』から |
日本周辺のプレート |
Figure 1. (a) Epicentres for earthquakes with magnitudes equal to or larger than 3.5 (black) and 5.5 (red) and depths shallower than 40 km for the period 1967-2007. Hypocentral information is from the U.S. Geological Survey National Earthquake Information Center files. (b) Plate boundaries and geometries employed for MORVEL. Plate name abbreviations are as follows: AM, Amur; AN, Antarctic; AR, Arabia; AU, Australia; AZ, Azores; BE, Bering; CA, Caribbean; CO, Cocos; CP, Capricorn; CR, Caroline; EU, Eurasia; IN, India; JF, Juan de Fuca; LW, Lwandle; MQ, Macquarie; NA, North America; NB, Nubia; NZ, Nazca; OK, Okhotsk; PA, Pacific; PS, Philippine Sea; RI, Rivera; SA, South America; SC, Scotia; SM, Somalia; SR, Sur; SU, Sundaland; SW, Sandwich; YZ, Yangtze. Blue labels indicate plates not included in MORVEL. Patterned red areas show diffuse plate boundaries. |
Figure 50. Location map, tectonic setting, and GPS station velocities for Amur plate. Inset shows MORVEL estimates for Amur, Yangtze and Sundaland plate motions relative to Eurasia at respective rates of 3.8±1, 12.1±1 and 11.6±1mmyr-1. Map shows Global centroid moment tensor solutions for the period 1976-2008 with centroid depths less than 40 km for locations inland from the Japan and northern Izu-Bonin trenches. Earthquakes are from 1963 to 2008 and have magnitudes greater than 3.5. All velocities on the large map are relative to a fixed Amur plate (see legend). Thin red arrows and dashed ellipses show residual motions and 2-D, 1σ uncertainties for the 20 GPS site velocities used to estimate the Amur plate best-fitting angular velocity (Table 4). Open black arrows (J07) show motions predicted by the Amur-Eurasia angular velocity of Jin et al.(2007). Dark and light blue vectors indicate motions of GPS stations from the Yangtze plate (Shen et al. 2005) and other sites near the Amur plate boundaries (Jin et al. 2007), respectively. Bold red arrows show MORVEL velocities and 2-D, 1σ uncertainties for the Yangtze plate at the southern edge of the Amur plate. Red-white dashed curves and numerals show small circles and rates in mm yr-1 predicted by the MORVEL Amur-Eurasia angular velocity. Open red and green arrows show respective MORVEL and Sella et al. (2002) predictions for Philippine Sea-Amur plate convergence (not drawn to scale). Red and green focal mechanisms are for normal-faulting and strike-slip earthquakes along the Amur-Eurasia plate boundary and blue lines indicate tension axis orientations for selected normal-faulting earthquakes. Panels (A) and (B) show tangential and radial components of the 20 Amur plate station velocities in ITRF2000 relative to motion calculated from their best-fitting angular velocity (red curve) and for comparison, the motions of stations from the Yangtze plate (blue circles). ‘NT’ labels the Nankai Trough. |
DeMets et al.(2010)による『Geologically current plate motions』から |
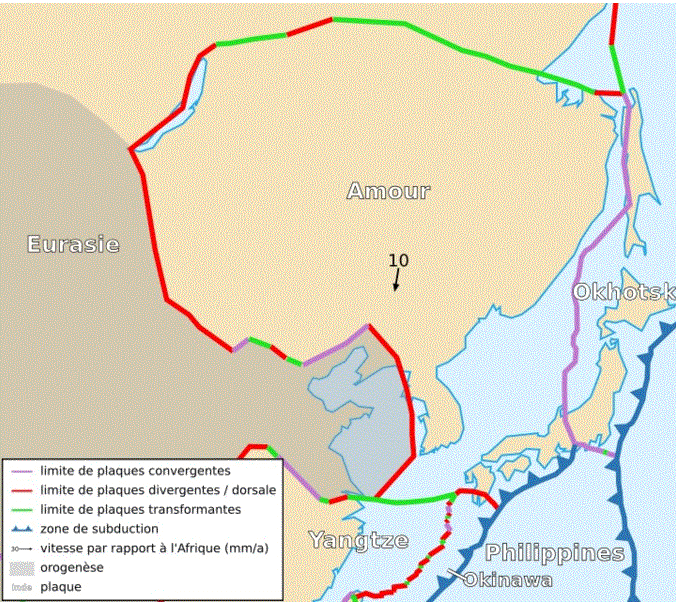
Map of the Amurian Plate and the adjacent tectonic plates (in French) Wikipediaの『Amurian Plate』から |
|
|
|
|
橋本ほか(2009)による『日本列島域の地殻活動予測シミュレーション』から |
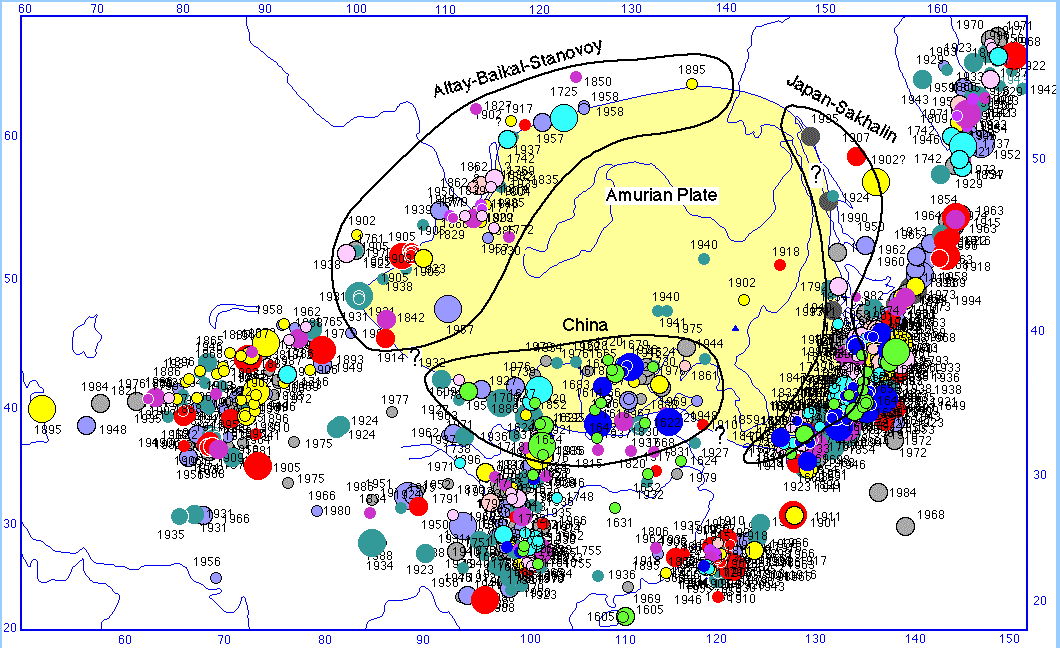
Figure 1. Seismicity of northeast Asia. Hypocenters (solid circles) are sized by magnitude and plotted to a depth of 35 km from the Engdahl et al. [1998] catalog. Focal mechanisms are from Harvard CMT catalog (http://www.seismology.harvard.edu/CMTsearch.html). Plate boundaries (dashed lines) are from this study. |
Figure 2. Combined GPS velocities from continuous, campaign, and published data. 90 of the 123 velocities are shown here in a fixed North American reference frame. The remaining far field sites are outside the range of the figure and can be seen in the auxiliary material. Plate boundaries shown in this figure reflect their geometry and certainty. |
Figure 3. Residual velocities (observed minus predicted) from the 3 and 5-plate models. Residual velocities from the 3-plate model (NAM, EUR, and PAC) are shown in black; residuals from the 5-plate model are shown in white. Residuals are greatly reduced with additional independently rotating Okhotsk and Amurian plates. |
Figure 4. Calculated poles of rotation for the 5-plate model. Rotation rates are in degrees per million years with a positive counterclockwise convention. Error ellipses show 95% confidence limits. Selected slip rates from the 5-plate model are consistent with previous studies. |
Apel et al.(2006)による『Independent active microplate tectonics of northeast Asia from GPS velocities and block modeling』から |
Gaba(2006)による『Tectonic plates boundaries detailed-en.svg』(部分)から |
Figure 1. The 52 plates of model PB2002 are shown with contrasting colors. Two-letter plate identifiers are explained in Table 1. The 13 cross-hatched areas are "orogens" in which an Eulerian plate model is not expected to be accurate. Labels of small plates and orogens are offset (with leader lines) for clarity. Mercator projection. |
Figure 2. Boundaries of the Okhotsk (OK) and Amur (AM) plates. Surrounding plates include Eurasia (EU), North America (NA), Pacific (PA), Philippine Sea (PS), and Yangtze (YA). Boundary types are: CCB continental convergent boundary, CTF continental transform fault, CRB continental rift boundary, OSR oceanic spreading ridge, OTF oceanic transform fault, OCB oceanic convergent boundary, SUB subduction zone. Cross-hatched regions are orogens. Color shows topography from ETOPO5. Solid dots are shallow (< 70 km) hypocenters from ISC catalog, 1964-1991; beachballs are lower-hemisphere projections of douple-couple parts of moment tensors of shallow centroids from Harvard CMT catalog, 1977-1998. White triangles are subaerial Recent volcanoes from Simkin and Siebert [1995]. Black vectors give model velocities (with numbers in mm/a) relative to plate whose identifier is underlined. Black circles are locations of Euler poles, about which the first-named plate rotates counterclockwise relative to the second. Oblique Mercator projection with great circle passing E-W through (135゜E, 48゜N). |
Figure 3. Boundaries (heavy colored lines) of the Yangtze (YA) and Okinawa (ON) plates. Surrounding plates include Sunda (SU), Philippine Sea (PS), and Amur (AM). Conventions as in Figure 2. Additional epicenters in blue (mw > 7, 1900-1976) are from Pacheco and Sykes [1992]. Geodetic velocity of Ishigaki Island from Kato et al. [1998] is plotted relative to YA. Oblique Mercator projection with great circle passing E-W through (127゜E, 27゜N). |
Figure 4. Boundaries (heavy colored lines) of the Sunda (SU) and Burma (BU) plates; surrounding plates include India (IN), Australia (AU), and Yangtze (YA). An orogen and several small plates east of SU are better represented in Figures 5 and 6, respectively. The southeastern prong of Eurasia (EU) is not stable but is part of the Persia-Tibet-Burma orogen. Cross-hatching in southwest shows Ninety East-Sumatra orogen. Conventions as in Figure 2. Transverse Mercator projection on meridian 108゜E. |
Bird(2003)による『An updated digital model of plate boundaries』から |
Figure 1(a) Seismicity in east Asia. Earthquake epicenters are from ISC during the period 1964-1987 (mb>4.2, Depth<60 km). |
Figure 2 Earthquake slip vector directions along the EU-AM, AM-OK, OK-PA, PH-PA, and PH-AM boundaries. These data and the other NUVEL-1 NA-PA and NA-EU data are used to derive the best-fitting Euler vectors of OK-AM-EU-PH-PA-NA 6-plate system. The dashed line is the southern AM-EU boundary (see the text for details). |
Figure 4 Relative velocities predicted by the Euler vectors obtained in this study. Azimuths are indicated by arrows and rates are shown in a unit of milimeters per year. Arrows around the Okhotsk plate indicate the relative motion directions of OK with respect to other plates. Arrows along EU-AM boundary indicate the motions of AM with respect to EU, and arrows along the AM-PH boundary indicate the motions of PH with respect to AM. |
|
Wei,D. and Seno,T.(1998)による『Determination of the Amurian Plate Motion』から |
図1 1498年以来の歴史地震の震央分布(さらに細かな期間別に色分けしてある).○の大きさはマグニチュード.大丸:≧M8,中丸:M7〜8,小丸:M6〜7. 小山(1995)による『歴史記録からみたアムールプレート周縁変動帯における地殻活動の時間変化』から |
アフリカ大地溝帯 |
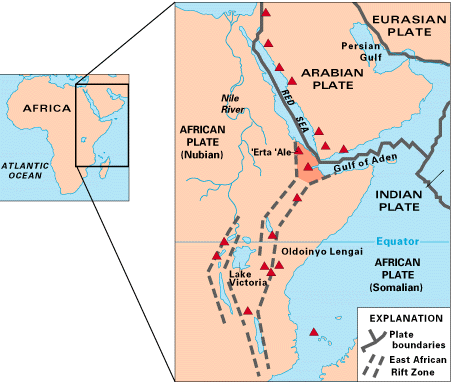
〔W. Jacquelyne Kious and Robert I. TillingによるThis Dynamic Earth: the Story of Plate Tectonicsから〕 東アフリカ・リフト帯(アフリカ大地溝帯)(East African Rift Zone、Great Rift Valley)は大陸分裂の初期過程で生じた沈降陥没帯。 |
LIP(Large Igneous Province:巨大火成岩岩石区) |
Map showing the recognized continental large igneous provinces. Wikipedia(HP/2012/10)による『Large igneous province』から |
Figure 1: Reconstructed large igneous provinces and kimberlites for the past 320 Myr with respect to shear-wave anomalies at the base of the mantle. The deep mantle (2,800 km on the SMEAN tomography model) is dominated by two LLSVPs beneath Africa and the Pacific. The 1% slow contour (approximating to the PGZs) is shown as a thick red line. 80% of all reconstructed kimberlite locations (black dots) of the past 320 Myr erupted near or over the sub-African PGZ. The most ‘anomalous’ kimberlites (17%) are from Canada (white dots). Present-day continents are shown as a background, to illustrate the distribution of hotspots classified as being of deep-plume origin and present-day shear-wave velocity anomalies (percentage δvS), and bear no geographical relationship to reconstructed kimberlites or large igneous provinces. Torsvik et al.(2010)による『Diamonds sampled by plumes from the core-mantle boundary』から |
Sheth(2006)による『“Large Igneous Provinces (LIPs)”: Definition, recommended terminology, and a hierarchical classification』から |
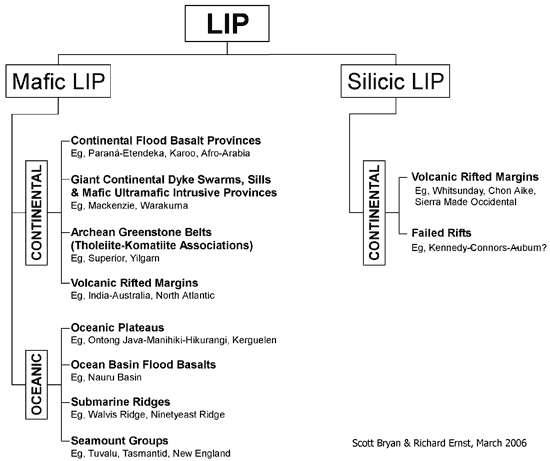
Figure 1. Proposed classification of LIPs, based on the initial work of Coffin & Eldholm (1994), but incorporating recent advances in the recognition of ancient Mafic LIPs and Silicic LIPs. Representative examples of the various types of LIPs are given. Bryan & Ernst(2006)による『Proposed Revision to Large Igneous Province Classification』から |
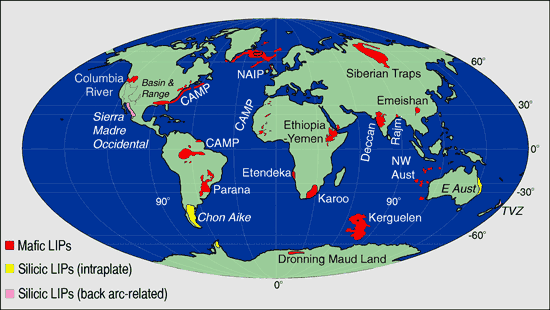
Figure 1. Distribution of Mesozoic-Cenozoic large igneous provinces (LIPs) with silicic LIPs in italics. NAIP, North Atlantic Igneous Province; CAMP, Central Atlantic Magmatic Province; Rajm. Rajmahal basalts; TVZ, Taupo Volcanic Zone; NW Aust, Northwest Australian oceanic plateaux; Cuvier, Roo Rise, Scott, Wallaby and Naturaliste. Figure from Bryan et al. (2002a) and modified from Coffin & Eldholm (1994). 〔Vic Camp氏(Department of Geological Sciences, San Diego State University)によるHow Volcanoes Workの『Silicic LIPs』から〕 |
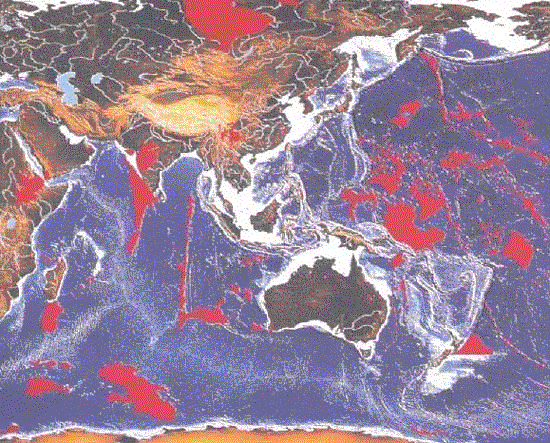
Large Igneous Provinces of the Circum-Pacific region (in red) emplaced since 250 Ma. From cover of Mahoney, J.J. and M.F. Coffin (eds.), Large Igneous Provinces: Continental, oceanic, and planetary flood volcanism. Amer. Geophys. Union Geophys. Mon. 100: 438 p., 1997. |
ホットスポット |
Distribution of selected hotspots. The numbers in the figure are related to the listed hotspots on the below.
ウィキペディア(HP/2012/10)による『ホットスポット (地学)』から |
世界の主なホットスポットの位置 ウィキペディア(HP/2012/10)による『ホットスポット (地学)』から |
マグマ |
沈み込み帯の構造とマグマ生成・上昇 文責 松澤・内田 概要 |
|
地震波トモグラフィで写し出された東北日本下の構造 右図は地震波速度トモグラフィによって得られたS波(横波)速度構造の,鳥海山や栗駒山付近を通る鉛直断面です. 青色は高速(低温,高密度)部,赤・黄色は低速 (高温,低密度)部を表します.○は地震の震源で▲は活火山です. 東北地方の陸域下に沈み込む太平洋プレートの姿が,青色の帯として明瞭に写し出されています. マントルウェッジには,明瞭な低速度域が,沈み込むプレートにほぼ並行に存在しています. この低速度域は,マントル深部からの上昇流に対応し,島弧マグマ活動と密接に関係していると考えられています. 赤丸は,深部マグマ活動に起因する低周波微小地震(非常に卓越周期の長い波形を持つ特殊な地震)です. |
|
マントルウェッジ内の低速度層と地形 上記では東北日本弧を東西に横断する断面を示しましたが, マントルウェッジに存在する低速度域は島弧に沿った方向にも不均質であることが明らかになりました. 右図の左側は,マントルウェッジ内で西に傾いて存在する低速度域の中心に沿って 斜めに切り取った断面での相対的な地震波速度の大きさを示しています.赤三角は第四紀の火山を表します. 右側の図は地形と活断層の位置を示しています. 左側の図の低速度域(赤い部分)と右側の図の標高の高い領域とが空間的によい一致を示すことがわかります. マントルウェッジ内の低速度域と地表の火山分布や標高分布が対応するということは, マントルウェッジ内の高温の上昇流が島弧火山の形成に重要な役割を果たしていることを示唆しています. |
|
東北日本弧におけるマグマ生成・上昇モデル 上記の解析結果から構築された東北日本弧におけるマグマ生成・上昇モデルの概念図を右図に示します. マントルウェッジ内には高温の上昇流が存在し,それは島弧に沿った方向に連続的に分布しています. 上昇流内にはマグマが生成されますが, その一部は上昇流から分離して上昇し,背弧側の火山を形成します. 一方,上昇流とともにモホ面直下まで斜めに上昇してきた大部分のマグマは,地殻内にまで至り, 脊梁山脈に沿った火山列を形成します. |
|
東北大学大学院理学研究科附属地震・噴火予知研究観測センター地震予知観測研究部(HP/2014/4)による『沈み込み帯の構造とマグマ生成・上昇』から |
|
|
|
|
臨界曲線。緑と青は東北日本弧と西南日本弧の火山フロント(海溝に一番近いところで火山ができる場所。多くの沈み込み帯で、海洋プレートの深度が100km 前後の直上にあり、そこで最大量のマグマが噴出する。火山フロントが一定の深さにあることを理解することは重要である。)直下のマントルウェッジとの温度と圧力の関係(1)。赤はマントルの水に飽和した融解開始温度。図中のマークは臨界終端点で、黒い破線は臨界温度をつないだ曲線(2)。臨界終端点圧力は岩石のシリカ量に逆相関し堆積岩<高マグネシウム安山岩<玄武岩<カンラン岩の順に高くなる。 |
|
1. S. M. Peacock, K. Wang Science 286, 937(1999) 川本ほか(2013)による『沈み込む海洋プレートから超臨界流体が上昇してマグマを作る』から |
図1 日本のマグマの種類と性質 マグマに含まれるシリカが多いほど、その粘り気も増大します。 |
図2 日本のマグマの作られ方 |
図3 地殻内を移動しながらさまざまに変身するマグマ |
図4 マグマ中の水の溶解度と気泡 |
|
Fig.a4 A plausible cross-section of a subduction zone (Tatsumi et al., 1986). The dotted area indicates the mantle peridotite polluted by the slab-derived fluid phase, the “island-arc basalt source”. The polluted peridotites are transported by the convective current represented by arrows. The aseismic fronf (AF) corresponds to the trenchward limit of convective current. Voluminous felsic rocks distributed mainly along the volcanic front (VF) are formed by partial melting of the lowermost crust. Diapirs raise through the region with temperatures higher than 1400℃, and stop to release primary magmas at levels shown on the figure. 巽(1986)による『沈み込み帯マグマの成因』から |