/Image2663.gif) 図4: 固体地球科学で誕生した重要な理論と学説の歴史(吉田, 2015, 未公表)。灰色で示した年代パラダイムシフトが起こった年代。グローバル地震波トモグラフィーは学説ではなく解析手法の名前であるので、色を薄くして示してる。 吉田(HP/2015/12)による『「大陸とプレートを動かす力とは何か」 特設ページ』から |
|
|
最終更新日:2017年2月16日
ドイツの気象学者のアルフレッド・ウェゲナー(A.Wegener、1880-1930)は、1910年代に大陸移動説(Continental Drift)を提唱して、『大陸および海洋の起源』(The
Origin of Continents and Oceans)という書を著した。彼は、①地殻表面の頻度曲線が2つのピークを示すため、陸と海は異なる物質からなり、高度も元々違っていたこと;②アイソスタシー(Isostasy)の原理から、地殻は水平方向にも動くことができること;③大西洋を挟む大陸間で、地質構造などが連続すること;④海を渡れない生物が、現在は海で隔てられた諸大陸に化石として分布すること;⑤南半球の大陸およびインドなどにペルム紀〜石炭紀(約3億年前)の氷河堆積物が存在すること、などから大陸はかって1つの超大陸〔Supercontinent:彼はパンゲア(Pangaea)と命名した〕を形成していたことを理論化して示した。1920年代には、賛否両論の大論争となった。氷河(Glacier)の分布や造山(Orogeny)運動の成因(山脈のでき方)などを明確に説明することができたが、大陸移動の原動力(Driving
Force)については説明できなかった(彼は、離極力と潮汐力を挙げたが、これらの力で大陸が動くことは信じられなかった)。やがて1930年代になって論争は大陸移動説の敗北で終止符を打つ。その敗因は、主に①ウェゲナー自身の死(グリーンランドでの気象観測中の事故死と言われる);②原動力に対する説明に欠けること;③地球は固いという当時の地球観に反したこと、などである。アーサー・ホームズ(A.Holmes)によるマントル対流説(Mantle
Convection)も提唱されていたが、大陸移動説とは結び付けられなかった。
1939〜1945年に第二次世界大戦が起こり、軍事関連以外のあらゆる学問分野の研究は一時停止した。従って、地球科学分野の研究が本格的に再開されたのも1950年代になってからである。戦争中に、軍事目的として潜水艦の航行上の必要性から、世界の海洋の海底地形測量が行われていたが、戦後は、海洋学(Oceanography)全般の研究が大きく進展した。海底地形測量の他に海底堆積物や基盤岩についての研究も行われたが、特にそこに記録された地磁気の結果は特筆すべきものであった。つまり、海底地磁気には縞模様が見られ、これは過去の地球磁場が繰り返して反転してきたことを示すことが判った。過去の地磁気についての学問は古地磁気学(Paleomagnetism)というが、古地磁気学の進歩は著しかった。岩石残留磁気と生成年代(放射年代法による)から、過去の地球磁場を復元できる。この方法は陸上についても適用され、過去の地球の極移動の復元などが行われた。これらの復元において、過去に大陸が移動したことや海底が拡大したことを仮定しなければ説明できないことが判明した。海底地形の研究の進歩から、その凸地形である海嶺や、凹地形である海溝などは知られていたが、これらの成因も関連付けて説明されることになった。
やがて、1960年代には、かって葬り去られた大陸移動説は、海洋底拡大説(Seafloor
Spreading)として生まれ代わることになる。これによって、海洋底が若いことや、海嶺と海溝の成因や、大陸の成長などが説明できるようになった。さらに、球体である地球の表層に存在するプレートは球殻状であるが、その動きを幾何学的に説明するモデル〔オイラー(Euler)の原理による〕も提出され、現実のプレートの運動を説明できることが明らかになった。そして、1968年頃に、プレートテクトニクス(Plate Tectonics)という名称が世界的に使用されるようになった。これは、硬いプレート(大きいもので10数枚:厚さは100〜150キロメートル程度)が水平運動を行い、その弱部であるプレート境界において地下からの熱や物質が引き起こす地質現象を主に説明するモデルであり、大陸移動説−海洋底拡大説の後継モデルとして完成されたものである。特に地震と火山活動の成因を説明できることが重要である。日本では、1980年代頃に研究者によって使われ出した。プレートテクトニクスは現在の地球科学分野における最大のモデルである。
/Image2663.gif) 図4: 固体地球科学で誕生した重要な理論と学説の歴史(吉田, 2015, 未公表)。灰色で示した年代パラダイムシフトが起こった年代。グローバル地震波トモグラフィーは学説ではなく解析手法の名前であるので、色を薄くして示してる。 吉田(HP/2015/12)による『「大陸とプレートを動かす力とは何か」 特設ページ』から |
/Image2712.gif) Fig. 1. Global gravity anomalies from satellite altimetry (Sandwell and Smith 2009). Red lines denote present day plate boundaries from the plate boundary set presented in this study. AFR=Africa, ANT=Antarctica, ARA=Arabia, AUS=Australia, C=Cocos, CAP=Capricorn, CAR=Caribbean, EUR=Eurasia, IND=India, NAM=North America, NAZ= Nazca, PAC= Pacific, PH= Philippine, SAM= South America, SOM= Somalia. |
/Image2701.gif) Fig. 18. Global plate reconstructions from 200 Ma to the present day in 20 million year time intervals. Basemap shows the age-area distribution of oceanic lithosphere at the time of formation. Red lines denote subduction zones, black lines denote mid-ocean ridges and transform faults. Brown polygons indicate products of plume-related excessive volcanism. Yellow stars are present day hotspot locations. Absolute plate velocity vectors are denoted as black arrows. Abbreviations for the plates are the same as in previous figures. Additional abbreviations include: ALA = Alaska, CA = Central Atlantic, CAP = Capricorn, CAR = Caribbean, CAT = Catequil, CCO = Cache Creek Ocean, COL = Colorado, CS = Caroline Sea, JUN = Junction, MOO = Mongol.Okhotsk Ocean, NL = North Loyalty Basin, NMT = North Meso-Tethys, NNT = North Neo-Tethys, PAR = Parana, PAT = Patagonia, PS = Philippine Sea, PSC = Proto-South China Sea, SCO = Scotia Sea, SLB = South Loyalty Basin, SMT = South Meso-Tethys, TS = Tasman Sea. |
/Image2702.gif) Fig. 19. Description same as Fig. 18. |
/Image2703.gif) Fig. 20. Description same as Fig. 18. |
/Image2704.gif) Fig.
21. Description same as Fig. 18. Fig.
21. Description same as Fig. 18. |
/Image2705.gif) Fig. 22. Description same as Fig. 18. |
/Image2706.gif) Fig. 23. Description same as Fig. 18. |
/Image2707.gif) Fig. 24. Description same as Fig. 18. |
/Image2708.gif) Fig. 25. Description same as Fig. 18. |
/Image2709.gif) Fig. 26. Description same as Fig. 18. |
/Image2710.gif) Fig. 27. Description same as Fig. 18. |
/Image2711.gif) Fig. 28. Description same as Fig. 18. |
| Senton,M. et al.(2012)による『Global continental and ocean basin reconstructions since 200 Ma』から | |
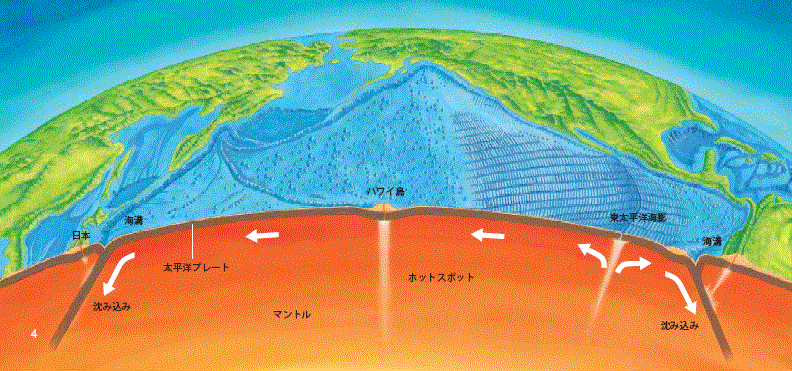 プレート運動 〔文部科学省地震調査研究推進本部の『地震の基礎知識』の中の『地震発生のメカニズムを探る』から〕 |
/Image27.gif) Gaba(2006)による『Tectonic plates boundaries detailed-en.svg』から |
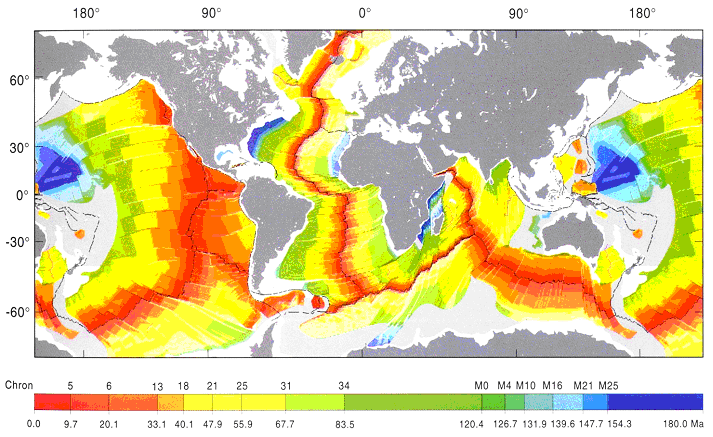 Globale Altersverteilung des Meeresbodens (Mussett und Khan 2000) 〔University of BremenのPetrology of the Oceanic Crustの中の『Vorlesung "Geochemie und Plattentektonik I" (A. Klugel): Abbildungen und erganzendes Material』から〕 |
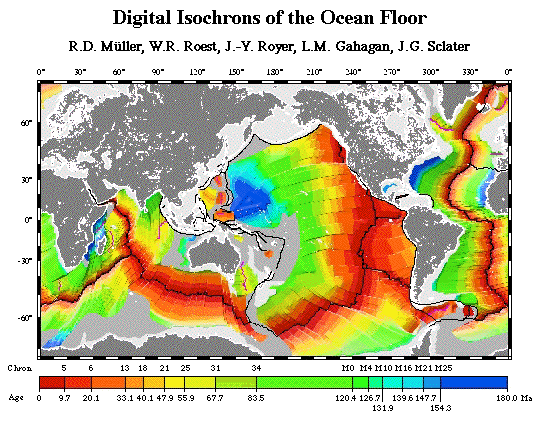 〔John C. Lahr氏によるHow to Build a Model Illustrating Sea-Floor Spreading and Subductionから〕 海洋底の生成年代。時代が若い海底は海嶺側に分布する。海洋地殻は海嶺で誕生し、海溝(沈み込み帯)でマントルへ沈み込んでいく、ことで説明される。 |
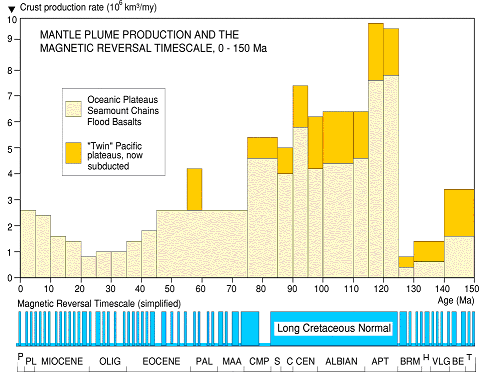 〔J. TARNEY氏によるPlate Tectonics: Geological Aspectsから〕 |
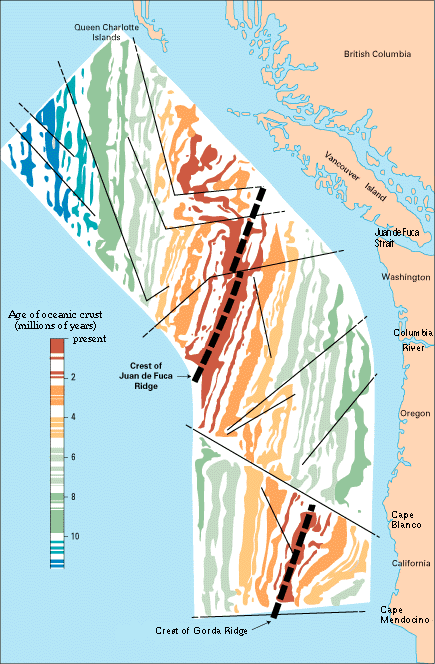 The center part of the figure -- representing the deep ocean floor with the sea magically removed -- shows the magnetic striping (see text) mapped by oceanographic surveys offshore of the Pacific Northwest. Thin black lines show transform faults (discussed later) that offset the striping. 〔W. Jacquelyne Kious and Robert I. TillingによるThis Dynamic Earth: the Story of Plate Tectonicsから〕 |
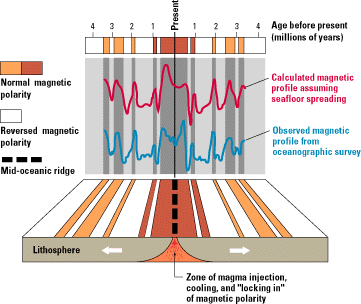 An observed magnetic profile (blue) for the ocean floor across the East Pacific Rise is matched quite well by a calculated profile (red) based on the Earth's magnetic reversals for the past 4 million years and an assumed constant rate of movement of ocean floor away from a hypothetical spreading center (bottom). The remarkable similarity of these two profiles provided one of the clinching arguments in support of the seafloor spreading hypothesis. 〔W. Jacquelyne Kious and Robert I. TillingによるThis Dynamic Earth: the Story of Plate Tectonicsから〕 |
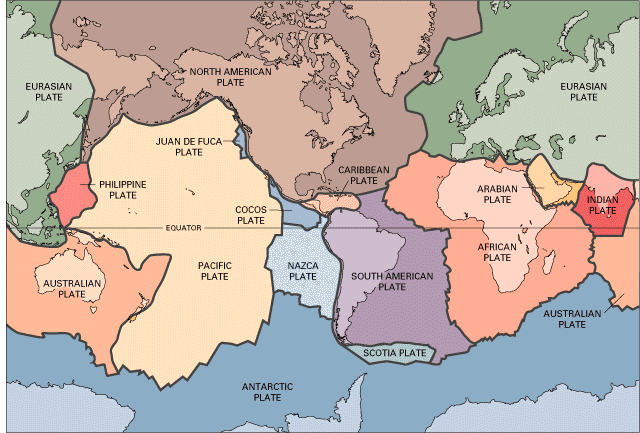 〔W. Jacquelyne Kious and Robert I. TillingによるThis Dynamic Earth: the Story of Plate Tectonicsから〕 15枚のプレート。プレートテクトニクスは、これらのプレートが水平運動を行うことによって起こる地質現象を説明するモデルである。地球内部の熱と物質は、とくにプレートの境界部に沿って地表へ流出するため、火山活動や地震の発生もこれらの境界部に多い。 |
|
|
(km2) |
|
| 1 | Pacific(太平洋プレート) | 103,280,000 |
| 2 | North American(北アメリカプレート) | 75,888,000 |
| 3 | Eurasian(ユーラシアプレート) | 67,811,000 |
| 4 | African(アフリカプレート) | 61,334,000 |
| 5 | Antarctic(南極プレート) | 60,916,000 |
| Indo-Australian(インド・オーストラリアプレート) | ||
| 6 | Australian | 47,152,000 |
| 7 | South American(南アメリカプレート) | 43,617,000 |
| 8 | Somali | 16,667,000 |
| 9 | Nazca(ナスカプレート) | 15,630,000 |
| 10 | Indian(インドプレート) | 11,920,000 |
| 11 | Philippine(フィリピン海プレート) | 5,447,000 |
| 12 | Arabian(アラビアプレート) | 5,010,900 |
| 13 | Caribbean(カリブプレート) | 3,319,000 |
| 14 | Cocos(ココスプレート) | 2,860,000 |
| 15 | Caroline microplate(カロライナプレート) | 1,720,000 |
|
|
Scotia |
1,651,000 |
|
|
Fiji microplates | 1,144,000 |
| 18 | Burma microplate(ビルマプレート) | 1,110,000 |
| 19 | Tonga microplate(トンガプレート) | 962,000 |
| 20 | Mariana microplate | 364,000 |
|
|
Bismark microplate(North Bismarck/South Bismarck)(北ビスマルクプレート/南ビスマルクプレート) |
286,000 |
| 22 | Solomon microplate(ソロモン海プレート) | 254,000 |
| 23 | Juan de Fuca(ファンデフカプレート) | 252,000 |
| 24 | South Sandwich microplate | 166,000 |
| 25 | Easter microplate(イースタープレート) | 133,000 |
| 26 | Juan Fernandez microplate | 96,000 |
| 27 | Rivera microplate | 73,000 |
| 28 | Gorda microplate | 69,600 |
| 29 | Explorer microplate | 18,400 |
| 30 | Galapagos microplate | 12,000 |
|
W. K. Brown・K. H. Wohletzの両氏によるSFT
and the Earth's Tectonic Platesから。 リンクはフリー百科事典『ウィキペディア(Wikipedia)』。 |
||
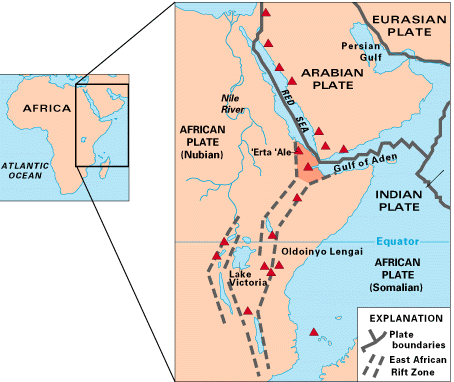 〔W. Jacquelyne Kious and Robert I. TillingによるThis Dynamic Earth: the Story of Plate Tectonicsから〕 |
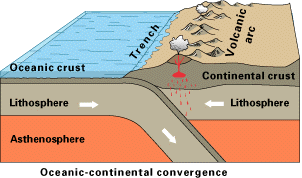 |
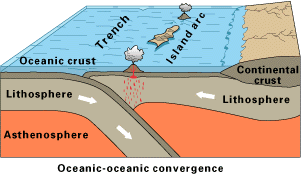 |
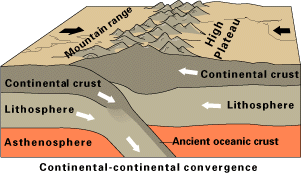 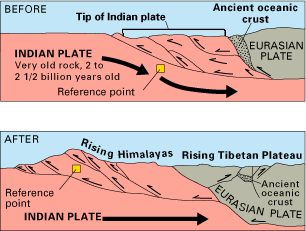 Cartoon cross sections showing the meeting of these two plates before and after their collision. The reference points (small squares) show the amount of uplift of an imaginary point in the Earth's crust during this mountain-building process. |
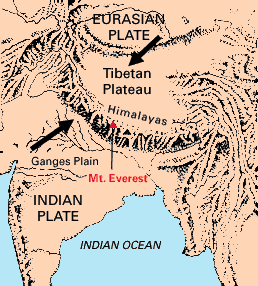 The collision between the Indian and Eurasian plates has pushed up the Himalayas and the Tibetan Plateau. 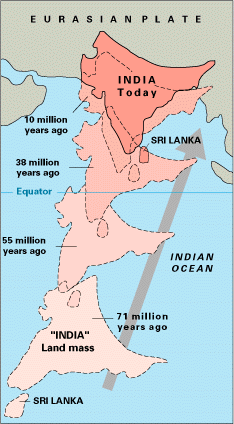 The 6,000-km-plus journey of the India landmass (Indian Plate) before its collision with Asia (Eurasian Plate) about 40 to 50 million years ago (see text). India was once situated well south of the Equator, near the continent of Australia. |
|
〔W. Jacquelyne Kious and Robert I. TillingによるThis Dynamic Earth: the Story of Plate Tectonicsから〕 ヒマラヤ山脈(Himalayas)は、インド・オーストラリアプレート(Indo-Australian Plate)とユーラシアプレート(Eurasian Plate)の2つの大陸プレートの衝突によって、それらの間の海底堆積物などが隆起して形成された。主要部の形成時期は約5000万年前頃からである。これは、造山運動(Orogeny)の典型例であり、同様のメカニズムでアルプス山脈(Alps)なども形成された。 |
|
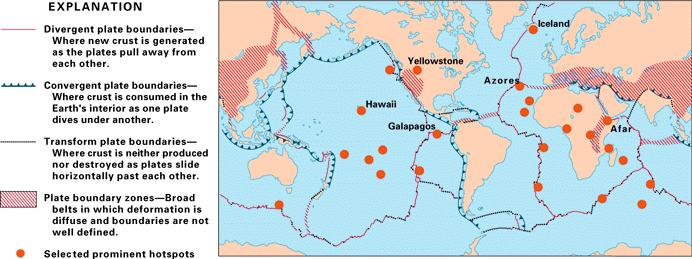 World map showing the locations of selected prominent hotspots; those labelled are mentioned in the text. (Modified from the map This Dynamic Planet.) 〔W. Jacquelyne Kious and Robert I. TillingによるThis Dynamic Earth: the Story of Plate Tectonicsから〕 |
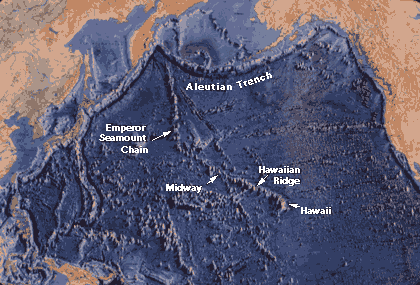 Map of part of the Pacific basin showing the volcanic trail of the Hawaiian hotspot-- 6,000-km-long Hawaiian Ridge-Emperor Seamounts chain. (Base map reprinted by permission from World Ocean Floor by Bruce C. Heezen and Marie Tharp, Copyright 1977.) 〔W. Jacquelyne Kious and Robert I. TillingによるThis Dynamic Earth: the Story of Plate Tectonicsから〕 |
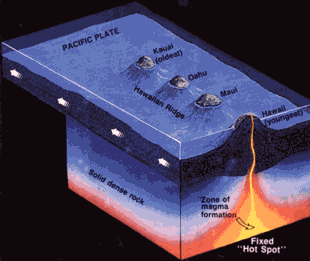 Artist's conception of the movement of the Pacific Plate over the fixed Hawaiian "Hot Spot," illustrating the formation of the Hawaiian Ridge-Emperor Seamount Chain. (Modified from a drawing provided by Maurice Krafft, Centre de Volcanologie, France). 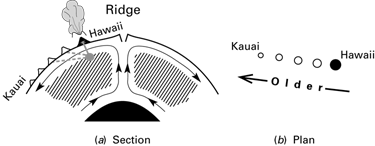 J. Tuzo Wilson's original diagram (slightly modified), published in 1963, to show his proposed origin of the Hawaiian Islands. (Reproduced with permission of the Canadian Journal of Physics.) |
| 〔W. Jacquelyne Kious and Robert I. TillingによるThis Dynamic Earth: the Story of Plate Tectonicsから〕 | |
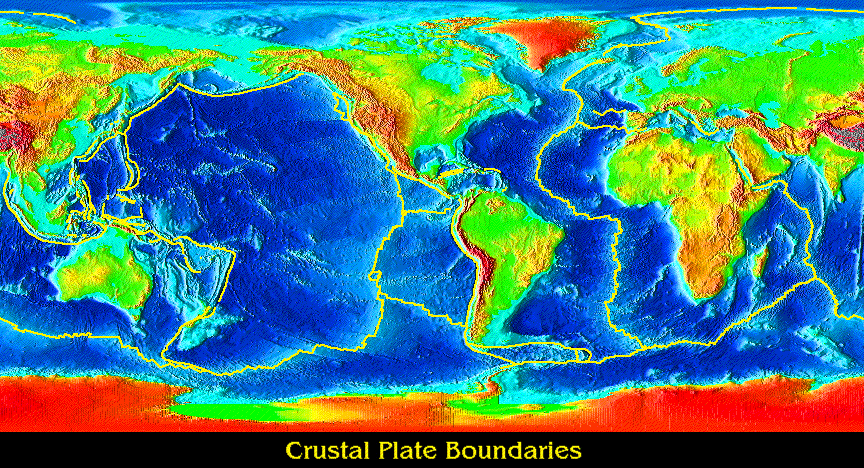 〔Rosanna L. Hamilton氏によるEarth's Interior & Plate Tectonicsから〕 黄色線はプレート境界を示す。 |