戻る<1|2|3|4|5|6|7|8|9|10|11|12|13|14|15<
|
配付プリント等 |
補足説明 |
般 |
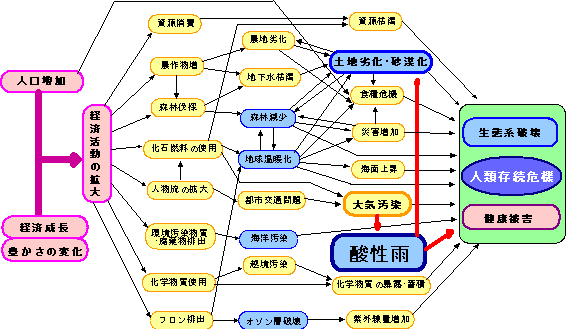
地球環境問題には、下の図のように様々な問題があります。地球環境問題は被害や影響が発生原因国のみならず、国境を越えて、地球規模にまで広がるという面と、問題の解決のために国際的な取り組みが必要とされるという面を持っています。 先進国と呼ばれる国では、大量にものを生産し、大量に消費し、大量に棄てています。ものをつくる時にも、使う時にも、棄てる時にも大量の資源・エネルギーが必要です。このことが、酸性雨や地球温暖化をはじめとするいろいろな地球環境問題を進行させています。 〔(財)日本環境衛生センターの酸性雨研究センターの中の『eコース 酸性雨と環境』から〕 |
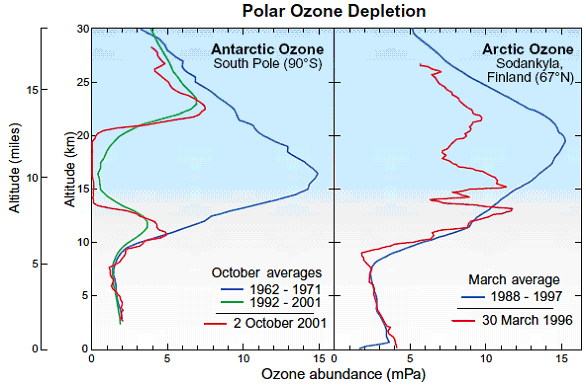
Figure Q11-2. Arctic and Antarctic ozone distribution. The stratospheric ozone layer resides between about 10 and 50 kilometers (6 to 31 miles) above Earth’s surface over the globe. Long-term observations of the ozone layer from small balloons allow the winter Antarctic and Arctic regions to be compared. In the Antarctic at the South Pole, halogen gases have destroyed ozone in the ozone layer beginning in the 1980s. Before that period, the ozone layer was clearly present as shown here using average ozone values from balloon observations made between 1962 and 1971. In more recent years, as shown here for 2 October 2001, ozone is destroyed completely between 14 and 20 kilometers (8 to 12 miles) in the Antarctic in spring. Average October values in the ozone layer now are reduced by 90% from pre-1980 values. The Arctic ozone layer is still present in spring as shown by the average March profile obtained over Finland between 1988 and 1997. However, March Arctic ozone values in some years are often below normal average values as shown here for 30 March 1996. In such years, winter minimum temperatures are generally below PSC formation temperatures for long periods. (Ozone abundances are shown here with the unit “milli-Pascals” (mPa), which is a measure of absolute pressure (100 million mPa = atmospheric sea-level pressure).) 〔NOAA Aeronomy Laboratoryの『International Ozone-Layer Assessments』の『WMO/UNEP Scientific Assessment of Ozone Depletion: 2002』の『Twenty Questions and Answers About the Ozone Layer』の『III STRATOSPHERIC OZONE DEPLETION』の中の『Q11: How severe is the depletion of the Antarctic ozone layer?』から〕 南極と北極上空のオゾン層が破壊されていることを示す観測データ。フロンが犯人であるが、両極とくに南極で破壊が著しいのは極域成層圏雲が重要な役割をしていると考えられている。 |
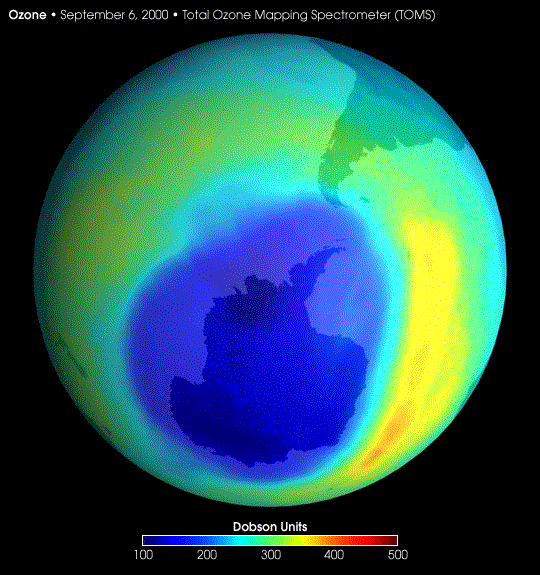
〔NASA earth observatoryの『News』の『New Images』の中の『Largest-ever Ozone Hole over Antarctica』から〕 南極大陸上空のオゾンホール(青色部)。過去最大のときのもの。 |
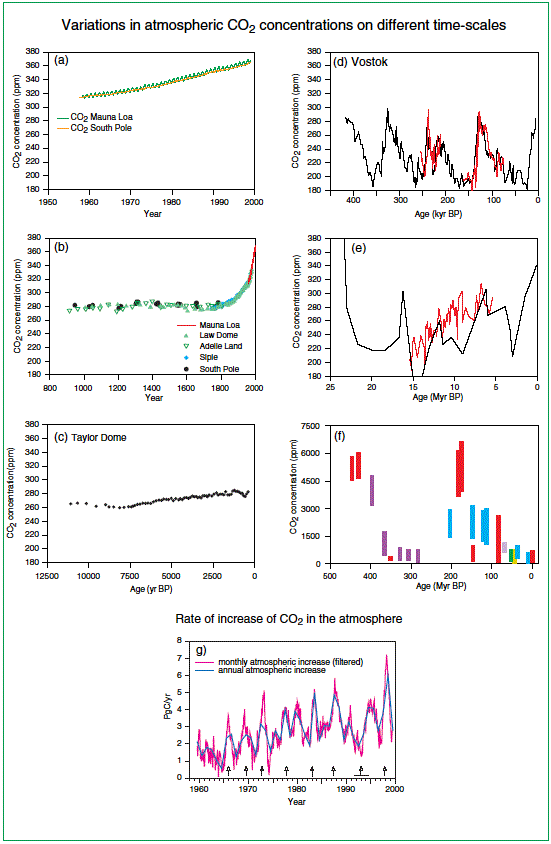
Figure 10: Variations in atmospheric CO2 concentration on different time-scales. (a) Direct measurements of atmospheric CO2. (b) CO2 concentration in Antarctic ice cores for the past millenium. Recent atmospheric measurements (Mauna Loa) are shown for comparison. (c) CO2 concentration in the Taylor Dome Antarctic ice core. (d) CO2 concentration in the Vostok Antarctic ice core. (Different colours represent results from different studies.) (e to f) Geochemically inferred CO2 concentrations. (Coloured bars and lines represent different published studies) (g) Annual atmospheric increases in CO2. Monthly atmospheric increases have been filtered to remove the seasonal cycle. Vertical arrows denote El Nino events. A horizontal line defines the extended El Nino of 1991 to 1994. [Based on Figures 3.2 and 3.3] 〔Intergovernmental Panel on Climate Change (IPCC) による『Climate Change 2001: Synthesis Report』の『WG I - Technical Summary』の中の『Variations in atmospheric CO2 concentrations on different time-scales』から〕 IPCCによる過去のさまざまな時間スケールでの大気中二酸化炭素濃度の変動。 |
参考 |
(定義) 第二条 この法律において「環境への負荷」とは、人の活動により環境に加えられる影響であって、環境の保全上の支障の原因となるおそれのあるものをいう。 2 この法律において「地球環境保全」とは、人の活動による地球全体の温暖化又はオゾン層の破壊の進行、海洋の汚染、野生生物の種の減少その他の地球の全体又はその広範な部分の環境に影響を及ぼす事態に係る環境の保全であって、人類の福祉に貢献するとともに国民の健康で文化的な生活の確保に寄与するものをいう。 3 この法律において「公害」とは、環境の保全上の支障のうち、事業活動その他の人の活動に伴って生ずる相当範囲にわたる大気の汚染、水質の汚濁(水質以外の水の状態又は水底の底質が悪化することを含む。第十六条第一項を除き、以下同じ。)、土壌の汚染、騒音、振動、地盤の沈下(鉱物の掘採のための土地の掘削によるものを除く。以下同じ。)及び悪臭によって、人の健康又は生活環境(人の生活に密接な関係のある財産並びに人の生活に密接な関係のある動植物及びその生育環境を含む。以下同じ。)に係る被害が生ずることをいう。 (Terminology) Article 2 1 For the purpose of this law, "environmental load" means any adverse effects on the environment generated by human activities which may cause interference with environmental conservation. 2 For the purpose of this law, "global environmental conservation" means environmental conservation regarding such phenomena as global warming, the ozone layer depletion, marine pollution, decrease in wildlife species and others which are caused by human activities and affect the environment of the entire globe or a large part of it, which contributes to the welfare of mankind as well as to the healthy and cultured living of the people. 3 For the purpose of this law, "environmental pollution" ("Kogai" in Japanese) means, among interference with environmental conservation, air pollution, water pollution (including a deterioration of water's unadulterated state other than the water quality and the quality of the bottom. The same shall apply hereinafter except for Article 16 Paragraph 1.), soil contermination, noise, vibration, ground subsidence (excluding subsidence caused from land excavation for mineral exploitation. The same shall apply hereinafter.) and offensive odors affecting an extensive area as a result of business and other human activities, which cause damage to human health or the living environment (icluding property closely related to human life, as well as fauna and flora closely related to human life and their living environment. The same shall apply hereinafter.) |
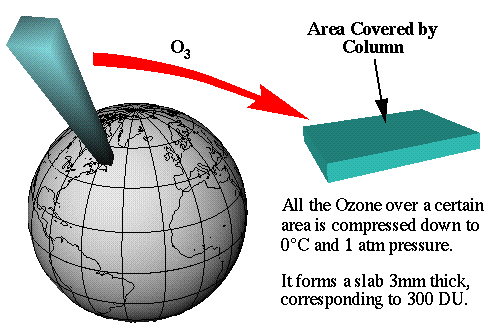
〔Centre for Atmospheric Science(Cambridge University, UK)によるThe Ozone Hole Tourの中の『Dobson Unit - Definition』から〕 ドブソン単位は、ある場所の上空に存在するオゾンを0℃および1気圧の条件になるように圧縮した場合、その厚さが0.01mmであれば1DUと定義される。平均的には3mmで、300DUである。 |
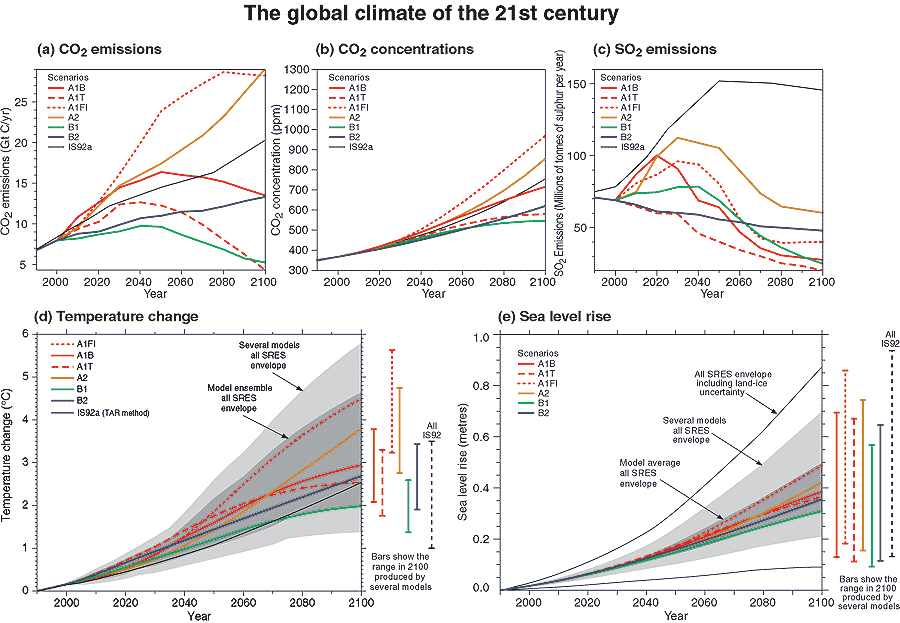
【2100年までの気温と海面水位の上昇予測(IPCCによる)】
Figure 5: The global climate of the 21st century will depend on natural changes and the response of the climate system to human activities. Climate models project the response of many climate variables ? such as increases in global surface temperature and sea level ? to various scenarios of greenhouse gas and other human-related emissions. (a) shows the CO2 emissions of the six illustrative SRES scenarios, which are summarised in the box on page 18, along with IS92a for comparison purposes with the SAR. (b) shows projected CO2 concentrations. (c) shows anthropogenic SO2 emissions. Emissions of other gases and other aerosols were included in the model but are not shown in the figure. (d) and (e) show the projected temperature and sea level responses, respectively. The “several models all SRES envelope” in (d) and (e) shows the temperature and sea level rise, respectively, for the simple model when tuned to a number of complex models with a range of climate sensitivities. All SRES envelopes refer to the full range of 35 SRES scenarios. The “model average all SRES envelope” shows the average from these models for the range of scenarios. Note that the warming and sea level rise from these emissions would continue well beyond 2100. Also note that this range does not allow for uncertainty relating to ice dynamical changes in the West Antarctic ice sheet, nor does it account for uncertainties in projecting non-sulphate aerosols and greenhouse gas concentrations. 〔IPCCによるClimate Change 2001:Working Group I: The Scientific Basisの『Appendix VIII - Figures and Tables in this Report』から〕 IPCCによる2100年までの気温と海面水位の上昇予測。 |
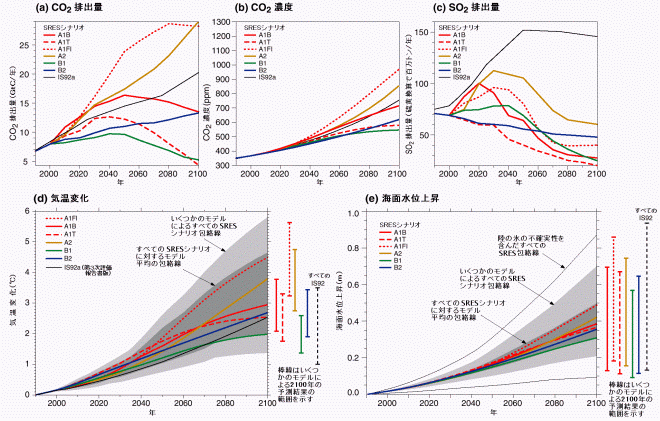
図SPM-5:21世紀の地球の気候は,自然の変化と気候システムの人間活動に対する応答で決まることになる。気候モデルは,温室効果ガスやその他の人間活動に関係する排出の種々のシナリオに対する多くの気候変数の応答−地球の地上気温や海面水位の上昇−を予測する。(a)には,六つのSRESシナリオ(ボックス参照)を、第二次評価報告書と比較するためにIS92aとともに,二酸化炭素の排出量を示している。(b)は,二酸化炭素濃度の予測を示す。(c)は,人為起源の二酸化硫黄の排出量を示す。その他のガス及びその他のエーロゾルの排出量も気候モデルに含まれているが,図には示してない。(d)と(e)は,それぞれ,気温上昇と海面水位上昇の予測を示す。(d)と(e)の「いくつかのモデルによるすべてのSRESシナリオ包絡線」は,ある範囲の気候感度を持つ多数の複雑な気候モデルで調整した簡便な気候モデルによる気温と海面水位上昇をそれぞれ示す。「すべてのSRES包絡線」は,全35個のSRESシナリオによる範囲を表している。「すべてのSRESシナリオに対するモデル平均の包絡線」は,シナリオの範囲に対するモデルの平均を表している。これらの排出による気温上昇と海面水位上昇の双方とも2100年のずっと先まで続くことに注意されたい。また,ここで示した範囲は,西部南極氷床の氷の力学的変化に関係した不確実性は考慮していないこと,また,硫酸エーロゾル以外のエーロゾルや温室効果ガスの濃度の予測の不確実性も考慮していないことにも注意されたい。 [(a)は第3章図3.12,(b)は第3章図3.12,(c)は第5章図5.13,(d)は第9章図9.14,(e)は第11章図11.12,付録2に基づく] 上の図の日本語訳。 |