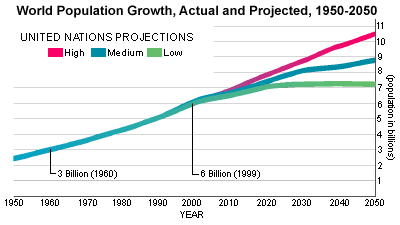
 〔国連のUNFPAによるDay of 6 Billionの『FAST FACTS』のページから。〕 世界人口の推移と2050年までの予測。 |
戻る<1|2|3|4|5|6|7|8|9|10|11|12|13|14|15<
|
|
| 配付プリント等 |
| 補足説明 |
|
般 |
 〔国連のUNFPAによるDay of 6 Billionの『FAST FACTS』のページから。〕 世界人口の推移と2050年までの予測。 |
|
我が国の総人口の見通し 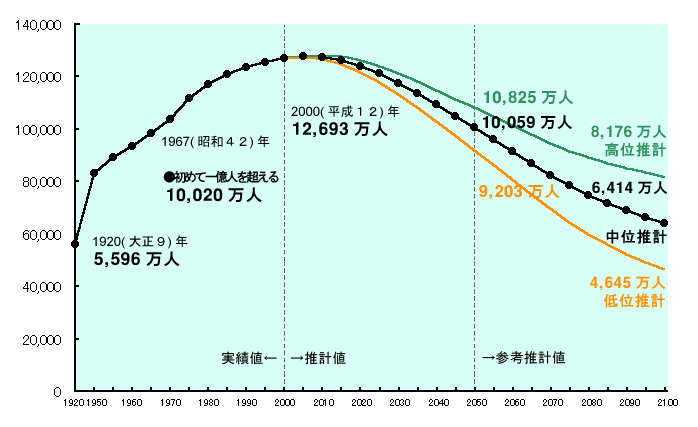 資料:「日本の将来推計人口(平成14年1月推計)」国立社会保障・人口問題研究所 〔国立社会保障・人口問題研究所の『少子化情報ホームページ』の中の『我が国の総人口の見通し』のページから。〕 |
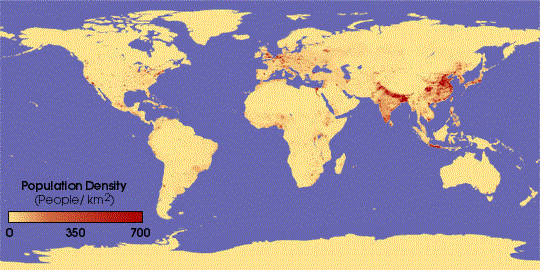 〔NASAによるVisible Earthの『Human Dimensions』の中から〕 人口密度。 |
 Global Ambient Population, 2003 〔Oak Ridge National Laboratoryによる『LandScan』の『LandScan 2003』から〕⇒『LandScan 2005』 人口密度。 |
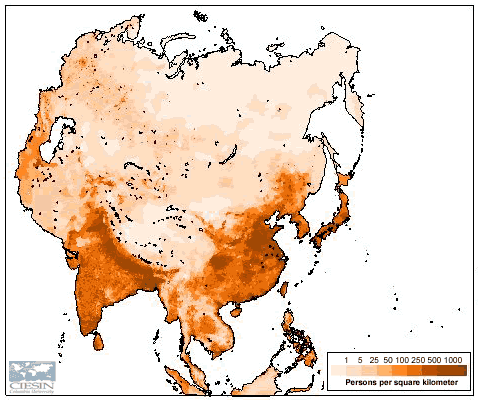 Asia Population Density, 1995 UN adjusted data {Lambert Azimuthal Projection} 〔The Trustees of Columbia University in the City of New YorkによるGridded Population of the Worldから〕 アジアの人口密度。 |
| 参考 |
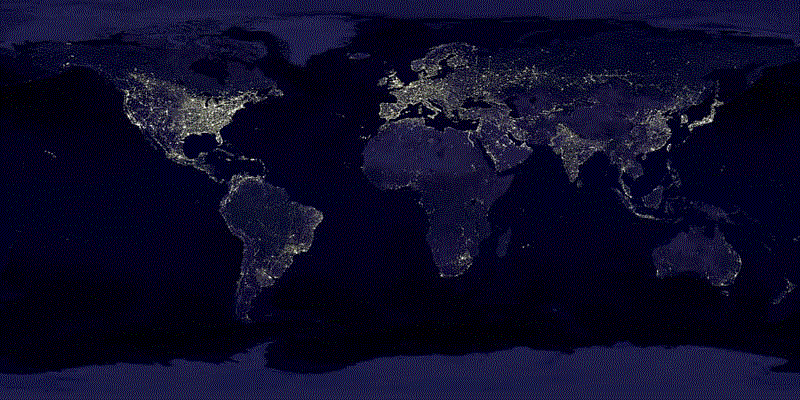 Global Earth Lights 〔Calvin J. Hamilton氏によるViews of the Solar Systemの『Earth Introduction』の中の『Earth Lights』から〕 夜の地球。これらの灯りには、森林火災やイカ釣り船の照明なども含まれる。 |
 〔E-Square Inc.によるRSBSの中の『サステナビリティの科学的基礎に関する調査』の『サマリーレポート』から〕
|
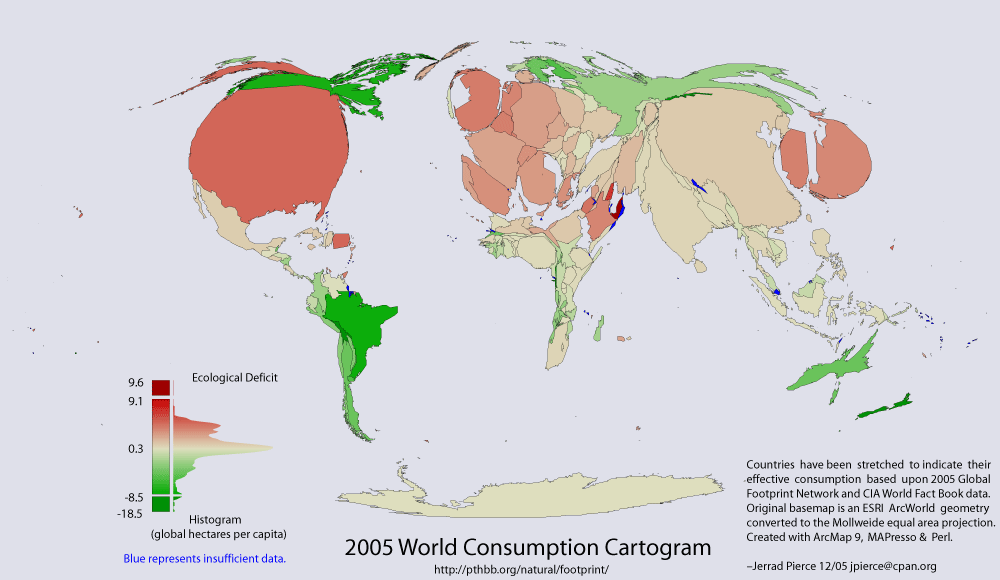 This thematic map shows two variables; 1) coloration indicates
reserve(green) - deficit(red)1 of national biocapacity
and 2) area indicates absolute consumption of biocapacity.
〔WWFの『News & Facts』の『Publications』の『Key Publications』の中の『Living Planet Report』からリンクされた『Fat Map (external link)』〕
|