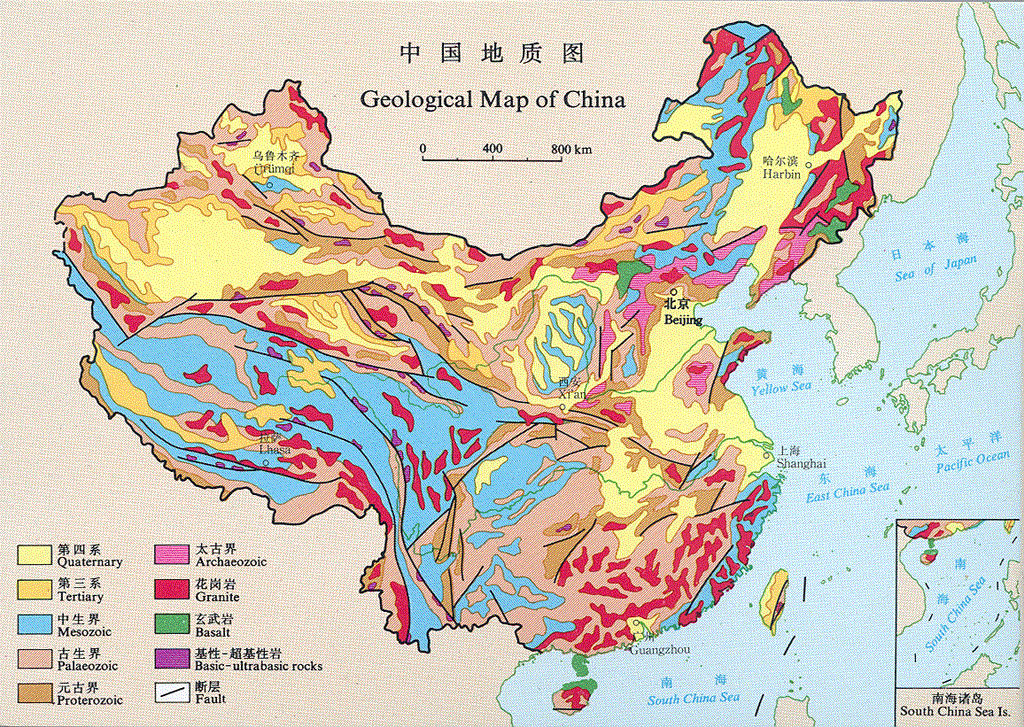
 Geological Map of China China Geological Surveyの『A Series of Smallscale Geological Map of China』から |
|
|
最終更新日:2016年12月4日
|
|
||||
| 全般 | 化石燃料⇒こちら | その他のエネルギー⇒こちら | 環境問題 |
|
|
リンク⇒こちら| 全エネルギー| エネルギーフロー| エネルギー利用形態| エネルギー政策| |
石炭| ピークコール| 石油・天然ガス| パイプライン| 企業| |
電力⇒こちら| 再生可能エネルギー| バイオマスエネルギー| 太陽エネルギー| 風力エネルギー| 原発| |
環境問題| 温室効果ガス排出| |
地質| 地震| 建築とエネルギー| |
| ここには、中国(中華人民共和国、People's Republic of China、PRC)のエネルギー資源(Energy Resource)に関連する情報を集めている。 |
| 地質 |
 Geological Map of China China Geological Surveyの『A Series of Smallscale Geological Map of China』から |
| 全エネルギー(見通しも) |
/Image1139.gif) 中国のエネルギー状況−供給 エネルギー供給能力が徐々に増強 |
/Image1140.gif) 中国のエネルギー状況−供給 日進月歩の電力事業 |
/Image1141.gif) エネルギー消費が急速増加、総量が増大 一次エネルギー消費総量の増加状況(億標準炭トン) |
/Image1142.gif) 石炭を主としたエネルギー消費構造 |
/Image1129.gif) |
中国のエネルギー政策の方向 出典:『中国のエネルギー政策(2012)』 |
|
エネルギー発展“十二五”計画 ●国務院2013年1月1日発表 ●2015年までの目標 ◆エネルギー消費の総量と効率 ■エネルギー消費の効率と総量を二重にコントロールし、エネルギー消費総量を40億トン標準炭とする。 ◆エネルギーの生産・供給能力 ■一次ネルギー供給能力を43億トン標準炭とし、石油の対外依存度を61%以内に抑える。 ◆エネルギー構造の改善 ■非化石エネルギーの消費比率を11.4%にまで高め、非化石エネルギーの発電容量を30%にまで上げる。一次エネルギー消費に占める天然ガスの比率を7.5%に高め、石炭の消費比率を65%前後にまで低める。 ◆国家総合エネルギー基地の建設 ■山西・オルドス盆地・内蒙古東部地区・同西南地区・新疆の五大国家総合エネルギー基地の建設を加速する。2015年までに、五大基地の一次エネルギー生産能力を26.6億トン標準炭に高め、全国比を70%以上に拡大する。外部への輸出は13.7億トン標準炭とし、全国の省間輸送量の90%をカバーする。 ◆生態環境の保護 ■単位GDP当たりのCO2排出量を2010年比で17%引き下げる。炭素燃焼発電の1kWh当たりのSO2排出量を1.5gにまで縮小し、窒素酸化物の排出量を1.5gにまで縮小する。エネルギー開発利用で産出される微小粒子状物質(PM2.5)の排出強度を30%以上減らす。石炭採掘場の再耕地化率を60%以上とする。 ◆都市・農村住民のエネルギー利用 ■新たな農村送電網改造グレードアップを全面的に実施し、都市・農村の各種電力の価格統一化をはかる。行政村を中心に電力のない地区への送電を実現し、天然ガスの使用人口を2.5億人とし、エネルギー基本公共サービスの水準を大きく高める。 ◆エネルギー体制改革 ■電力や石油・天然ガスなど重点分野の改革を進展させ、エネルギー価格市場化改革を進め、エネルギー財政・税制の仕組みをさらに整備し、エネルギー法規政策・標準を整え、エネルギー科学の発展の必要性に応じた産業管理体系を初期的に構築する。 |
/Image1138.gif) |
| 白泉(2013/10)による『中国のエネルギーの状況と政策』から | |
/Image2022.gif) Fig. 1. Total and per capita rural residential energy consumption in rural China, 2001-2008. |
/Image2021.gif) Fig. 2. Variance of rural residential energy consumption structure in China, 2001-2008. |
| Yao et al.(2012)による『Analysis of rural residential energy consumption and corresponding carbon emissions in China』から | |
/Image2734.gif) Fig. 3. Rural energy trend in China. Note: Biogas appears just as a line due to its relatively smallvolume. Source: Zhang et al. (2009b). Bhattacharyya and Ohiare(2012)による『The Chinese electricity access model for rural electrification: Approach, experience and lessons for others』から |
/Image2024.gif) Fig. 13. BAU scenario energy demand by sector, 2000-2030. |
/Image2025.gif) Fig. 16. BAU energy supply outputs by fuel, 2000-2030. |
| Wang et al.(2011)による『Recent development of energy supply and demand in China, and energy sector prospects through 2030』から | |
/Image855.gif) 図2 中国政府の省エネ目標に基づくエネルギー比率の推移(試算) |
|
/Image856.gif) 図3 日中発電電力量比較 |
/Image857.gif) 図4 発電産業計画に基づく発電電力量に占めるエネルギー比率推移(試算) |
/Image858.gif) 図7 省エネ目標と石炭供給計画に基づくエネルギー消費見通し |
/Image859.gif) 図6 中国のエネルギー価格と消費規模 |
/Image860.gif) 図8 中国の運転・建設中の原発 |
|
/Image866.gif) 図12 中国の主要石油製品消費内訳 |
|
/Image861.gif) 図16 中国の主な天然ガスパイプライン・輸入ルート |
|
/Image862.gif) 図17 中国の天然ガス需給見通し(試算) |
|
/Image864.gif) 図20 世界のシェールガス堆積盆地評価 |
|
/Image863.gif) 図19 技術的に採掘可能なシェールガス資源上位5 カ国 |
/Image865.gif) 図22 中国の主なシェールガス評価、入札対象地域 |
| 竹原(HP/2011/7)による『いま、中国のエネルギーで気になること−中国のエネルギー需給と輸入拡大への対応−』から | |
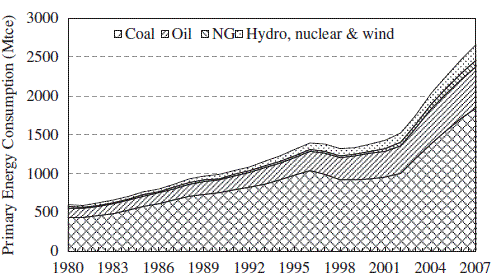
 Fig. 2. China’s primary energy consumption from 1980 to 2007. |
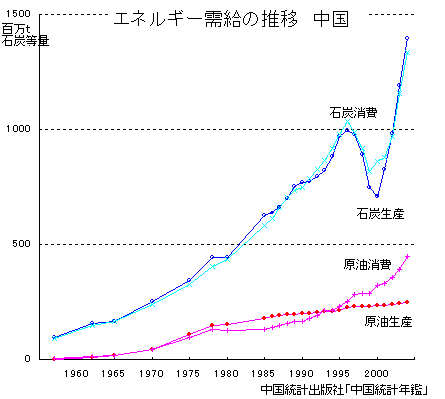
/Image2909.gif) 第2-3-50図 中国におけるエネルギー消費量の推移 経済産業省(2006)による『通商白書2006』(第2章 「アジア・ダイナミズム」と国際事業ネットワークの形成の(10)中国における第11次5カ年規画による経済の持続可能な発展への取組』から |
 5.厳しさを増すエネルギー需給 〔浜松誠二氏による環日本海地域の共生−中国経済の持続的成長の可能性と日本の対応−から〕 |
| エネルギーフロー |
/Image57.gif) Fig. 1. China's energy flow chart for 2007 Zhang and Wang(2011)による『Analysis of China's energy utilization fo 2007』から tceは石炭換算トンであり、Mは100万であるので、Mtceは100万石炭換算トン。(『エネルギーの単位』のページを参照) |
| エネルギー利用形態 |
/Image60.gif) Fig. 6. Energy policy-oriented zoning scheme for poor areas of China. Fan et al.(2011)による『Energy policies for sustainable livelihoods and sustainable development of poor areas in China』から Type zone A (network-based centralized
energy supply zone、電力網を基盤とした中央集中エネルギー供給帯) |
| エネルギー政策 |
/Image1128.gif) 出所:「中国エネルギー発展12次五カ年計画」 竹原(2014/2)による『中国のエネルギーに関する行政指導通知からエネルギー政策を読む』から |
|
中国の新指導部の方針 白泉(2013/10)による『中国のエネルギーの状況と政策』から |
| 地震 |
/Image2750.gif) 説明:20世紀以降中国では、● マグニチュード8以上の地震が7 回、■ マグニチュード7.0-7.9の地震が67回、△ マグニチュード6.0-6.9の地震が382回発生している。 |
/Image2751.gif) 説明:地図では、地震動の最大加速度値を震度に換算しており、最大加速度0.1g、0.2g、0.4g、0.8gは、それぞれ震度VII、VIII、IX、Xにほぼ相当する。 |
| 何永年(HP/2013/3)による『中国の地震防災の現状と展望』から | |
/Image2752.gif) Seismic Hazard Map USGS(2012)によるEarthquake Hazards Programの『China Seismic Hazard Map』から |
| 環境問題 |
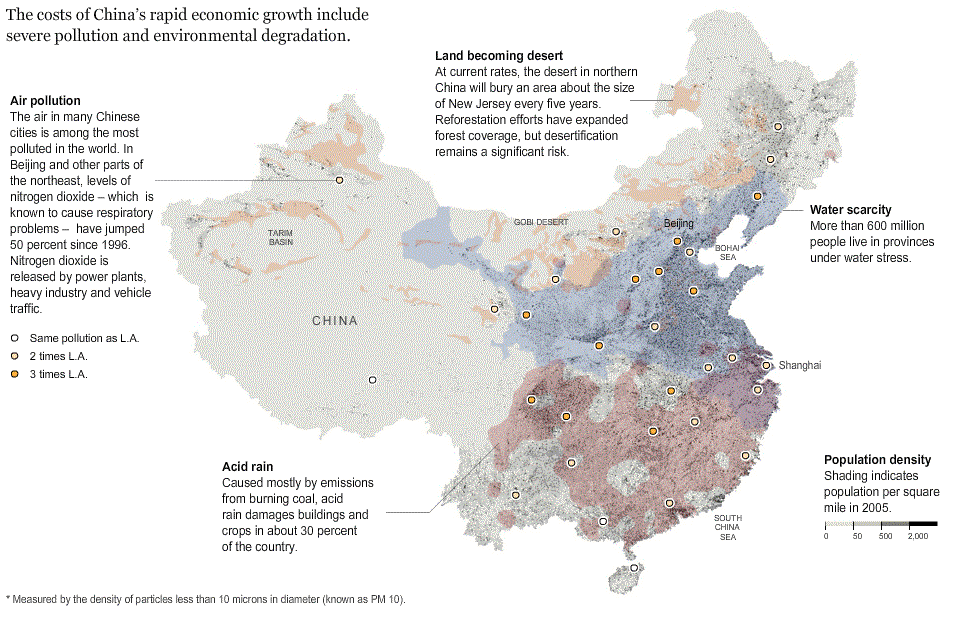
 The New York Timesの中の『China’s Environmental Crisis』(2007年8月26日)から |
| 温室効果ガス排出 |
/Image2721.gif) Fig. 1. CO2 emissions from electricity generation in China. Zhang et al.(2013)による『Decomposition analysis of CO2 emissions from electricity generation in China』から |
/Image2725.gif) Fig. 1. Rural and urban residential energy consumption per capita. Note: data on non-commercial energy consumption in 2008 and 2009 is absent. Data sources: China Energy Statistical Yearbook(2001.2010) and Zhang et al.(2009a). |
/Image2726.gif) Fig. 2. Source structure of rural residential energy use. Data sources: China’s Rural Energy Statistical Yearbook(2000.2008). |
/Image2727.gif) Fig. 3. Rural and urban residential CO2 emission percapita(kgCO2/p) calculated based on data from China Energy Statistical Yearbook(2001.2010)). |
/Image2728.gif) Fig. 4. Provincial rural and urban residential CO2 emission per capita in mainland China in 2007(calculated based on data from China’s Energy Statistical Yearbook 2008). |
/Image2730.gif) Fig. 5. Total rural residential CO2 emissions from commercial and non-commercial energy sources in each province of mainland China for 2007 (calculated based on Appendix A and data from China’s Energy Statistical Yearbook 2008). |
/Image2729.gif) Fig. 6. The major sources of rural residential CO2 emissions in each province of mainland Chinain 2007 (calculated based on Appendix A and data from China’s Energy Statistical Yearbook 2008). |
|
Estimated amount of traditional biomass consumption for residential use in each province in 2007(104 t). Data source: China’s Rural Energy Statistical Yearbook 2008 /Image2731.gif) |
|
| Liu et al.(2012)による『Rural residential CO2 emissions in China: Where is the major mitigation potential?』から【見る→】 | |
/Image2878.gif) Figure 1: Energy and electricity‐related CO2 emissions in China (1990‐2009) Source: IEA statistics. /Image2880.gif) Figure 5: ERI climate policy scenarios for China Source: Jiang, Hu and Zhuang (2009). Note: The 2020 ranges (black bars) indicate the latest emission estimates for China’s ‐ 40‐45% CO2/GDP pledge, based on 7.5%‐8% average GDP growth rates projected to 2020. Key message: Electricity accounts for more than half of China’s projected emissions . and would contribute significantly to the achievement of a low‐carbon scenario for China. IEA(2012)による『Policy Options for Low‐Carbon Power Generation in China』から |
/Image2852.gif) Figure 3. Growth of Estimated CO2 Emissions from the United States and China (198ー2010) Source: BP, Statistical Review of World Energy 2011 at http://www.bp.com/sectiongenericarticle800.do? categoryId=9037188&contentId=7068766 |
/Image2853.gif) Figure 4. GHG Emissions By Source Types in China in 2005 Source: CRS graph from IEA estimates, extracted July 8, 2008. |
/Image2856.gif) Figure 5. One Estimate of Factors Driving Recent Growth of GHG Emissions in China Source: Weber et al., op. cit. Note: China’s total domestic CO2 emissions, divided by driving demands: exports, governmental consumption, household consumption, and capital investment |
/Image2855.gif) Figure 6. Growth of the Economy and Energy Use in China (1971-2009) Source: CRS figure using data from World dataBank, World Development Indicators, extracted July 6, 2011. |
/Image2854.gif) Figure 9. One Projection of Future Chinese Emissions |
Source: Kejun et al. “Technology roadmap for low carbon society in China” J. Renewable Sustainable Energy 2, 031008 (2010). Notes: The figure depicts four scenarios for China’s CO2 emissions: BaU represents “taking no climate change policies under the high GDP growth rate assumption.” The HLC scenario represents unilateral Chinese actions to address energy security, domestic environmental standards, and a low carbon development strategy. The HELC scenario represents further technological efforts to abate CO2 emissions, including large-scale deployment of Carbon Capture and Storage (CCS) in China. This scenario assumes China would act in the context of global efforts. All three of these scenarios assume high rates of economic growth in China. The LLC scenario assumes lower economic growth rates, along with efforts to transition to a low carbon economy. The reference paper provides more detailed assumptions. |
| Leggett(2011/7)による『China’s Greenhouse Gas Emissions and Mitigation Policies』から | |
| 建築とエネルギー |
|
/Image2753.gif) 気候分布図 |
/Image2754.gif) |
|
| 宗(2008/10)による『中国における建築エネルギー消費の現状』から | |
/Image2756.gif) |
|
/Image2755.gif) 図1 規範による建築の熱工学設計地区区分(筆者らが作図) |
|
| 張ほか(2007/8)による『中国の住宅省エネルギー基準の熱工学的考察と日中の省エネルギー基準の比較研究』から |