|
最終更新日:2016年11月25日
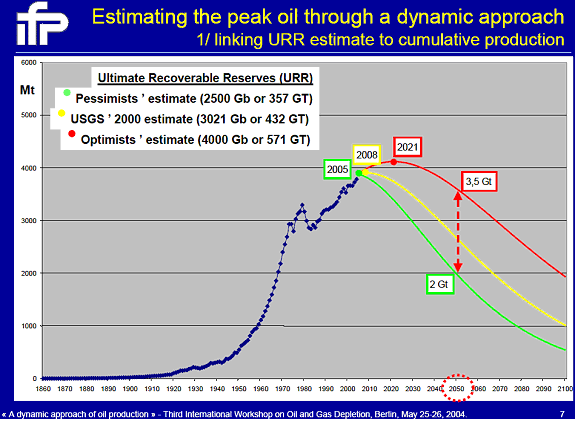
『ピーク・オイル(Peak Oil)』とは、米国の石油地質学者(Geologist)のHubbert(ハバート)が1950〜1970年代に米国の石油生産のピーク年を推定した方法(Hubbert Peak Theory:予想がほぼ的中した)を用いて、世界の石油生産のピーク年を求めるとそれが近い将来に訪れる可能性が高いことを示したモデル(Model)であるが、重要なのは、それに伴うことが予想される甚大な社会・経済的な被害を生むであろう影響を軽減するための準備(代替エネルギーの開発や省エネルギー策など)を早急に行うように訴えていることである。枯渇(Depletion)ではなく生産のピーク(Maximum
Production)と言っていることに注意する必要がある。両者は異なる。その論者らの組織の代表的なものがASPO(Association for the Study of Peak Oil and Gas)である。 関連の専門家・組織の大部分は、石油生産のピークがいずれ到来することは認めているが、時期の予想については大きく異なる。いわゆる『ピーク・オイル』論者(Pessimistic Predictions)は、すでにピーク年は到来したとする者もいるが、多くは2010〜2020年の間を予想している。ただし、IEA(International Energy Agency、国際エネルギー機関)は2030年代頃*としているが、これらの時期の違いは究極埋蔵量(Ultimate Researve)の見積りの違いのためである。また、政治・経済的に『ピーク・オイル』を認めたくない経済学者(Economist)など(Optimistic Estimation)は、遠い将来としている。つまり、石油の埋蔵量が消費(生産)によって減っても、探査等によって新規の埋蔵量を追加することが可能であるので、生産量が頭打ちになることは無いと信じている。自然科学的には誤りであるが、大勢を占めるスタンスである。 また、環境論者の多くは、『ピーク・オイル』について無視するか反対の立場であると思われる。『ピーク・オイル』は、地球環境問題(Global Environmental Issue)とも密接な関係を持ち、それぞれの対策は共通する面が多くあるが、協力して対処することになっていない理由は複雑である。 *IEAによる『World Energy Outlook 2010』の中に、生産量が2006年にピークに達した旨の記載がされているが、2006年が『ピーク・オイル』であるとは明記されていない。従って、ここでは以前に示されていた2030年代頃のままにしている。 |
ピーク・オイルとは |
ピーク・オイル |
Figure 17. Division of the age of oil into three eras. Murphy and Hall(2011)による『Energy return on investment, peak oil, and the end of economic growth』から |
Figure 11: Estimated years by various organisations for the year of peak oil [9]. (URR = Ultimately Recoverable Resource) Connoly(2011)による『The global energy challenge』から |
Fig. 5. The Hubbert peak model applied to the world exergy consumption of coal, oil and natural gas. Fig. 6. The Hubbert peak model applied to the world conventional fossil fuel exergy consumption. Fig. 7. The exergy countdown of the most extracted minerals in the 20th century. Valero and Valero(2010)による『Physical geonomics: Combining the exergy and Hubbert peak analysis for predicting mineral resources depletion』から |
予測年 | 予測者 | 予測年 | 出典 |
|
Bartlett | 2004-2014 | Bartlett(2000) |
EIA | 2021-2112 | Wood and Long(2000) | |
IEA | 2020を越える | IEA(2000) | |
2001 | Deffeyes | 2003-2008 | Deffeyes(2001) |
|
Nemesis | 2004-2011 | Nemesis(2002) |
Smith | 2011-2016 | Smith(2002) | |
|
Simmons | 2007-2009 | Simmons(2003) |
Deffeyes | 2009以前 | Deffeyes(2003) | |
Campbell | 2010頃 | Campbell(2003) | |
World Energy Council | 2010以後 | WEC(2003) | |
Laherrere | 2010-2020 | Laherrere(2003) | |
Shell | 2025あるいは以後 | Davis(2003) | |
Lynch | ピークオイルは無い | Lynch(2003) | |
|
EIA | 2021-2112 | Wood et al.(2004) |
Bakhtiari | 2006-2007 | Bakhtiari(2004) | |
Skrebowaki | 2007以後 | Skrebowski(2004) | |
Goodstein | 2010以前 | Goodstein(2004) | |
CERA | 2020以後 | Jackson and Esser(2004) | |
2005 | Koppelaar | 2010以後 | Koppelaar(2005) |
2006 | Skrebowski | 2010以後 | Skrebowski(2006) |
|
Smith | 2011 | Smith(2006) |
Koppelaar | 2012以後 | Koppelaar(2006) | |
IEA | 2030以後 | IEA(2006) | |
CERA | 2035 | Jackson(2006) | |
|
Robelius | 2008-2018 | Rebelius(2007) |
Koppelaar | 2015 | Koppelaar(2007) | |
Laherrere | 2015頃 | Laherrere(2007) | |
|
CERA | 2017以後 | CERA(2008) |
Shell | 2020あるいは以後 | Shell(2008) | |
|
Fig. 7. Logistic curve assessment for global oil production (sourcedata: see Table 1). |
Fig. 8. Global oil production trends and projections. One barrel of oil = 5.729 GJ (BP,2007) (source data: see Table 1). |
Fig. 9. Logistic curve assessment for global gas production (source data: see Table 2). |
Fig. 10. Global gas production trends and projections. One cubic metre ofgas = 0.0360 GJ (BP,2007) (source data: seeTable 2). |
Nel and Cooper(2009)による『Implications of fossil fuel constraints on economic growth and global warming』から |
Fig. 1. World oil production historical data from different sources. Fig. 5. Comparisons of world oil production (crude+NGL) calculated for a global Ultimate between 2250 and 3000 Gb. Fig. 6. World oil production (crude+NGL) peak value and peak year calculated as a function of the global Ultimate. Maggio and Cacciola(2009)による『A variant of the Hubbert curve for world oil production forecasts』から |
図13 Witze(2007)で示されたCERAによる長期予測の比較 |
図15 21世紀を通じての化石燃料と再生可能エネルギー供給の見通し |
本村・本田(2007)による『ピークオイルの資源論的概念とその対応策について』から |
図5 世界の石油生産能力と生産実績 井上(2006)による『石油の過去・現在・未来〜目から鱗の新資源論〜』から |
表1 ハバートの考えの要約(出所:井上, 2004) 〔(財)エネルギー総合工学研究所の『定期刊行物』の『季報 エネルギー総合工学 Vol.28 No.2(2005.7)』の中の本村真澄氏による『ピークオイル説を検証する』から〕 |
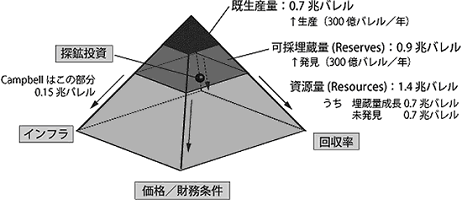
図2 資源ピラミッドモデル 『(1)資源量をピラミッド・モデルで表現する 〔(財)エネルギー総合工学研究所の『定期刊行物』の『季報 エネルギー総合工学 Vol.28 No.2(2005.7)』の中の本村真澄氏による『ピークオイル説を検証する』から〕 |
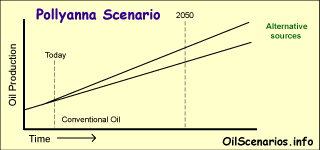
Pollyanna Scenario Oil production can be increased to meet all future demands for at least 40 years (Details and links to articles) |
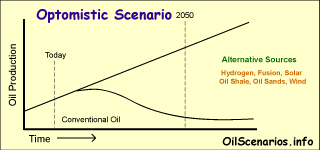
Optimistic Scenario Oil production may slow or even decrease but when combined with conservation and alternative resources it will be possible to meet the growing energy demands of society for the foreseeable future (Details and links to articles) |
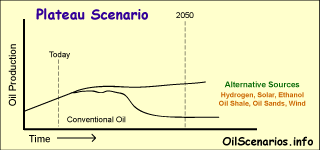
Plateau Scenario Fossil fuel production will plateau in the next decade and alternative sources will not be able to significantly take the place of oil resulting in a volatile energy market and restricted world economy however people will be able to adapt lifestyles to the changing energy environment (Details and links to articles) |
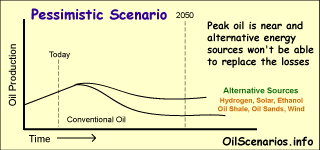
Pessimistic Scenario Oil production will not meet demand, forcing conservation and alternative energy use over the next decade, however total energy resources will still decline slowly resulting in a gradually retracting world economy (Details and link to articles) |
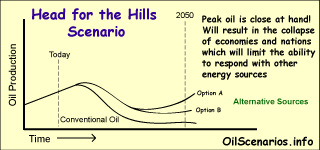
Head for the Hills Scenario Oil production will peak and decline rapidly in the near future resulting in widespread energy shortages resulting in catastrophic collapse of many elements of modern society due to our lack of preparation (Details and links to articles) |
|
Scenarios for the Future of Oil 〔OilScenarios.infoによるOil scenarios.infoの『The Scenarios』から〕 |
〔Hirsch,R.L., Bezdek,R. and Wendling,R.による(Feb., 2005)Peaking of World Oil Production: Impacts, Mitigation, & Risk Managementから〕 |
〔Oilempire.usの中の『Peak Oil』から〕 |
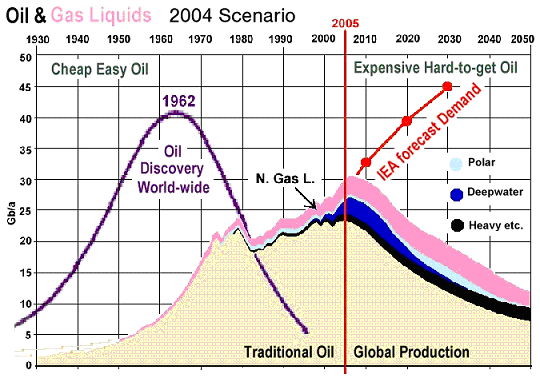
〔Uppsala UniversityのKjell Aleklett氏によるA World Addicted to Oil−It's time to sober up!から(ASPOの中のページ)〕 |
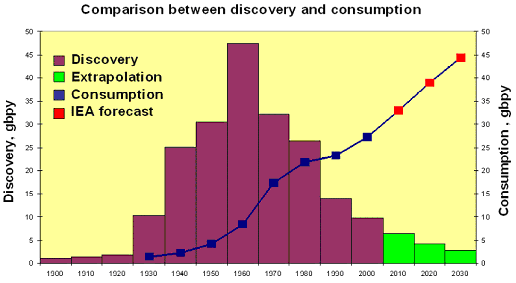
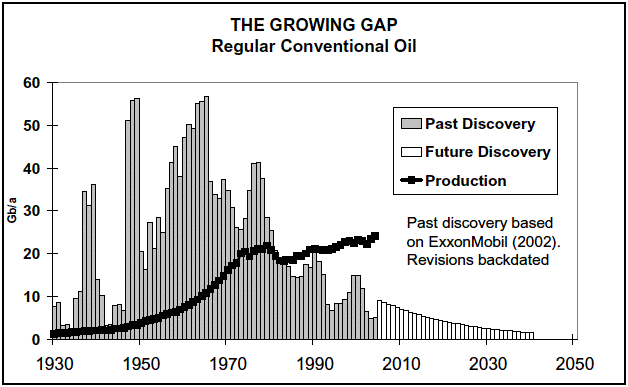
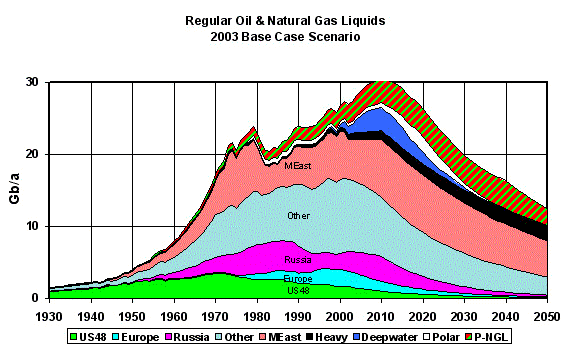
Fig.1 Discovery of Regular Oil (based on Exxon Mobil) 〔Association for the Study of Peak Oil & Gas(ASPO)による『IV International Workshop on Oil and Gas Depletion』の『The End of the First Half of the Age of Oil - C.J. Campbell』から〕 |
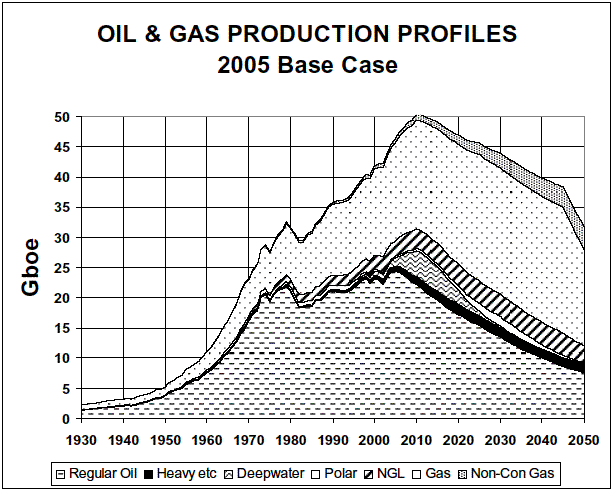
〔Association for the Study of Peak Oil&Gas(ASPO)によるNewsletter 63から〕 |
〔Association for the Study
of Peak Oil&Gas(ASPO)の『Proceedings
of the |
|
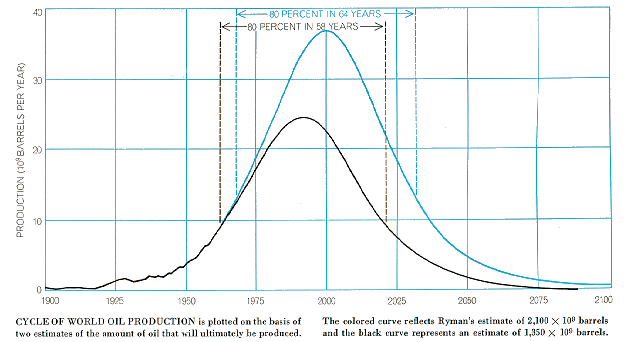
from Energy and Power, A Scientific American Book, 1971, pg 39 〔EcoSystemsによるEcotopiaの『Hubbert Peak of Oil Production』の中のM. King Hubbertから〕 |
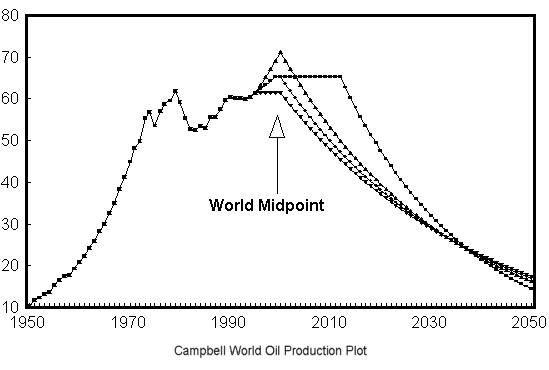
Figure 2 Graph showing Production (Mbd) against Time (Years),
based on Campbell's data. 〔EcoSystemsによるEcotopiaの『Hubbert Peak of Oil Production』の中のSummaryから〕 |
ハバート・モデル |
Q(t)=Qmax/(1+ae-bt) ここで、Q(t):累積生産量、Qmax:全資源量(究極埋蔵量)、a,b:定数。 年間生産量が最大の年(tmax)は、 tmax=(1/b)ln(a) |
dQ/dt=P=KQ〔1−(Q/URR)〕 ここで、Q:累積生産量、P:(年間)生産量、K:ロジスティック成長率、URR:究極埋蔵量。 P/Q=K〔1−(Q/URR)〕 (縦軸にP/Qを横軸にQをとると、縦軸の切片はKになり、傾きは-K/URRになる。) |
x=e-t/(1+e-t)2=1/(2+2cosh
t) 〔coshは双曲線関数(Hyperbolic function)であり、cosh t=(et+e-t)/2である(双曲線余弦関数)。〕 |
ハバート(Hubbert)による生産量ピークの推定法(ハバート・モデル)
ストローン(2008)による〔『地球最後のオイルショック』(57〜81p)から〕 |
図1 ハバートによる米国の原油生産予測 |
図2 生産カーブは発見カーブに追随する |
図3 ロジスティック曲線(左)とHubbertLinearization(右)による表示 |
図4 Hubbert Linearizationの手法による世界の石油生産の減退率のプロット |
本村・本田(2007)による『ピークオイルの資源論的概念とその対応策について』から |
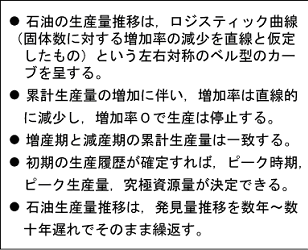
ロジスティック曲線 |
dN/dt=r(K-N)N ここで、N:個体数、K:環境収容力、r:内的増加率(最大増加率)、r(K-N):実際の増加率。 N=K/〔1+exp rK(t0−t)〕 |
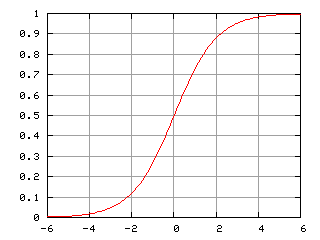
Logistic curve, specifically the sigmoid function |
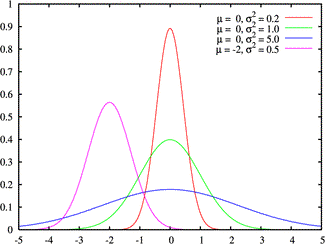
緑は標準正規分布 確率密度関数は 〔フリー百科事典『ウィキペディア(Wikipedia)』の中の『正規分布』から〕 正規分布曲線=ベル・カーブ(釣り鐘形) |
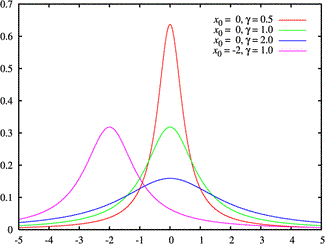
The green line is the standard Cauchy distribution
〔Wikipedia, the free encyclopediaの中の『Cauchy distribution』から〕 コーシー曲線 |
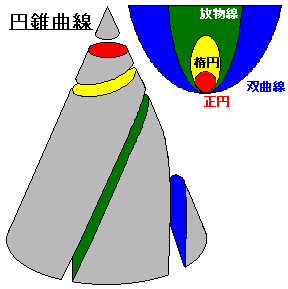
〔フリー百科事典『ウィキペディア(Wikipedia)』の中の『円錐曲線』から〕 |
将来の選択肢 |
※ピークオイル後への対応としては、代替エネルギーの開発・利用および省資源(省エネ)が最も重要な対策とされるが(それぞれ具体的な対策は多様)、石油の新規開発(技術的・経済的)も必須とされることが多い。対策としては、短期的と長期的とでは重点の置き方を変える必要がある。現在は、基本的には国単位の対策が中心であるが、国際的な対応も模索されている。
国家として石油の入手が困難になった時の代表的な3通りの対応例。
|
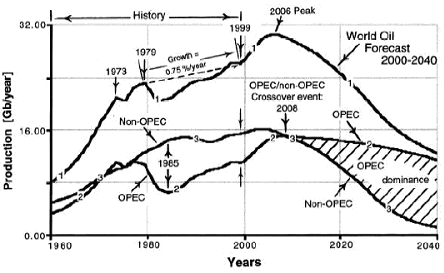
Figure 1. World, OPEC, and Non-OPEC Oil Production Notes: |
Notes: |
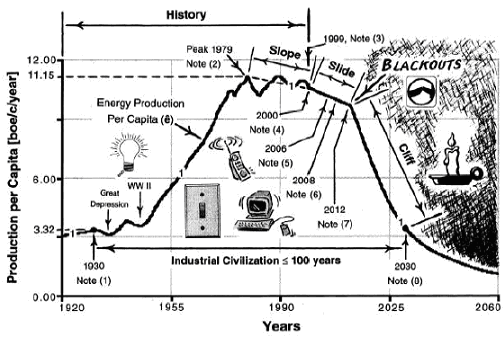
〔Duncan,R.C.(2000): World energy production, population growth, and the road to the Olduvai Gorge. The Pardee Keynote Symposia, Geological Society of America, Summit 2000 in Reno, Nevada on November 13, 2000. Population and Environment, May-June, 2001, 22(5).から〕 |
成長曲線 |
Höök et al.(2011)による『Descriptive and predictive growth curves in energy system analysis』から Richardsの式の±は-が上で+が下。 |