|
最終更新日:2016年12月4日
図 1:中国における石炭火力発電所・ガス火力ベースロード発電所新設禁止区域 竹原(2014/2)による『中国のエネルギーに関する行政指導通知からエネルギー政策を読む』から |
China's National Grid Plans Roman(2014/5)による『China's Power Grid Plans』から |
Figure 1. The organization of the State Power Grid (SGCC). Li et al.(2014)による『Unified Efficiency Measurement of Electric Power Supply Companies in China』から 【参考】 |
(出所)中国電力出版社「中国発電エネルギー供給と電源発展分析報告」各年版 |
図 1-3 中国の電力グリッドと2012年の電力需給 (注)内モンゴルの一部は華北グリッドに所属。 |
1-18 中国の国内電力グリッドと国際系統連系の構想 |
図 1-19 中国の2020年電力系統計画 〔Tweed(2011)による『Landis+Gyr Land State Grid Contract in China』から〕 |
(財)日本エネルギー経済研究所(2014/3)による『平成25年度電力系統関連設備形成等調査事業(国際連系に関する調査・研究)報告書』 |
The West - East Electricity Transfer Project,
initiated in the Tenth Five-Year Plan (2000-2005), was designed
to bring investment and development to China’s lagging west while
satisfying the growing electricity needs of the country’s eastern
provinces. The project’s first phase has been and is continuing
to expand the western provinces’ electricity-generating capacity,
primarily through the construction of new coal bases and hydroelectric
dams. Wilson Center(HP/2013/11)による『Electricity on the Move China’s Network of Transmission Lines Moving Coal Power and Hydropower Eastward』から |
GENI(HP/2013/11)による『National Energy Grid China』から |
Three Gorges in the national electricity grid Source: China Electric Power Information Center, available at www.sp.com.cn accessed 11 August 2010. The central position of Three Gorges in the long distance transmission network is clear. China is adding very high voltage lines (> 800 kV) to this network, to integrate the five regions that are run by State Grid (Northeast, North, Northwest, Central and East). A separate corporation, Southern Power Grid, manages transmission in Guangdong, Guangxi, Guizhou, Hainan and Yunnan. Cartier(2013/9)による『Making Capitalism in Rural China: A Review』から |
図15 中国の民生用電力需要の推移 (出所)中国国家電力網公司ホームページで公表されたデータ16)より筆者推計。 |
図19 中国における電源構成の構想 (注)電源構成は「電力第11 次五カ年計画」を基に試算。 |
図20 中国エネルギー政策の方向性 (出所)筆者作成。 |
図21 中国エネルギー行政の構造改革 (出所)筆者作成。 |
周ほか(2013/3)による『中国の持続可能な電力政策に関する研究−日本の経験を参考にした電力供給安定策への提言−』から |
ウィキペディアによる『国家電網』などから |
Fig. 3. Share of electricity generation. |
Fig. 4. Electricity intensity for China economy. |
Fig. 5. Share of energy type for thermal power. |
|
Zhang et al.(2013)による『Decomposition analysis of CO2 emissions from electricity generation in China』から |
電力供給体制 (社)海外電力調査会による『中国の電気事業』(2013/1)から |
図12 中国省別一人当たりのGDP と電力消費量(2003年) (注)省別の1 人当りGDP では千ドルを超える省は16、残りの15 省は千ドル未満。 (出所)「中国統計年鑑2004」より筆者作成。 |
図14 中国電力需要に対する各研究機関の予測比較 (注) International Energy Outlook 2004(EIA, 2004/04)、World Energy Outlook 2002(IEA, 2002/09)、「APEC Energy Demand and Supply Outlook 2002」(APERC, 2002/09)、2020 中国持続可能なエネルギーシナリオ(ERI, 2003/08)。本研究想定:2006〜2010 年は7%、2011〜2020 年は5%で伸びた場合。2005 年は速報値。 (出所)筆者作成。 |
図15 経済成長と電力需要の関係 (注) 日本は1955〜1973、中国は1986〜2004。各年度GDP を対米ドル為替レートで換算。 (出所)日本総務省統計局「日本の長期統計系列」、「中国統計年鑑」より筆者作成。 |
図16 各地域の電力需要 (注) 沿海三省(江蘇・浙江・広東)、東北三省(遼寧・吉林・黒竜江)、中部三省(河南・湖北・江西)、西部三省(四川・貴州・陜西)。 (出所)「中国統計年鑑」、各種資料等より筆者作成。 |
図17 各地域の電源構成 (注) 2003 年末時点。その他は風力、廃棄物発電等。先進地域(浙江・江蘇・広東)、中進地域(東北三省、華中地区)、後進地域(西北地区、西南地区)。 (出所)「中国統計年鑑」、各種資料等より筆者作成。 |
|
周ほか(2012/10)による『中国の持続可能な電力政策に関する研究― 2003年前後における中国の電力不足の要因分析と課題整理 ―』から |
Fig. 1. China’s power installed capacity/GW. (Sources: Wang, 2010; China Electricity Council, 2011). |
Fig. 2. (A) The location of coal miner and main power consumption; (B) the location of nuclear power, (C) the location of hydropower basis and (D) China’sseven individual grid systems. (Sources: Wang et al., 2009) |
Wang and Chen(2012)による『China's electricity market-oriented reform: From an absolute to a relative monopoly』から |
|
|
資源エネルギー庁(2012/5)による『これまでの議論を受けて(日本・米国・中国の電力コストについて)』から |
|
|
(株)三菱総合研究所(2012/3)による『海外のスマートメーター及び柔軟料金に関する動向』から |
Figure 2: Electricity in China: the unabated dominance of coal Source: IEA Statistics, 2012; ERI, 2012 |
Figure 19: Different company‐level fuel mix scenarios by 2020 (TWh) Key message: In 2010 the share of coal‐based generation is 80%, in the 2020 base case it is 64% while in the 2020 low‐carbon case it is 51%. This lower share of coal‐based generation in the low‐carbon case is replaced by in particular more gas and nuclear but also a higher share of wind and solar. |
IEA(2012)による『Policy Options for Low‐Carbon Power Generation in China』から |
図1 日本の電源配線とTT接地方式 |
図2 中国の電源配線と接地方式 |
松田ほか(2011/5)による『中国の電源事情に対する課題と対策』から |
|
|
関ほか(2011)による『中国のスマートグリッド市場における地域自立・環境調和型電力システムの制御技術』から |
Fig. 2. On-grid tarrif by generation technologies. Source: SERC (2008, 2009). Ma(2011)による『On-grid electricity tariffs in China: Development, reform and prospects』から 電力網からの電気料金:RMB=人民元(2012年1月現在で1RMB≒12.2円) |
|
|
|
|
|
|
|
|
原子力百科事典ATOMICA(HP/2011)による『中国の電力事情と発電計画』から |
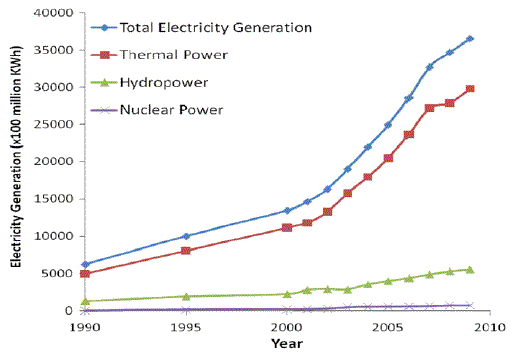
Fig. 1. The total electricity generation and components in China from 1990 to 2009. Zhou(2010)による『Why is China going nuclear?』による |
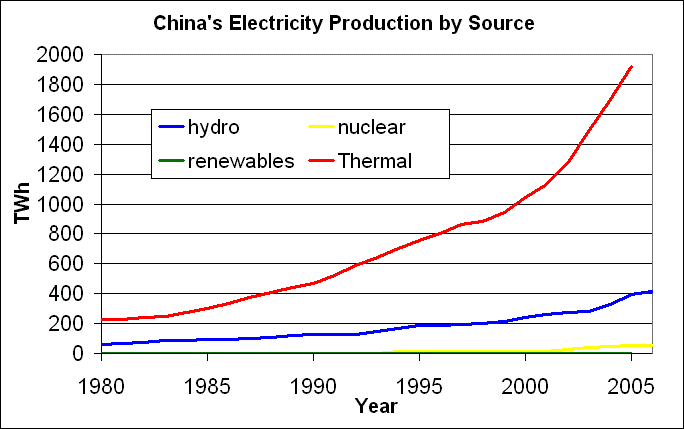
Electricity production in China by source. |
図 2-11 2005年全国連系図 |
図 2-12 2015年全国連系図 (出所:海外諸国の電気事業第1 編2003 年、(社)海外電力調査会) |
図 3-1 送配電系統図 (出所:海外電力調査会「平成14 年度中国配電事業に関する調査報告書(平成15 年3 月)」) |
|
(社)日本電機工業会による『中国における受配電システムに関する調査 報告書』(2004/3)から |