|
石炭資源の地域分布では、華北地区が最も多く、全国総埋蔵量の49.25%を占める。その次に、西北地区30.39%、西南地区8.64%、華東地区5.7%、中南地区3.06%、東北地区2.97%である。省、市、自治区単位でみると、山西、内蒙古、陜西、新疆、貴州と寧夏の6つの省区が最も多く、埋蔵総量の約81.6%を占める。炭田分布を下図に示す。 /Image2063.gif) 図2-1 中国の石炭資源 |
|
|
最終更新日:2016年12月4日
| 石炭 |
|
石炭資源の地域分布では、華北地区が最も多く、全国総埋蔵量の49.25%を占める。その次に、西北地区30.39%、西南地区8.64%、華東地区5.7%、中南地区3.06%、東北地区2.97%である。省、市、自治区単位でみると、山西、内蒙古、陜西、新疆、貴州と寧夏の6つの省区が最も多く、埋蔵総量の約81.6%を占める。炭田分布を下図に示す。 /Image2063.gif) 図2-1 中国の石炭資源 |
/Image2023.gif) Fig. 3. Coal production by mine type (1979-2008). Source: China Coal Industry Yearbook (1982-2009). Shen et al.(2012)による『China's
coal policy since 1979: A brief overview』から |
/Image2026.gif) Fig. 8. Coal production comparisons of traditional approaches and the improved models. Wang et al.(2011)による『Coal production forecast and low carbon policies in China』から |
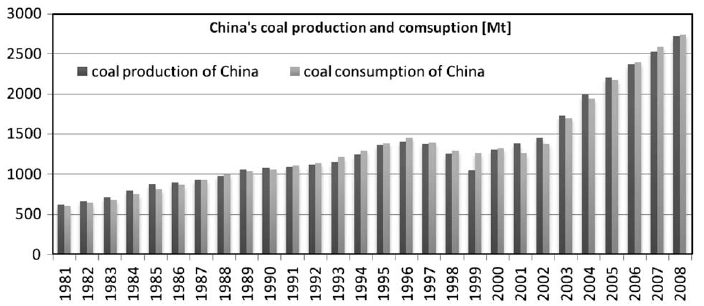 Fig. 1. Trends for China’s coal production and consumption. Source: National Bureau of Statistics of China China Energy Statistical Yearbook. 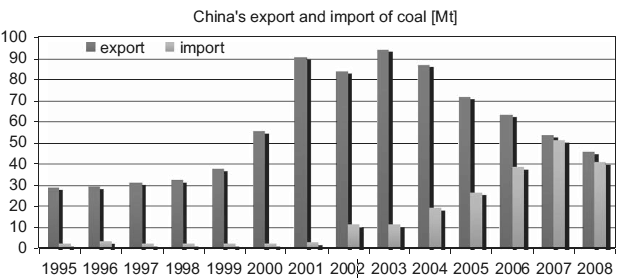 Fig. 2. Trends of coal export and import. Source: General Administration of Customs of the People’s Republic of China. Lin & Liu(2010)による『Estimating coal production peak and trends of coal imports in China』から |
| 西暦年 |
|
|
|
||||
| 低 | 中 | 高 | 低 | 中 | 高 | ||
| 2010 | 29.4 | 30.1 | 31 | 29.17 | 0.29 | 0.99 | 1.89 |
| 2015 | 34.7 | 37.0 | 39.4 | 34.00 | 1.03 | 3.33 | 5.73 |
| 2020 | 40.1 | 44.3 | 48.9 | 37.67 | 3.14 | 7.34 | 11.94 |
| 2025 | 43.5 | 49.9 | 57.0 | 39.47 | 5.20 | 11.60 | 18.7 |
| 2030 | 48.4 | 57.5 | 68.0 | 39.01 | 11.00 | 20.10 | 30.6 |
|
|
|
|
|
||||||
| 低 | 中 | 高 | 低 | 中 | 高 | 低 | 中 | 高 | |
| 2015 | 9.25 | 13.74 | 16.63 | 1.03 | 3.33 | 5.73 | 11 | 24 | 34 |
| 2030 | 27.04 | 43.14 | 57.12 | 11.00 | 20.10 | 30.60 | 41 | 47 | 54 |
| * 世界石炭貿易のデータは、本論文の石炭輸入予測に従って、EIAによるIEO 2008の世界石炭貿易を修正したものから得られた。 | |||||||||
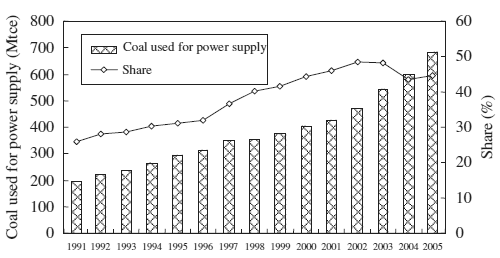 Fig. 3. Coal consumption for power and the % of coal used for power in the total coal consumption. |
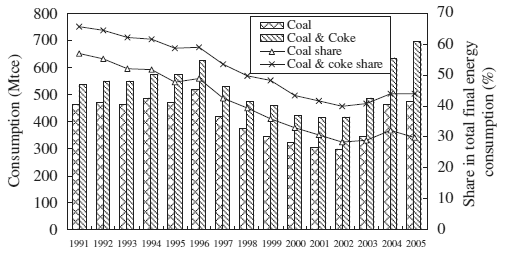 Fig. 5. Coal Consumption and Percentage in the total final energy consumption from 1991to2005. |
| Chen & Xu(2010)による『Clean coal technology development in China』から | |
|
|
|
(100万トン/年) |
| 大同(Datong) | 山西(Shanxi) | 31.7546 |
| (Kailuan) | 河北(Hebei) | 17.6048 |
| 平頂山(Pingdingshan) | 河南(Henan) | 17.1478 |
| 淮北(Huaibei) | 安徽(Anhui) | 14.2321 |
| 西山(Xishan) | 山西(Shanxi) | 14.1277 |
| 鶴崗(Hegang) | 黒竜江(Heilongjiang) | 13.1307 |
| 徐州(Xuzhou) | 江蘇(Jiangsu) | 13.1031 |
| 阜新(Fuxin) | 遼寧(Liaoning) | 12.6987 |
| 龍口(Longkou) | 山東(Shandong) | 12.0031 |
| (Yanzhuo) | 山東(Shandong) | 12.0031 |
| 鶏西(Jixi) | 黒竜江(Heilongjiang) | 11.6442 |
| 淮南(Huainan) | 安徽(Anhui) | 11.4985 |
| (Yangquan) | 山西(Shanxi) | 10.4769 |
| 馮峰(Fengfeng) | 河北(Hebei) | 10.3700 |
| (Jincheng) | 山西(Shanxi) | 10.3206 |
| 鉄法(Tiefa) | 遼寧(Liaoning) | 10.2410 |
| (Xinwen) | 山東(Shandong) | 10.0890 |
| 七台河(Qitaihe) | 黒竜江(Heilongjiang) | 10.0601 |
| 雙鴨山(Shuangyashan) | 黒竜江(Heilongjiang) | 10.0155 |
|
|
1995 | 1996 | 1997 | 1998 | 1999 | 2000 | 2001 | 2002 |
| 山西(Shanxi) | 140.0 | 143.8 | 137.7 | 143.5 | 128.4 | 133.2 | 138.8 | 170.1 |
| 河北(Hebei) | 90.8 | 92.0 | 92.3 | 94.8 | 96.7 | 101.6 | 106.5 | 117.8 |
| 山東(Shandong) | 86.6 | 91.6 | 91.5 | 87.1 | 86.1 | 75.3 | 94.7 | 110.9 |
| 江蘇(Jiangsu) | 83.1 | 83.2 | 79.9 | 81.8 | 83.4 | 84.5 | 87.1 | 94.0 |
| 河南(Henan) | 66.7 | 69.6 | 65.4 | 68.1 | 71.0 | 76.9 | 83.1 | 93.7 |
| 遼寧(Liaoning) | 81.5 | 80.9 | 79.7 | 76.4 | 73.9 | 86.0 | 81.2 | 84.0 |
| 広東(Guangdong) | 45.3 | 47.7 | 48.6 | 48.1 | 50.8 | 57.3 | 58.9 | 64.8 |
| 内モンゴル自治区(Inner Mongolia) | 37.7 | 40.6 | 48.6 | 44.1 | 48.3 | 53.4 | 57.1 | 63.4 |
| 安徽(Anhui) | 44.8 | 47.5 | 49.3 | 48.0 | 50.0 | 53.2 | 57.2 | 59.7 |
| 浙江(Zhejiang) | 39.5 | 43.2 | 45.1 | 44.3 | 45.8 | 48.3 | 53.5 | 58.6 |
/Image1505.gif) |
/Image1502.gif) 図.1.3-1 石炭関連組織 |
/Image1504.gif) 図.1.3-2 中国13大型石炭基地 |
/Image1506.gif) 図.1.3-3 中国の石炭輸出入推移 (出所:JCOAL Magazine 第6 号P-3) |
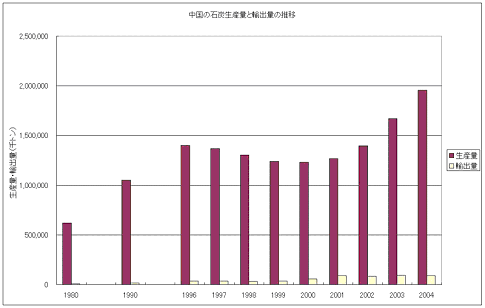 〔NEDOの『各部の活動』の『石炭事業部』の『石炭情報検索データベース』の『国別石炭情報 - 中国 -』から〕 |
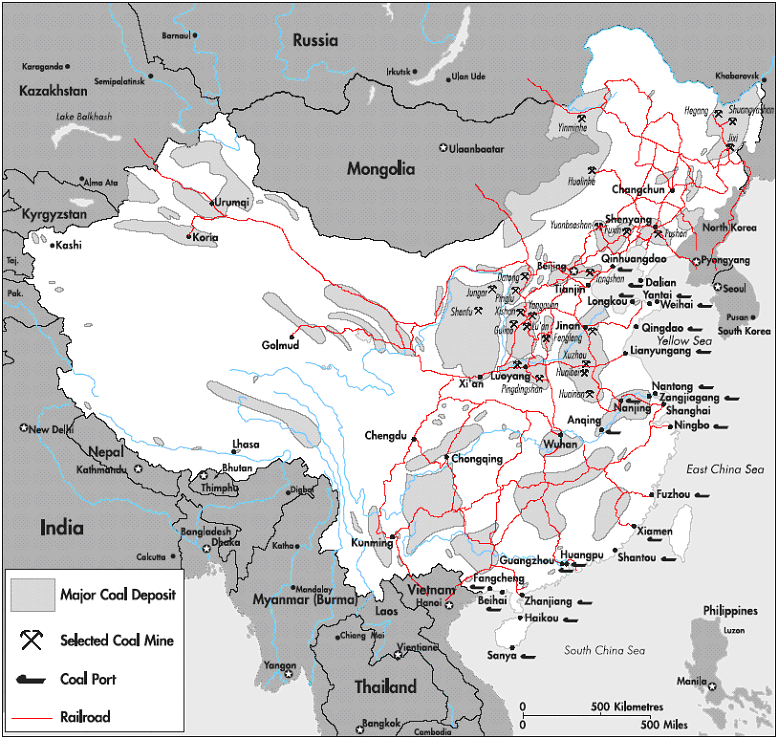 Source: US DoE. EIA. Country Energy Profile. China. February 1995. 〔IEAのInformation Centerの中の『Co-operation with Non-OECD Countries - China』の『Coal in the Energy Supply of China 1999』から〕〕 |
| ピークコール |
/Image2738.gif) Fig. 3. The coal peak of China. Source: National Bureau of Statistics of China. Lin et al.(2012)による『Impact of carbon intensity and energy security constraints on China's coal import』から |
/Image81.gif) Figure 1: The best multi-Hubbert cycle match of the historical cumulative production of anthracite, bituminous, and lignite coal in China. The year of peak production is 2011, and the ultimate coal production is 146.5 Gt. The broad base peak is in the year 2019. Data source: Supplemental Materials to Mohr and Evans (2009) [9]. |
/Image82.gif) Figure 2: The best multi-Hubbert cycle match of the historical rate of production of anthracite, bituminous, and lignite coal in China. Data source: Supplemental Materials to Mohr and Evans (2009) [9]. |
| Patzek and Croft(2011)による『The key coal producers Online supporting materials to a global coal production forecast with multi-Hubbert cycle analysis』から | |
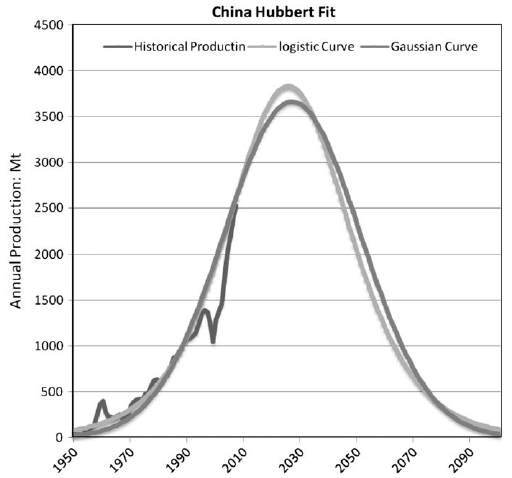 Fig. 4. The coal peak of China. Source: National Bureau of Statistics of China. Lin & Liu(2010)による『Estimating coal production peak and trends of coal imports in China』から |
| モデル | 単位 | ロジスティック曲線 | ガウス曲線 |
|
||
| 埋蔵量 | 億トン | 1886 | 1886 | シナリオ1 | シナリオ2 | シナリオ3 |
| tmax(ピーク年) | 西暦年 | 2025 | 2027 | 2033 | 2029 | 2027 |
| Pmax(ピーク埋蔵量) | 億トン | 38.30 | 36.65 | 33.39 | 37.84 | 42.29 |
| モデル | 埋蔵量 | 2086 | 1986 | 1886 | 1786 | 1686 | 1145 |
| ロジスティック成長曲線 | ピーク生産量(億トン) | 41.31 | 39.85 | 38.30 | 37.08 | 36.35 | 30.46 |
| ピーク年 | 2027 | 2026 | 2025 | 2024 | 2023 | 2016 | |
| ガウス成長曲線 | ピーク生産量(億トン) | 38.51 | 37.58 | 36.65 | 35.72 | 34.79 | 30.10 |
| ピーク年 | 2029 | 2028 | 2027 | 2026 | 2025 | 2017 |
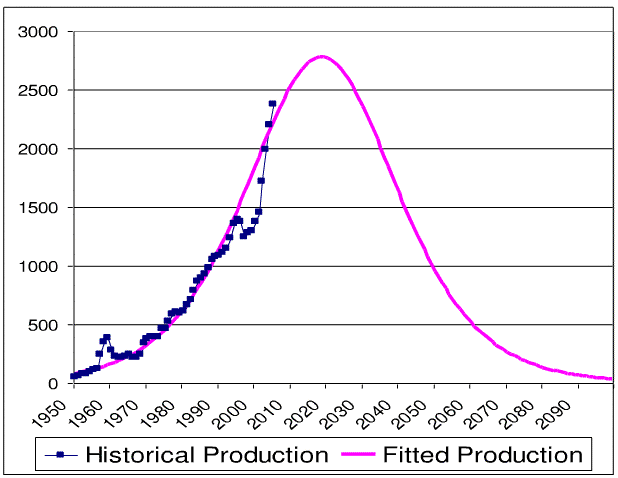 Forecasting the future(26/48) 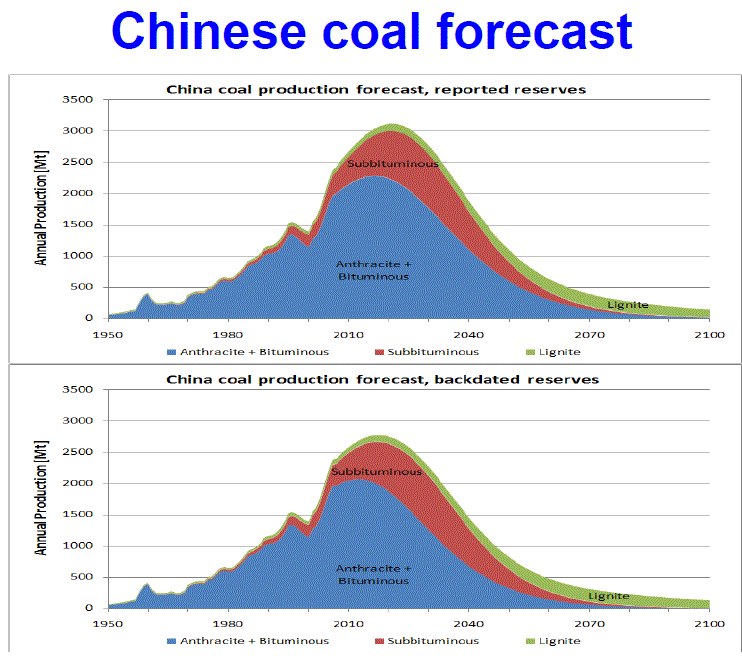 Chinese coal forecast(28/48) Hook(両方のoの頭に¨),M.(HP)による『Coal future of China and the World』から |
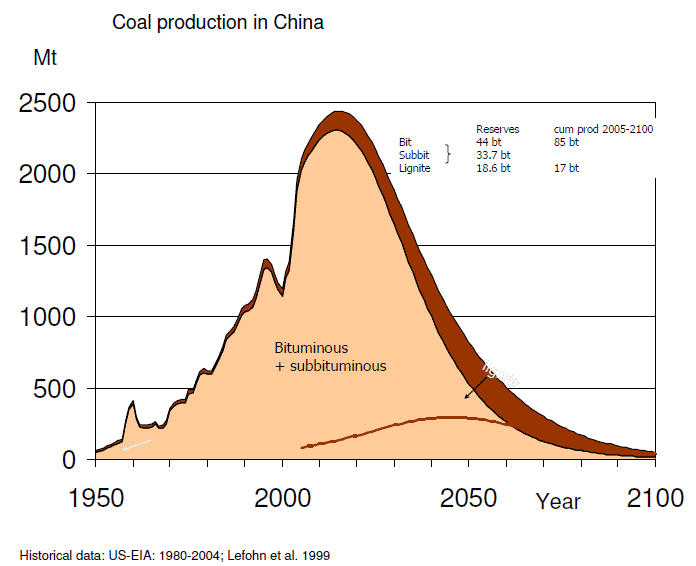 Figure A-3: Coal Production in China−scenario based on present reserve estimates(図A−3 中国の石炭生産−現在の埋蔵量見積りを基にしたシナリオ) 〔Energy Watch Group(2007)によるCoal: Resources and future productionから〕 |
| 石油・天然ガス |
|
中国のシェールガス資源量に関する現時点の評価
中国にとりシェールガスはエネルギー輸入依存抑制、環境問題への対応で心強い存在
(天然ガス確認埋蔵量110Tcf、当面の開発対象となるシェールガス資源量150〜300Tcf) シェールガス生産目標
まとめ
|
/Image123.gif) 中国のシェールガス有望地域:南部古生代海成層 /Image122.gif) 中国の一次エネルギー消費見通し 12次五か年計画等にもとづく比率(試算) |
|
竹原(2013/4)による『中国のシェールガス開発近況』から |
/Image2735.gif) Fig. 1. Predictions of China’s natural gas peak in different scenarios. Lin and Wang(2012)による『Forecasting natural gas supply in China: Production peak and import trends』から |
/Image2659.gif) 図19 主な油ガス堆積盆地と開発中の主なタイトガス田 |
/Image2660.gif) 図20 主な油ガス堆積盆地とCBM資源 |
/Image2676.gif) 図21 中央アジアの天然ガスパイプライン網 |
/Image2674.gif) 図11 中国の主な天然ガスパイプラインおよびLNG受入基地 |
/Image2675.gif) 図22 ミャンマー〜中国間の石油・天然ガスパイプライン |
|
| 竹原(2012)による『上海ハブ、シェールガス大国誕生か?― 中国のガスをめぐる状況 ―』から | |
/Image1500.gif) Figure 1. Major Shale Gas Basins in China (Figure Courtesy of Advanced Resources International) Forbes(2012)による『China's Prospects for Shale Gas and Implications for the U.S.』から |
|
合計 (Mtce) |
石炭 (%) |
石油 (%) |
天然ガス (%) |
一次電力** (%) |
|
| 1990 | 987.0 | 76.2 | 16.6 | 2.1 | 5.1 |
| 1991 | 1037.8 | 76.1 | 17.1 | 2.0 | 4.8 |
| 1992 | 1091.7 | 75.7 | 17.5 | 1.9 | 4.9 |
| 1993 | 1159.9 | 74.7 | 18.2 | 1.9 | 5.2 |
| 1994 | 1227.4 | 75.0 | 17.4 | 1.9 | 5.7 |
| 1995 | 1311.8 | 74.6 | 17.5 | 1.8 | 6.1 |
| 1996 | 1389.5 | 74.7 | 18.0 | 1.8 | 5.5 |
| 1997 | 1378.0 | 71.7 | 20.4 | 1.7 | 6.2 |
| 1998 | 1322.1 | 69.6 | 21.5 | 2.2 | 6.7 |
| 1999 | 1338.3 | 69.1 | 22.6 | 2.1 | 6.2 |
| 2000 | 1385.5 | 67.8 | 23.2 | 2.4 | 6.7 |
| 2001 | 1432.0 | 66.7 | 22.9 | 2.6 | 7.9 |
| 2002 | 1518.0 | 66.3 | 23.4 | 2.6 | 7.7 |
| 2003 | 1749.9 | 68.4 | 22.2 | 2.6 | 6.8 |
| 2004 | 2031.3 | 68.0 | 22.3 | 2.6 | 7.1 |
| 2005 | 2233.2 | 69.1 | 21.0 | 2.8 | 7.1 |
| 2006 | 2462.7 | 69.4 | 20.4 | 3.0 | 7.2 |
| 2007 | 2654.8 | 69.5 | 19.7 | 3.5 | 7.3 |
| 2008 | 2850.0 | 68.7 | 18.7 | 3.8 | 8.9 |
|
中国統計要約2009、145ページ。 * 商業エネルギーのみが含まれるが、非商業バイオマスエネルギーが中国の地方においては依然として特に広く消費されていることに注意。1990年では263.0 Mtceで、2007年では263.0 Mtceである。 ** 一次電力には、水力・原子力・風力発電が含まれる。商業エネルギーのみ。 Mtce=100万トン石炭換算 |
|||||
|
石油生産量 (Mt) |
石油消費量 (Mt) |
石油輸入量 (Mt) |
石油輸出量 (Mt) |
正味の石油輸入量 (Mt) |
正味の輸入依存率* (%) |
|
| 1990 | 138.3 | 114.9 | 7.6 | 31.1 | -23.5 | -20.5 |
| 1991 | 141.0 | 123.8 | 12.5 | 29.3 | -16.8 | -13.6 |
| 1992 | 142.1 | 133.6 | 21.2 | 28.6 | -7.3 | -5.5 |
| 1993 | 145.2 | 147.2 | 36.2 | 25.1 | 11.1 | 7.5 |
| 1994 | 146.1 | 149.5 | 29.0 | 23.8 | 5.2 | 3.5 |
| 1995 | 150.1 | 160.6 | 36.7 | 24.5 | 12.2 | 7.6 |
| 1996 | 157.3 | 174.3 | 45.4 | 27.0 | 18.4 | 10.6 |
| 1997 | 160.7 | 194.1 | 67.9 | 28.2 | 39.7 | 20.5 |
| 1998 | 161.0 | 198.2 | 57.4 | 23.3 | 34.1 | 17.2 |
| 1999 | 160.0 | 210.7 | 64.8 | 16.4 | 48.4 | 23.0 |
| 2000 | 163.0 | 224.4 | 97.5 | 21.7 | 75.8 | 33.8 |
| 2001 | 164.0 | 228.4 | 91.2 | 20.5 | 70.7 | 31.0 |
| 2002 | 167.0 | 247.9 | 102.7 | 21.4 | 81.3 | 32.8 |
| 2003 | 169.6 | 271.3 | 131.9 | 25.4 | 106.5 | 39.3 |
| 2004 | 175.9 | 317.0 | 172.9 | 22.4 | 150.5 | 47.5 |
| 2005 | 181.4 | 325.3 | 171.6 | 28.9 | 142.8 | 43.9 |
| 2006 | 184.8 | 348.8 | 194.5 | 26.3 | 168.3 | 48.2 |
| 2007 | 186.3 | 366.5 | 211.4 | 26.6 | 184.8 | 50.4 |
| 2008** | 197.8 | 396.0 | - | - | 197.2 | 50.0 |
|
EIA(2009)、http://tonto.eia.doe.gov/country/country_energy_data.cfm?fips=CH * 正味と輸入依存率とは、全石油消費量に対する正味の石油輸入量の割合 ** EIA(2009)の見積り |
||||||
 |
 |
|
中国の2004年の原油輸入量は、上半期の増加の趨勢から見て1億tを突破すると見られている。 〔浜松誠二氏による急拡大する中国のエネルギー消費−石油輸入の急増−から〕 |
|
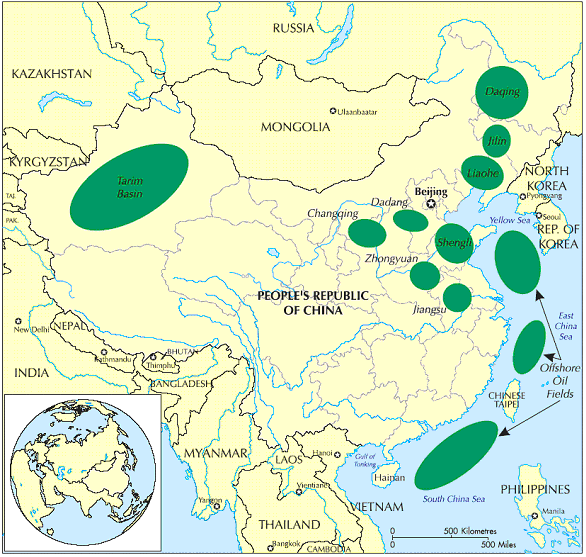 Map of China Indicating Major Provinces and Oil Fields Source: China OGP, 1999, Vol.2 |
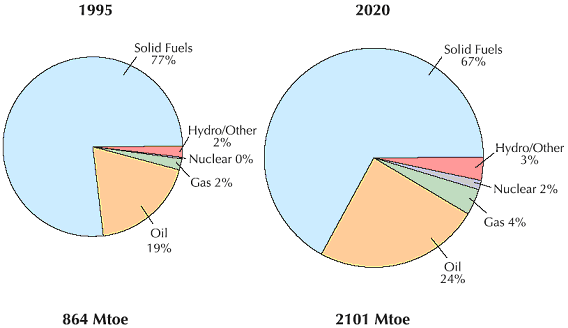 Figure 1.1: Total Primary Energy Demand |
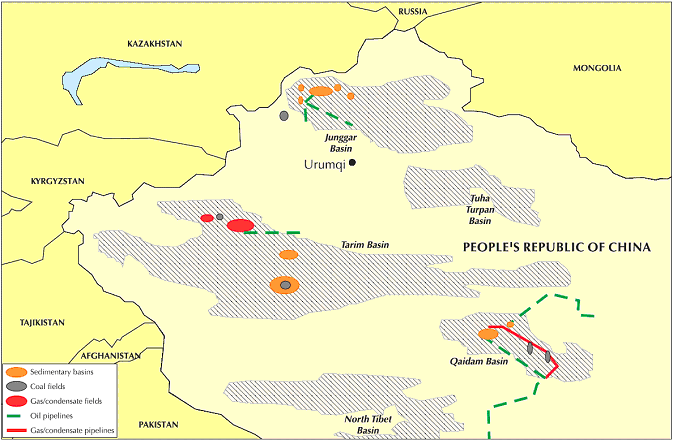 China's Tarim, Junggar and Turpan Basins Source: CNPC |
|
| 〔IEAのInformation Centerの中の『Co-operation with Non-OECD Countries - China』の『China's Worldwide Quest for Energy Security 2000』から〕 | |
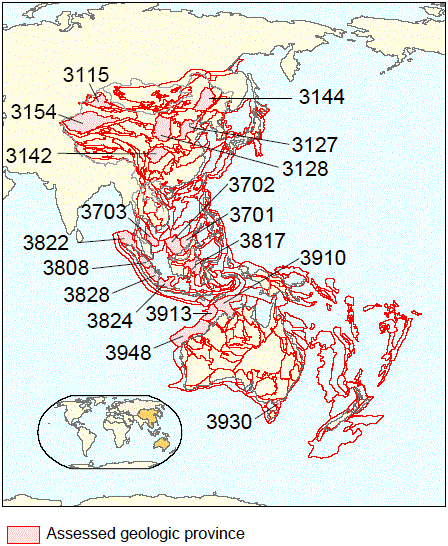 |
Asia Pacific Region 3 Assessed Geologic Provinces 3115 Junggar Basin(ジュンガル盆地) 3127 Bohaiwan Basin(渤海湾盆地) 3128 Ordos Basin(オルドス盆地) 3142 Sichuan Basin(四川盆地) 3144 Songliao Basin(松遼盆地) 3154 Tarim Basin(タリム門地) 3701 Baram Delta/Brunei-Sabah Basin 3702 Greater Sarawak Basin 3703 Malay Basin 3808 Central Sumatra Basin 3817 Kutei Basin |
| 〔USGSのU.S. Geological Survey World Petroleum Assessment 2000 − Description and Resultsの『USGS World Energy Assessment Regions』から〕 | |
| パイプライン |
/Image167.gif) JPECによる『第3ルート建設まで進んだ中国の西気東輸パイプライン』(2013/4)から |
/Image59.gif) Fig. 1. China's existing, planned and speculative cross-border oil pipelines, 2010. Source: The author's production. Leung(2011)による『China's energy security: Perception and reality』から 国外とのパイプライン(既設・計画・推定)。 |
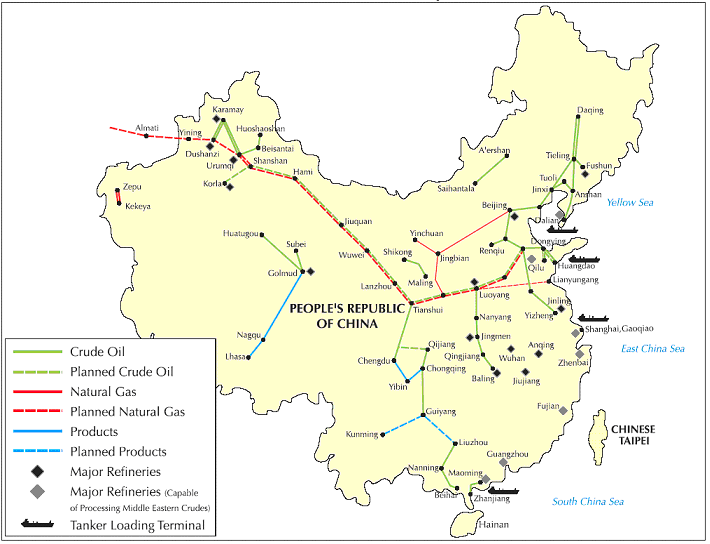 Sources: IEA and Energy in Japan No. 158, July 1999, p.26 〔IEAのInformation Centerの中の『Co-operation with Non-OECD Countries - China』の『China's Worldwide Quest for Energy Security 2000』から〕 おもに国内。 |
| 企業 |