Lin,B.-Q. and Liu,J.-H.(2010): Estimating
coal production peak and trends of coal imports in China.
Energy Policy, 38, 512-519.
『中国における石炭生産ピークの見積りと石炭輸入の傾向』
『Abstract
More than 20 countries in the world have already reached a maximum
capacity in their coal production (peak coal production) such
as Japan, the Unite Kingdom and Germany. China, home to the third
largest coal reserves in the world, is the world's largest coal
producer and consumer, making it part of the Big Six. At present,
however, China's coal production has not yet reached its peak.
In this article, logistic curves and gaussian curves are used
to predict China's coal peak and the results show that it will
be between the late 2020s and the early 2030s. Based on the predictions
of coal production and consumption, China's net coal import could
be estimated for coming years. This article also analyzes the
impact of China's net coal import on the international coal market,
especially the Asian market, and on China's economic development
and energy security.
Keywords: Peak coal; Logistic curves; China's net import of coal』
1. Introduction
2. Background
2.1. Reserves
2.2. Production
2.3. Consumption
2.4. Export and import
3. The concept of peak coal
4. Methodology
4.1. Logistic growth model
4.2. Gaussian model
5. Coal peak of China
5.1. The estimated results
5.2. The sensitivity analysis for the URR
6. Trends of China's net import of coal and the impact
6.1. The trends of China's net import of coal
6.2. The impact of China becoming a net coal importer
7. Conclusions and policy suggestions
Acknowledgements
References

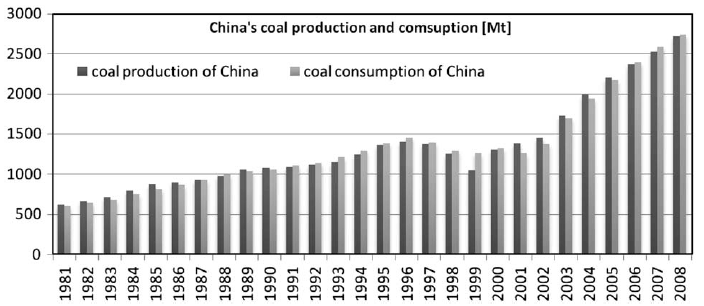
Fig. 1. Trends for China’s coal production and consumption.
Source: National Bureau of Statistics of China China Energy
Statistical Yearbook.

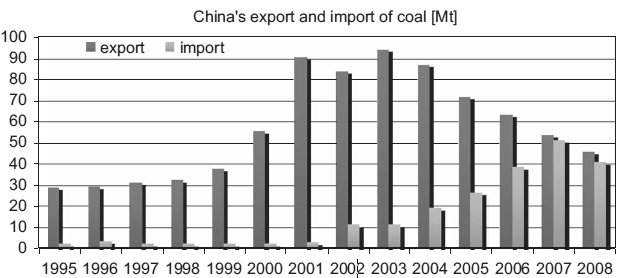
Fig. 2. Trends of coal export and import. Source: General
Administration of Customs of the People’s Republic of China.

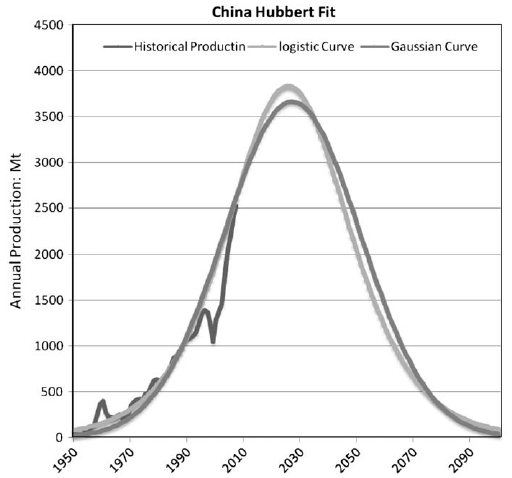
Fig. 4. The coal peak of China. Source: National Bureau
of Statistics of China.
Lin & Liu(2010)による『Estimating
coal production peak and trends of coal imports in China』から |
表3 詳細な結果とSTELLAモデルとの比較
|
モデル |
単位 |
ロジスティック曲線 |
ガウス曲線 |
STELLA |
|
埋蔵量 |
億トン |
1886 |
1886 |
シナリオ1 |
シナリオ2 |
シナリオ3 |
|
tmax(ピーク年) |
西暦年 |
2025 |
2027 |
2033 |
2029 |
2027 |
|
Pmax(ピーク埋蔵量) |
億トン |
38.30 |
36.65 |
33.39 |
37.84 |
42.29 |
表4 URR(究極可採埋蔵量)における変動の感度分析結果
|
モデル |
埋蔵量 |
2086 |
1986 |
1886 |
1786 |
1686 |
1145 |
|
ロジスティック成長曲線 |
ピーク生産量(億トン) |
41.31 |
39.85 |
38.30 |
37.08 |
36.35 |
30.46 |
|
ピーク年 |
2027 |
2026 |
2025 |
2024 |
2023 |
2016 |
|
ガウス成長曲線 |
ピーク生産量(億トン) |
38.51 |
37.58 |
36.65 |
35.72 |
34.79 |
30.10 |
|
ピーク年 |
2029 |
2028 |
2027 |
2026 |
2025 |
2017 |
表5 中国の石炭輸入の予測(億トン)
|
西暦年 |
石炭需要量 |
石炭生産量 |
石炭純輸入量 |
|
低 |
中 |
高 |
低 |
中 |
高 |
|
2010 |
29.4 |
30.1 |
31 |
29.17 |
0.29 |
0.99 |
1.89 |
|
2015 |
34.7 |
37.0 |
39.4 |
34.00 |
1.03 |
3.33 |
5.73 |
|
2020 |
40.1 |
44.3 |
48.9 |
37.67 |
3.14 |
7.34 |
11.94 |
|
2025 |
43.5 |
49.9 |
57.0 |
39.47 |
5.20 |
11.60 |
18.7 |
|
2030 |
48.4 |
57.5 |
68.0 |
39.01 |
11.00 |
20.10 |
30.6 |
表6 2015年と2030年における石炭純輸入量と世界石炭貿易でのその割合
|
西暦年 |
世界石炭貿易*(億トン) |
中国の石炭純輸入量(億トン) |
世界石炭貿易の石炭輸入割合(%) |
|
低 |
中 |
高 |
低 |
中 |
高 |
低 |
中 |
高 |
|
2015 |
9.25 |
13.74 |
16.63 |
1.03 |
3.33 |
5.73 |
11 |
24 |
34 |
|
2030 |
27.04 |
43.14 |
57.12 |
11.00 |
20.10 |
30.60 |
41 |
47 |
54 |
|
* 世界石炭貿易のデータは、本論文の石炭輸入予測に従って、EIAによるIEO
2008の世界石炭貿易を修正したものから得られた。 |
ホームへ


