ホーム<地球科学一般|地質学関連|鉱物学関連||地球環境学<
|
最終更新日:2017年1月27日
リンク|Fe−S|フランボイド|Fe−O|Fe-Ti-O|磁性|
※Fe-S-O(-Ti)を含む鉱物リストはこちらを参照。
鉄(Fe)−硫黄(S)−酸素(O)系の鉱物は、自然環境に普遍的に存在する。Fe-S系ではFeS2(黄鉄鉱、pyrite:白鉄鉱、marcasite)とFe1-xS(磁硫鉄鉱、pyrrhotite)が主要であり、Fe-O系ではFe2O3(赤鉄鉱、hematite)とFe3O4(磁鉄鉱、magnetite)が主要である。ただし、地表環境では水酸化鉄〔針鉄鉱(goethite:α-FeO(OH))がもっとも多いと予想される〕がもっともポピュラーではあるが、細粒ないし非晶質に近いために同定は簡単ではない。ここでは、代表的な鉱物についての情報を集めている。 |
|
|||
資源関連 |
|
生物関連 | その他 |
|
|||
リンク |
鉄−硫黄 |
|
鉄−硫黄−酸素 | その他 |
硫化鉄(Fe-S)| |
酸化鉄(Fe-O)| Fe-Ti-O| |
硫酸鉄| |
磁性| その他 |
《磁硫鉄鉱》〔pyrrhotite:化学式Fe7S8のものは単斜晶系の構造を持つ強磁性鉱物(ferrimagnetic)〕
《トロイライト》〔troilite:主に隕石中に生じている(金属鉄に伴うことが多い)、antiferromagnetic 〕
《グリグ鉱》〔グレイジャイト、greigite:強磁性鉱物(ferrimagnetic)〕
|
《磁鉄鉱》(マグネタイト、magnetite:Fe3O4、ferrimagnetic)
《赤鉄鉱》(ヘマタイト、hematite:α-Fe2O3、canted antiferromagnetic)
《マグヘマイト》(マグヘマイト、磁赤鉄鉱、maghemite:γ-Fe2O3、ferrimagnetic)
《針鉄鉱》(しんてっこう、ゲータイト、ゲーサイト、goethite:α-FeOOH、antiferromagnetic、weak ferromagnetic)
《鱗鉄鉱》(りんてっこう、レピドクロサイト、lepidocrocite:γ-FeOOH、antiferromagnetic with a small ferromagnetic-like behavior(Guyodo et al., 2007))
《フェロオキシハイト》(feroxyhyte:δ-FeOOH、ferrimagnetic)
|
【Fe-Ti-O】(Ulvospinelはantiferromagnetic、Ilmeniteはantiferromagnetic)
Fe−S |
FIGURE 1-3. Thermochemistry of pyrrhotite (at 1bar). The composition of pyrrhotite at high temperatures depends on fS2 and T, shown as isopleths of x values in Fe1-xS (gray, Toulmin and Barton 1964; Rau 1976). The pyrrhotite stability field is bounded by reactions forming iron (low fS2) and pyrite (high fS2). Pyrrhotite can undergo reactions with oxides and these can be used to formulate fS2 buffers, exemplarily shown for the fayalite-magnetite-quartz-pyrrhotite (Fa+Mag+Qz+Po) buffer (red dashed line, after Eggler and Lorand 1993). The buffer curve results from the intersection of equivalent fO2 isobars that relate to two basic reactions: Fe2O3 (Mag) + S2. 2FeS (Po) + 1.5O2 (blue isobars) and Fe2SiO4 (Fa) + S2 . 2FeS (Po) + SiO2 (Qz) + O2 (green isobars). The isobars are derived by relating the activity of FeS in Fe1-xS for given reaction, temperature, and fO2 to the x value and fS2 using the relations of Toulmin and Barton (1964) and Rau (1976). |
FIGURE 2-3. SEM-BSE images of the studied pyrrhotites. (a) Sta. Eulalia (EUL) showing two sets of dark exsolution lamellae of 4C-pyrrhotite in a matrix of NC-pyrrhotite. Adjacent dark areas are also 4C-pyrrhotite. (b) Nyseter (NYS) displaying two sets of dark 4C-pyrrhotite exsolution lamellae in NC matrix. (c) Tysfjord (TYS) displaying a single set of bright troilite (2C-pyrrhotite) exsolution lamellae parallel to (001). Faint lines and striations in (a-c) are artifacts from polishing and high detector gain. (d) Accumulated BSE image of TYS and extracted intensity profile showing dark haloes around troilite lamellae. Although the spatial extent of the BSE generating region causes a considerable convolution of the image, a clear low in backscattered intensity is visible around the lamella, pointing to an approximately 1 μm wide Fe depleted diffusion zone. |
FIGURE 2-7. SDF-TEM images obtained using the diffraction conditions shown in Fig. 2-6. (a) Sample EUL showing parallel and slightly undulating APBs imaged as dark stripes. (b) Sample NYS showing thicker dark stripes that are irresolvable doublets of two APBs. Arrows indicate areas in which stripe configuration is analogous to (a). Disorder of APB spacings and orientations is higher than in EUL. (c) Sample EUL. Interface between NC- and 4C-pyrrhotite showing termination of APBs in eightfold node structures. The behavior of APBs as doublets is apparent. (d) Sample NYS. Interface between NC- and 4C-pyrrhotite showing the same type of node structures as seen in EUL. Arrows indicate changes in configuration of APB doublets. (e) Sample EUL. Interface between NC- and 4C-pyrrhotite subparallel to (001). An eightfold node structure is seen within the APB stripes and the outermost APB doublet tilts away into the adjacent 4C-pyrrhotite. (f) Sample EUL. 4C lamella parallel to (001) with a large block of APBs tilting away from adjacent NC-pyrrhotite. |
FIGURE 3-2. Simplified, low temperature phase diagram of the Fe-S system based on Nakazawa and Morimoto (1970) and Kissin and Scott (1982). Many of the phase boundaries are tentative and shown dashed. 2C, 4C, 5C, 11C, 6C designate pyrrhotite superstructures with their c-dimension multiplicity of the fundamental NiAs-type cell. 2C is troilite, 4C is monoclinic pyrrhotite (Fe7S8 or Fe0.875S). 5C, 11C, and 6C are ‘hexagonal’ pyrrhotites (Fe9S10, Fe10S11, and Fe11S12, respectively). NC designates pyrrhotites with variable and often non-integral c dimension superstructure multiplicity, N values are given as dotted lines (Nakazawa and Morimoto 1970). 4.85C is a NC-pyrrhotite with non-integral multiplicity that commonly coexists with 4C-pyrrhotite at room temperature (Harries et al. 2011). MC- and NA-pyrrhotites are high temperature superstructures. 1C-pyrrhotite has completely disordered vacancies and a NiAs-type unit cell. |
FIGURE 4-1. (a) SEM-BSE image of EUL pyrrhotite. 4C-pyrrhotite forms exsolution lamellae in NC-pyrrhotite (N = 4.81.4.87) and occurs along fractures parallel to (001), likely due to pre-ferred nucleation. (b) SEM-BSE image of DAL pyrrhotite. Here the exsolution relationship is re-verse and NC-pyrrhotite (N = 4.90-4.92) occurs as small lamellae in 4C-pyrrhotite. (c) SDF-TEM image of a NC lamella in DAL pyrrhotite obtained using the preparation and imaging procedures described in Harries et al. (2011). Dark stripes in the NC portion are double filled iron layers, being equivalent to anti-phase domain boundaries (APBs), which terminate in complex node structures at the phase interface (cf. Harries et al. 2011). |
FIGURE 4-6. 3D topometry of pyrrhotite surfaces reacted in H2O2+H2SO4 solution at 35℃. (a) Detail of EUL {110} surface reacted for 13 hours at pH 2.05. The NC matrix dissolved faster than the 4C lamellae. (b) EUL {110} surface reacted for 44.3 hours at pH 2.90. 4C lamellae dissolved faster than the NC matrix and the total relief height is about one order of magnitude smaller compared to (a). Faint, parallel striations on the 4C surfaces are twin domains that reacted at slightly different rates. Non-parallel striations crossing the entire field of view are scratches from polishing. (c) DAL {110} surface reacted for 13 hours at pH 2.05. NC lamellae dissolved faster than the 4C matrix. (d) DAL {110} surface reacted for 44.3 h at pH 2.92. The 4C matrix dissolved faster than the NC lamellae. |
Harries(2012)による『Structure and Reactivity of Terrestrial and Extraterrestrial Pyrrhotite』から |
Note: pm - paramagnetic. afm - antiferromagnetic. fm - ferrimagnetic. [1] Nakazawa andMorimoto (1971) [2] Kissin and Scott (1982) [3] Morimoto et al. (1970) [4] Evans (1970) [5] Skala et al. (2006) [6] Fleet (2006) [7] Koto et al. (1975) [8] Francis and Craig (1976) [9] Nakano et al. (1979) [10] Keller-Besrest et al. (1982) [11] Bertaut (1953) [12] Tokonami et a;. (1972) [13] Powellet al. (2004) [14] Clark (1966). |
Figure 2.8: Phase diagram for the system FeS to FeS2 representing stability fields of various pyrrhotite superstructures discussed in the text. From: Wang and Salveson (2005) and references therein. |
Figure 2.10: (a) Illustration of the vacancy structure in 4C magnetic pyrrhotite in the sequence AFBFCFDFA and based on the space group F2/d. (b) Illustration of the proposed vacancy structure for 5C pyrrhotite adapted from Vaughan et al. (1971). Sulfur sites are omitted for clarity. |
|
Becker(2010)による『The mineralogy and crystallography of pyrrhotite from selected nickel and PGE ore deposits and its effect on flotation performance』から |
Known Pyrrhotites
|
Compositional Variation . 1106 Analyses |
New Pyrrhotite structures
|
NiAs Structure Troilite−FeS (stoichiometric) |
Non-stoichiometry
|
|
de Villiers(2009/6)による『The Composition and Crystal Structures of Pyrrhotite: A Common but Poorly Understood Mineral』から |
第1図 磁硫鉄鉱(FeS-Fe7S8)超構造相の相関係 中沢(1980)による『磁硫鉄鉱(Fe1-xS)の相関係と変調構造』から |
Fig. CS-1. Relations among condensed phases in the system Fe-S above 400℃. (From Ehlers, 1972, after Kullerud, 1967 The Interpretation of Geological Phase Diagrams, Fig. 217, p. 232). |
Fig. CS-3. Relations among condensed phases in the central portion of the Fe-S system below 350℃. (Kissin, 1974, modified from Scott and Kissin, 1973). |
Scott(1974)による『THE Fe-S SYSTEM』から |
フランボイド(framboid) |
Rust (1935)* が、木苺(きいちご)状(raspberry-like)の黄鉄鉱(pyrite)集合体に対してフランス語の『framboise』という用語を用いて以降、フランボイダル黄鉄鉱(framboidal
pyrite)はさまざまな環境から報告されるようになった。また、黄鉄鉱以外にも、グリグ鉱(グレイジャイト、greigite)や磁鉄鉱などの他の鉱物からなるフランボイド(framboid)も知られるようになった。
フランボイドの大部分は地表環境で生成しており、コロイド(colloid)からの結晶成長が主要なメカニズムとされているが、その場合はファンデルワース力(Van
der Waals force)と電気的力(電気二重層)が主体(DLVO理論)であると考えられるが、強磁性の物質であれば磁力の影響の方が大きいと予想される。フランボイダル黄鉄鉱の生成過程として、コロイド状硫化鉄→FeS様物質〔非晶質〜隠微晶質:マッキーノ鉱(mackinawite)類似物質?〕→グリグ鉱(Fe3S4)→黄鉄鉱FeS2)を主要なものとすれば、グリグ鉱の持つ強磁性的性質が重要な役割を示していると考えられる。
【リンクはウィキペディア】
* Rust G. W. (1935): Colloidal primary copper ores
at Cornwall mines, southeastern Missouri. J. Geol.
43, 398-426.
【参考】Colloidal primary copper ores at Cornwall
mines, southeastern Missouri http://www.jstor.org/discover/10.2307/30061313?uid=25570&uid=3738328&uid=2129&uid=2&uid=70&uid=3&uid=67&uid=62&uid=25569&sid=21102919805443
図1 フランボイダルパイライトの走査電子顕微鏡像.A)完新世泥層中の試料. B), C), D)古生代の黒色頁岩中の試料(破断面).17) マイクロクリスタルは異なる集合状態を示す. B), C)規則充填(面心立方配置),D)不規則充填. |
図2 マイクロクリスタルの規則配列構造.A)立 方パターン. B)六方パターン, C)三次元充填構造(面心立方充填)の模式図. 異なる方位から眺めると, A), B)に示す二次元パターンが得られることがわかる. |
図3 マイクロクリスタルのドメイン構造と20 面体充填.A)三回対称パターン. B)5 回対称パターン, 黒色, 白色にハッチ掛けした部分においてマイクロクリスタルは, それぞれ立方パターン, 六方パターンで規則配列をなす. C)20 面体構造の模式図. 頂点で角を共有する20 個の4 面体ユニットよりなり, ユニット内ではマイクロクリスタルは面心立方充填をなす. 右に示したのは3 回,5 回対称軸に垂直な断面における各ユニット境界.上の写真とよく一致する. |
図7 パイライト結晶の形態的特徴に基づいた対称性(A)と結晶構造に基づいた対称性(B).A形態のうえでは,<100>方向に4 回の対称性を有するが, 構造上はS-S ダンベルペアの存在により2 回の対称性しか示さない. |
大藤(2011)による『フランボイダルパイライト−天然における鉱物の不思議な自己組織化作用−』から |
Wilkin & Barnes(1997)による『Formation processes of framboidal pyrite』から |
FIG. 2. Histograms showing the size frequency of pyrite framboids in sediments from the Great Salt Marsh (oxic) and Black Sea (euxinic) as a function of depth below the sediment-water interface. Unfilled bars indicate the frequency of framboids that show evidence of secondary growth or "infilling" (see Fig. 1 ). |
|
|||||||||||||||||||||||||||||||||||||||||||||||||||||||||||||||||||||
FIG. 4. Relationships between framboid diameters (D) and microcrystal diameters (d) in (a) Black Sea sediments (30 cm) and (b) Great Salt Marsh sediments (27 cm). The data points represent the scaled abundance (i.e., <2%, 2-10%, or >10%) of framboids with a particular diameter comprised of microcrystals with a particular diameter. The numbers in parentheses, corresponding to the given value of D/d in boldface type, are equal to the number of microcrystals present calculated with Eqn. 1 (φ= 0.74), e.g., all framboids with D/d = 5 contain 〜93 microcrystals. |
FIG. 7. Microcrystal and framboid size distribution plots of four samples (see Table 5 for regression coefficients). |
|||||||||||||||||||||||||||||||||||||||||||||||||||||||||||||||||||||
Wilkin et al.(1996)による『The size distribution of framboidal pyrite in modern sediments: An indicator of redox conditions』から |
Fig. 2. Hypothetical pathways for the formation of euhedral pyrite via framboids |
Fig. 4. Idealized diagram showing various orders of size and complexity of pyrite framboids and their tendency towards the formation of euhedra |
Sawlowicz(1993)による『Pyrite framboids and their development: a new conceptual mechanism』による |
Fe−O |
Iron oxides - A short overview Cornell & Schwertmann (2003) |
Ferrihydrite junctions Cornell & Schwertmann (2003) |
Bolanz(2011)による『The transformation of ferrihydrite into goethite, hematite and feroxyhyte in the presence of Sb(V), As(V), and P(V)』から |
Fig. 14. Pathways of iron oxide formation in pedogenic environments (adapted from Schwertmann and Taylor, 1987). Iron-reducing bacteria are likely to be involved at many of the reduction/dissolution steps (also see Fig. 15). |
Fig. 15. Eh-pH stability fields for iron compounds, together with preferred redox/pH ranges for the major groups of iron-oxidising (eg. Thiobacillus f., Leptothrix, Gallionella) and iron-reducing bacteria (Shewanella, Geobacter). After Zavarzina, 2001. (注) 図の左上のFeはFe3+の間違い。 |
Maher et al.(2003)による『Magnetic mineralogy of soils across the Russian Steppe: climatic dependence of pedogenic magnetite formation』から |
図2.1.1 一般的な鉄鉱物の生成経路 東北大学・核燃料サイクル開発機構東海事業所(2002/5)による『固体−水相互作用の下での金属含水酸化物の沈殿・結晶化の速度機構』から |
Figure 5 f(O2) vs. pH iron stability diagram at 25℃ and 1 bar showing the natural domains of the main groups of iron oxidizing bacteria recalculated from an Eh-pH diagram in Lundgren and Dean. Activities of dissolved iron, carbonate, and sulfur species are 10-6, 10° and 10-6, respectively, from Garrels and Christ. The boundary between Fe3+ and Fe2+ which is missing in the Lundgren and Dean diagram, has been added here. Other thermodynamic databases suggest the presence of FeHCO+3 supplanting siderite between 6.4 and 7.0 pH and acetates supplant other phases and species below -75 logf(O2). |
Figure 6. Change in stability boundaries in Fe-O-H system with age of the amorphous iron oxyhydroxides at 25℃, 240 bar and [Fetotal] = 3.9 × 10⁻⁵ m calculated and based on the physical and geochemical conditions of the Franklin Seamount vent fluid reported in ref. 5. (1) Freshly precipitated Fe(OH)3, ref. 36. (2) 4-day old Fe(OH)3, ref. 39 and 40. (3) Aged Fe(OH)3, ref. 39. (4) Age of Fe(OH)3 unknown, ref. 25. Thermodynamic data for Fe3(OH)8 is for freshly precipitated material. Calculated with aid from SUPCRT92 program. |
Figure 7. Phase equilibria of freshly precipitated oxyhydroxides in the Fe-Si-O-H system (1) from Fig. 6 at 25℃, 240 bar, [Fetotal] = 3.9 × 10⁻⁵ m and [Si] = 3.4 × 10⁻⁴ m which are the physical and geochemical conditions of a vent fluid at Franklin Seamount and at higher temperatures. Calculated and based on the reactions in Table 3 which are drawn from the thermodynamic databases of Sadiq and Lindsay for Fe2+ and Fe3(OH)8, Langmuir for Fe(OH)3, and Winters and Buckley for FeSiO3. The stability fields (*) of iron bacteria from Fig. 5 are at 25℃. Dashed lines show change in Fe2+-Fe3(OH)8-Fe(OH)3 boundaries with increase in temperature. Faint line based on the SUPCRT92 database for the dissociation of water plotted to show the sensitivity of the Fe(OH)3-Fe3(OH)8 boundary to minute changes in Gibbs free energies. Calculated with aid of SUPCRT92 program. The arrow represents the upward extrapolation to the Fe2+-solid phases boundaries of the measured pH (6.26) of the 20-30℃ vent fluid at Franklin Seamount. |
Figure 8. Various possible biotic and hydrothermal processes at an iron oxyhydroxide chimney on the seafloor. |
Figure 10. Phase equilibria of ancient iron-formation at 25℃ in the Fe-Si-O-H system using composition of Franklin Seamount vent fluid ([Fetotal] = 3.9 × 10⁻⁵m and [Si] = 3.4 × 10⁻⁴m). (1) Boundaries based on free energy data from Klein and Bricker. Fe3(OH)8 has converted to Fe3O4 while Fe(OH)3 persists unstably (see text). (2) Boundaries based on Fe3O4 in equilibrium with Fe2O3. Closed square represents location of Franklin Seamount vent fluid from Fig. 7. |
|
Boyd & Scott(2001)による『Microbial and hydrothermal aspects of ferric oxyhydroxides and ferrosic hydroxides: the example of Franklin Seamount, Western Woodlark Basin, Papua New Guinea』から |
Fe−Ti−O |
Fig. 1.3.: (a) Structure symmetry and magnetic phase-diagram of hemo-ilmenite solid solutions. (b) Change of unit cell volume with composition x. [65,66] Charilaou(2012)による『Magnetic thermodynamics in the FeTiO3-Fe2O3 system: experiment and modeling』から |
Fig. 2. Lattice parameter a of the xFe2TiO4-(1-x)Fe3O4 (0≦x≦1) pseudo-binary system as a function of the Fe2TiO4 molar fraction of x. Sorescu et al.(2012)による『Studies on Structural, Magnetic and Thermal Properties of xFe2TiO4-(1x)Fe3O4 (0≦x≦1) Pseudo-binary System』から |
Fe-Ti oxide ternary diagram
Shaar(2012/2)による『Magnetic mineralogy SIO 247』から |
Figure 2. Lattice constants a and c of the xFeTiO3-(1-x)Fe2O3 films on α-Al2O3(001) as a function of the ilmenite concentrations x. |
Figure 4. Lattice constants a and c of the xFeTiO3-(1-x)Fe2O3 films on α-Al2O3(110) as a function of the ilmenite concentrations x. |
Fujii et al.(2010)による『Structure and magnetic properties of Fe2O3-FeTiO3 films』から |
Fig. 6. Scheme of the distribution of Fe and Ti cations in the crystalline tetrahedral (A) and octahedral (B) sublattices of the titanomagnetite for the Akimoto (up) and the N´eel(最初のeの頭に´)-Chevallier (bottom) models (scheme was taken from Kropacek(aの頭に´、cの頭にv), 1986). Orlicky(yの頭に´)(2010)による『Magnetism and magnetic properties of Ti-rich titanomagnetite and its tendency for alteration in favour of titanomaghemite』から |
Figure 3.9: (a) c/a-ratio (b) volume and (c) formation energy (eV/f.u) versus ilmenite concentration xIlm for Fe2-xTixO3 strained at the Al2O3 (red/dark grey), Fe2O3 (grey) and FeTiO3 (black) lateral lattice constants. Circles (triangles) denote compensation involving Ti4+(Ti3+). Open/filled symbols refer to solid solutions (SS)/ layered configurations (L). Horizontal lines mark the bulk c/a ratio and the volume of the end members and Al2O3. Red (dark grey) squares indicate experimental data from Takada et al. [92]. Nabi(2010/2)による『Microscopic origin of magnetism in the hematite-ilmenite system』から |
Figure 4. The variation of the a-parameter vs. ulvospinel(oの頭に¨) content (expressed as Ti pfu) can be described by an S-shaped curve (cubic regression). In contrast to the literature, which explains this variation by non-stoichiometry, the present titanomagnetites are stoichiometric. Symbol dimensions are proportional to 2σ. |
Figure 5. Variation of the Fe content at the T and M sites with Ti. Note the S-shaped form of the trends and their deviations from the Akimoto model (dashed lines). Symbol dimensions are proportional to 2σ. |
Bosi et al.(2009)による『Crystal chemistry of the magnetite-ulvospinel(oの頭に¨) series』から |
FIG. 3. x dependence of (a) lattice constants a (open triangles) and c (open circles) and (b) unit cell volume of Fe2-xTixO3 films. The solid lines represent the linear interpolation between the unit cell parameters of α-Fe2O3 and FeTiO3 bulk crystals, which follow Vegard’s law. Takeda et al.(2008)による『Preparation and characterization of epitaxial Fe2-xTixO3 films with various Ti concentrations (0.5<x<1.0)』から |
Figure 3 Alteration in the FeO-Fe2O3-TiO2 ternary system. From O’Reilly [1984]. |
Figure 9 T-fO2 for coexisting magnetite-ilmenite solid solution pairs. [Spencer and Lindsley, 1981] |
Figure 13 Effect of ulvospinel(oの頭に¨) content on the magnetite cell lattice parameter. [O’Reilly, 1984] |
Figure 14 Variation in the magnetite lattice parameter with ulvospinel(oの頭に¨) content and oxidation. Top: Akimoto [1957]. Bottom: O’Reilly [1984] |
Storrick(1993)による『4.0 GEOCHEMISTRY OF IRON-TITANIUM OXIDES』から |
磁性 |
|
|
|
|
||||
|
磁石につく(○)/つかない(×) | ||||||
鉄の硫化鉱物 硫化鉄の『リンク』はこちらを参照。 |
黄鉄鉱(おうてっこう) (パイライト) |
pyrite | FeS2 | 等軸晶系 | paramagnetic(常磁性) | × | |
白鉄鉱(はくてっこう) | marcasite | FeS2 | 斜方晶系 | × | |||
磁硫鉄鉱 (ピロータイト) |
pyrrhotite | Fe1-xS |
Fe9S10 Fe10S11 Fe11S12 |
六方晶系 | antiferromagnetic(反強磁性) | × | |
Fe7S8 | 単斜晶系 | ferrimagnetic(フェリ磁性) | ○ | ||||
トロイリ鉱 (トロイライト) |
troilite | FeS | 六方晶系 | antiferromagnetic(反強磁性) | × | ||
グリグ鉱 (グレイジャイト) |
greigite | Fe3S4 | 等軸晶系 | ferrimagnetic(フェリ磁性) | ○ | ||
スマイス鉱 | smythite |
Fe3+xS4、 (Fe,Ni)9S11 or (Fe,Ni)13S16 |
六方晶系 | ferromagnetic(フェロ磁性、強磁性) | ○ | ||
マッキーノ鉱 | mackinawite |
(Fe,Ni)1+xS、 (Fe,Ni)9S8 |
正方晶系 | antiferromagnetic(反強磁性) | × | ||
鉄の酸化鉱物 酸化鉄の『リンク』はこちらを参照。 |
ビュスタイト、 ウスタイト |
wustite(uの頭に¨) | FeO | 等軸晶系 | antiferromagnetic(反強磁性) | × | |
磁鉄鉱 (マグネタイト)〔ウルボスピネルと固溶体〕 |
magnetite | Fe3O4 | 等軸晶系 | ferrimagnetic(フェリ磁性) | ○ | ||
赤鉄鉱(せきてっこう) (ヘマタイト) 〔チタン鉄鉱と固溶体〕 |
hematite | α-Fe2O3 | 三方晶系 |
canted antiferromagnetic (傾斜反強磁性) |
× | ||
(合成) | β-Fe2O3 | 等軸晶系 | |||||
マグヘマイト (磁赤鉄鉱) |
maghemite | γ-Fe2O3 | 等軸晶系(正方晶系の超格子をもつ) | ferrimagnetic(フェリ磁性) | ○ | ||
(合成) | ε-Fe2O3 | 斜方晶系 | ferrimagnetic(フェリ磁性) | ○ | |||
鉄の水酸化鉱物 (オキシおよび含水も含む) 酸化鉄の『リンク』はこちらを参照。 |
針鉄鉱(しんてっこう) (ゲーサイト、 ゲータイト) |
goethite | α-FeO(OH) | 斜方晶系 |
antiferromagnetic(反強磁性)、 weak ferromagnetic(弱いフェロ磁性) |
× | |
赤金石、 赤金鉱 |
akaganeite(最初のeの頭に´) | β-FeO(OH) |
正方晶系、 単斜晶系 |
antiferromagnetic(反強磁性) | × | ||
鱗鉄鉱(りんてっこう) (レピドクロサイト) |
lepidocrocite | γ-FeO(OH) | 斜方晶系 | antiferromagnetic(反強磁性)(with a small ferromagnetic-like behavior) | × | ||
(シュバートマナイト) | schwertmannite |
Fe8O8(OH)6(SO4)・nH2O、 Fe3+16O16(OH,SO4)12-13・10-12H2O、 Fe3+16O16(OH)12(SO4)2 、 Fe16016(OH)y(S04)z・nH20 |
正方晶系 | ||||
フェロオキシハイト | feroxyhyte | δ-FeO(OH) | 六方晶系 | ferrimagnetic(フェリ磁性) | ○ | ||
フェリハイドライト | ferrihydrite |
5Fe2O3・9H2O、 Fe4-5(OH,O)12、 Fe2O3・0.5H2O、 FeOOH・0.4H20 |
六方晶系、 三方晶系 |
antiferromagnetic(反強磁性)(speromagnetic) | |||
(バナーライト、 バーナライト) |
bernalite |
Fe(OH)3、 Fe(OH)3・nH2O |
斜方晶系 | collinear antiferromagnetic(反強磁性) | |||
green rust⇒ fougerite(最初のeの頭に`) |
Fe2+4Fe3+2(OH)12CO3・3H2O、 (Fe2+,Mg)6Fe3+2(OH)18・4H2O |
三方晶系 | |||||
非晶質 | (amorphous) | × | |||||
鉄とチタンの酸化鉱物(チタン酸化鉱物を含む) Fe-Ti-Oの『リンク』はこちらを参照。 |
チタン鉄鉱 (イルメナイト) |
ilmenite | FeTiO3 | 三方晶系 | paramagnetic(常磁性) | × | |
ウルボスピネル | ulvospinel(oの頭に¨) | Fe2TiO4 | 等軸晶系 | × | |||
擬板チタン石 | psudobrookite | Fe2TiO5 | 斜方晶系 | × | |||
金紅石(きんこうせき)、 ルチル |
rutile | TiO2 | 正方晶系 | × | |||
鋭錐石 | anatase | TiO2 | 正方晶系 | × | |||
板チタン石 | brookite | TiO2 | 斜方晶系 | × | |||
結晶系(Crystal system)は、等軸晶系(立方晶系、Cubic
crystal system)、正方晶系(Tetragonal
crystal system)、三方晶系(菱面体晶系、Trigonal
crystal system)、六方晶系(Hexagonal
crystal system)、斜方晶系(Orthorhombic
crystal system)、単斜晶系(Monoclinic
crystal system)、三斜晶系(Triclinic
crystal system)の7つからなる。 磁性で、antiferromagnetic(反強磁性)に関連する現象のGeometrical frustration(フラストレーション)も参照。 微細な粒子である場合が多い鉱物(とくに水酸化鉱物)では、化学組成および磁性の報告が異なることが多い。ここでは、『リンク』に示した文献から代表的と考えられるものをまとめた。【リンクはウィキペディア】 |
Wikipedia(HP/2013/10)による『Hematite』などから |
Shaar(2012/2)による『Magnetic mineralogy SIO 247』から |
|
|
|
|
|
|
|
|
|
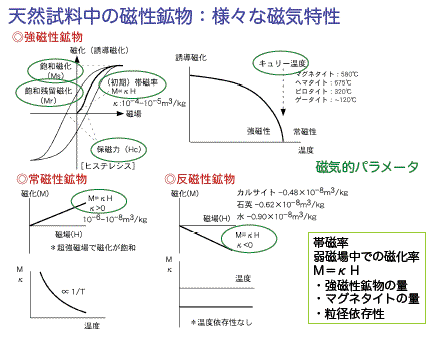
石川(2010)による『環境磁気学』から 体積磁化率:κ=M/H |