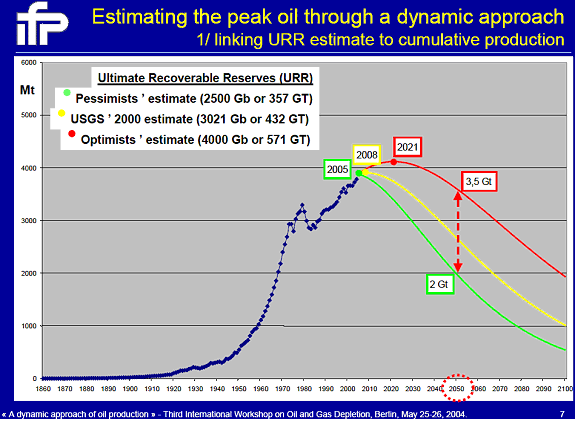
 〔Association for the Study
of Peak Oil&Gas(ASPO)の『Proceedings
of the 石油生産のピークはいつ頃か? |
戻る<1|2|3|4|5|6|7|8|9|10|11|12|13|14|15<
|
|
| 配付プリント等 |
| 補足説明 |
|
般 |
| エネルギー資源 | 化石燃料(石油、石炭、天然ガス、オイルシェール) |
| 放射性物質(ウラン) | |
| 地熱 | |
| 太陽熱・太陽光 | |
| 水(水力) | |
| 風(風力) | |
| バイオマス(燃料木、林産加工廃棄物、都市ゴミ) | |
| 鉱物資源 | 金属(単元素金属まで分離) |
| 非金属 | |
| 生物資源 | 食糧(農作物、畜産物、水産物) |
| 森林(森林生態系も含む) | |
| 水資源 | |
| 土壌資源 | |
|
図2.1 地球資源の分類 エネルギー資源の化石燃料と放射性物質ならびに鉱物資源は本質的に枯渇性(再生不能)資源。その他は非枯渇性(再生可能)資源であるが、今や持続的な再生が困難になりつつあるものが増えてきている。 |
|
| 参考 |
 〔Association for the Study
of Peak Oil&Gas(ASPO)の『Proceedings
of the 石油生産のピークはいつ頃か? |
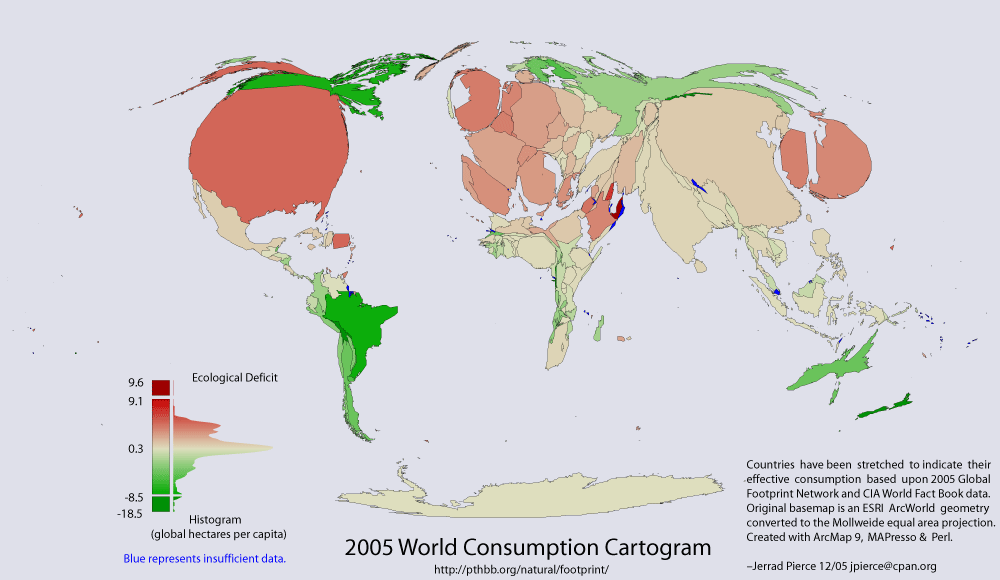
 This thematic map shows two variables; 1) coloration indicates
reserve(green) - deficit(red)1 of national biocapacity
and 2) area indicates absolute consumption of biocapacity.
〔WWFの『News & Facts』の『Publications』の『Key Publications』の中の『Living Planet Report』からリンクされた『Fat Map (external link)』〕
|
 〔E-Square Inc.によるRSBSの中の『サステナビリティの科学的基礎に関する調査』の『サマリーレポート』から〕
|