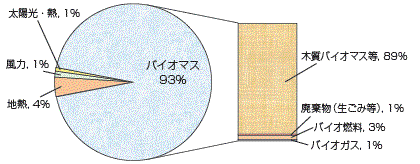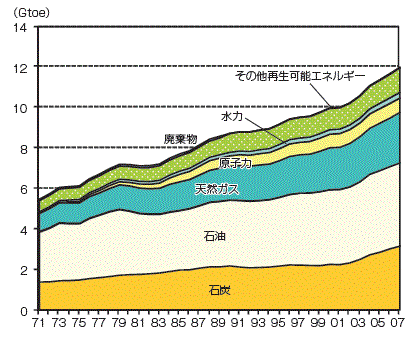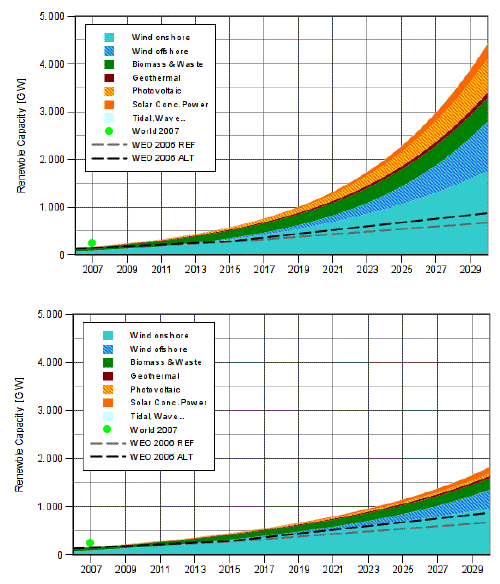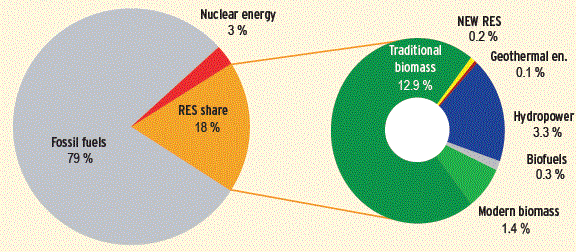
Structure of global final energy consumption, 2006〔最終エネルギー消費の内訳:RESは再生可能エネルギー、伝統的バイオマス(薪など)・水力・現代のバイオマス(廃棄物など)・バイオ燃料・新再生可能エネルギー(風力・太陽光・海洋エネルギーなど)・地熱の順〕
The global final energy share is higher than the
global primary energy share. This is partly due to traditional
biomass, all of which represents final energy consumption. Furthermore,
the level of primary energy share also depends on the method
used to calculate the primary energy equivalent of renewable
energy sources, cf. Appendix, para 5, 11 and 12.
New RES = Wind, solar and ocean energy:Source: according to REN21
[33]
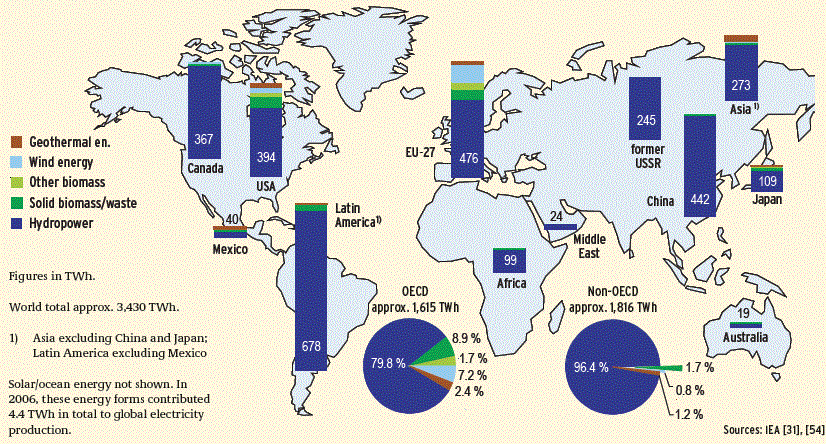
Electricity generation from renewable energy sources in various
regions, 2006(再生可能エネルギーによる発電量)
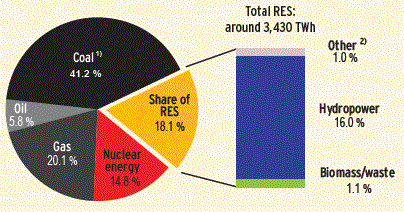
Share of renewable energy sources in global electricity generation,
2006〔発電における再生可能エネルギーのシェア:水力・バイオナス/廃棄物・その他の順。ここでは、薪のような伝統的なバイオマスは含まれていない。〕
At 16 %, global electricity generation from hydropower
is higher than that from nuclear energy (14.8
%). Looking at the PEC shares, this ratio
is inverted, with nuclear energy providing a considerably higher
share of PEC at 6.2 % than hydropower at 2.2 %. The reason for
this distortion is that according to international agreements,
electricity from uclear power is rated at an average conversion
effi ciency of 33 % in relation to primary energy, while electricity
from hydropower is rated at a conversion effi ciency of 100 %
according to the so-called physical energy content method; cf.
Appendix, para. 5.
1) Includes non-renewable portion of waste (0.2
%)/2) Geothermal energy, solar energy, wind
energy, ocean energy:Sources: IEA [31], [54]
Federal Ministry for the Environment, Nature Conservation
and Nuclear Safety (BMU)(2009)による『Renewable
Energy Sources in Figures National and International Development』から |
/Image50.gif)
/Image53.gif)
/Image54.gif)
/Image55.gif)
/Image52.gif)
/Image51.gif)
/Image75.gif)
/Image77.gif)
/Image76.gif)
/Image752.gif)
/Image754.gif)
/Image755.gif)
/Image756.gif)
/Image765.gif)
