|
アスベストとは 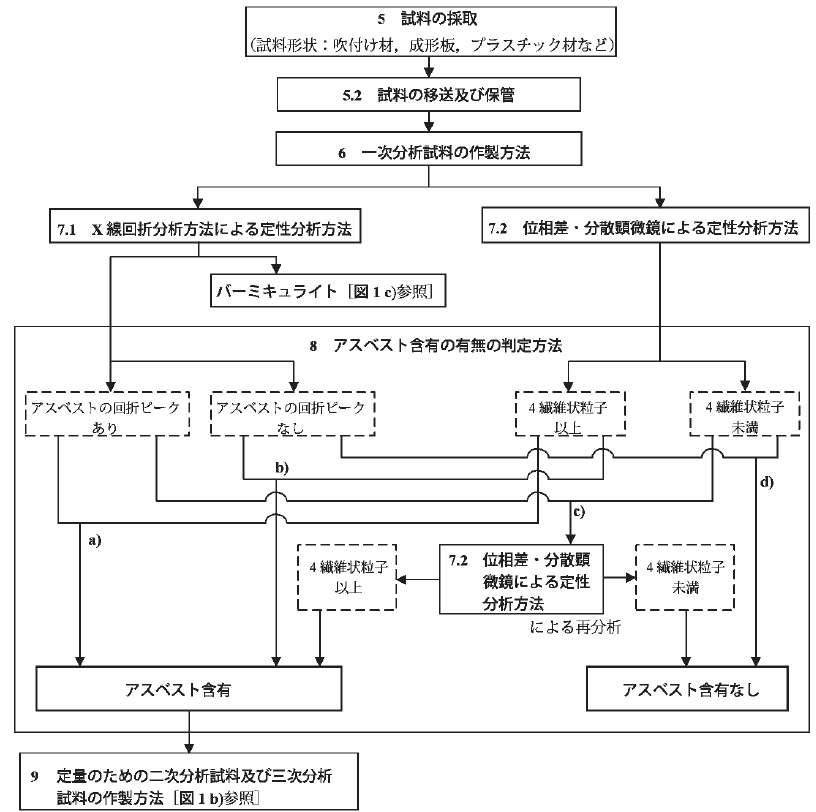 図1 測定方法の概要 a) 建材製品中のアスベスト含有率測定方法フロー(定性分析) 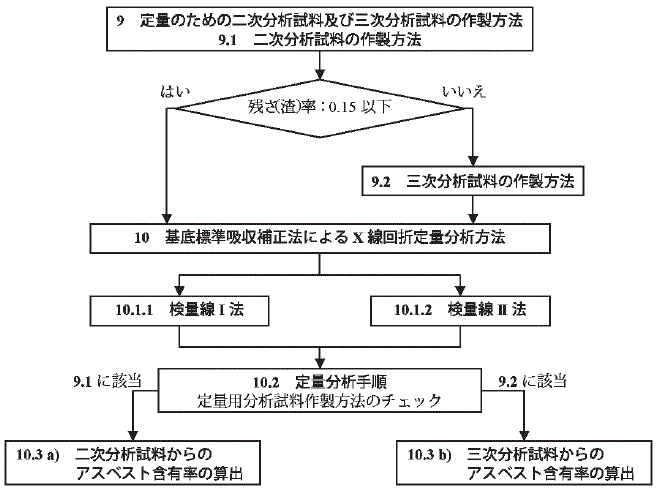 b) 建材製品中のアスベスト含有率測定方法フロー(定量分析) JIS A 1481(2008年:建材製品中のアスベスト含有率測定方法)から |
|
|
最終更新日:2017年3月8日
| 測定法 |
|
アスベストとは  図1 測定方法の概要 a) 建材製品中のアスベスト含有率測定方法フロー(定性分析)  b) 建材製品中のアスベスト含有率測定方法フロー(定量分析) JIS A 1481(2008年:建材製品中のアスベスト含有率測定方法)から |
 NOTE * For crocidolite, the NIST certificate of analysis states: "Because strong absorption in the visible light range results in anomalous dispersion characteristics that would not be useful to the analyst, no certified values of refractive index are reported for riebeckite."   Figure C.1 . Dispersion staining chart for chrysotile in 1.550 RI liquid.  Figure C.2 . Dispersion staining chart for amosite in 1.680 RI liquid.  Figure C.3 . Dispersion staining chart for crocidolite in 1.700 RI liquid  Figure C.4 . Dispersion staining chart for tremolite in 1.605 RI liquid.  Figure C.5 . Dispersion staining chart for actinolite in 1.630 RI liquid.  Figure C.6 . Dispersion staining chart for anthophyllite in 1.605 RI liquid.  Figure C.7 . Dispersion staining chart for richterite/winchite asbestos in 1.630 RI liquid. ISO(2007)による『Bulk materials--Part 1: Sampling and qualitative determination of asbestos in commercial bulk materials』から |
|
4 測定方法の種類 a) 位相差顕微鏡法 b) 位相差・分散顕微鏡法 c) 走査電子顕微鏡法 |
| 分散染色法(Dispersion staining) |
アスベストの測定に用いられる位相差顕微鏡では、リング型スリットをもつリング絞りと、対応するリング型の1/4波長シフト機能と減光機能をもつ位相板とを用いて、直接光に位相のズレを起こし、試料を通過した光(回折光)と直接光の干渉現象を利用して像のコントラストを増大させた観察を行う。光学顕微鏡において、スポット絞り(中央絞り、ピンホール絞り)にして、特別のセントラルストップ(central
stop)板を挿入し〔対物レンズにこのような機能を装着したものは、分散対物レンズと呼ばれる〕、観察する試料の屈折率に近い屈折率をもつ浸液を用いれば、試料特有の屈折率の違いを光の色の違い(波長によって屈折率が異なるため)として観察できる。この方法を分散染色法という。
偏光顕微鏡(PLM)に分散染色用対物レンズ〔セントラルストップ型(背景は暗い:主に屈折光)とアニュラーストップ型(背景は明るい:直接光)とがあるが、前者の方が観察しやすいとされる〕を装着すれば、類似の分散染色を観察できる。さらに、偏光顕微鏡では2枚の偏光板〔下側の固定板はポラライザ(光の振動方向左右/E-W)、上側の挿脱板はアナライザ(光の振動方向前後/S-N)と呼ばれる〕が用いられており、多色性・消光角・伸長の正負などを観察できる。
|
|
1 Becke' Line Dispersion Staining(ベッケ線分散染色) 2 Oblique Illumination Dispersion Staining(斜照明分散染色) 3 Darkfield Illumination Dispersion Staining(暗照明分散染色) 4 Phase Contrast Dispersion Staining(位相差分散染色) 5 Objective Stop Dispersion Staining(対物ストップ分散染色) |
|
位相差・分散顕微鏡は、位相差顕微鏡の対物レンズを分散対物レンズに置き換えた顕微鏡のことです。光が波長によりスペクトルに分解することを分散といいますが、一般に石綿繊維の分散は液体の分散よりも小さいため、ある一定の屈折率を持つ液中では下表に示す特定の石綿から特異的なスペクトル(合成色)が観察できます。これを分散色と呼びます。
(社)日本石綿協会(HP/2010)による『石綿Q&A』から |
|||||||||||||||||||||||||||||||||||
|
<位相差顕微鏡を使用した分散染色分析法による定性分析>
厚生労働省(HP/2010)による資料から |
||||||||||||||||||||||||||||||||||||||||
|
光は、屈折率が異なる媒質を通過する際に分散する性質を持っています。これは、短い波長の光ほど屈折率は高く、長い波長ほど屈折率が低いからです。太陽光がプリズムによって7色に分光されますね。プリズムと空気では屈折率が違うので、その境のところで分散が起こります。 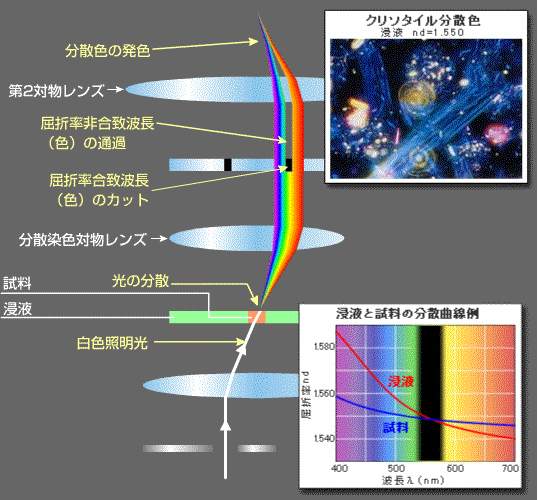 白色照明から分散色の出るまでのプロセス 試料と浸液の屈折率が合致した波長(色)だけが、観察している顕微鏡の光源の色(白色光)から取り除かれ、残った波長の光学的総和としてスペクトルの合成色で観察できる。 ニコン(HP)による『アスベスト測定とNikon』から |
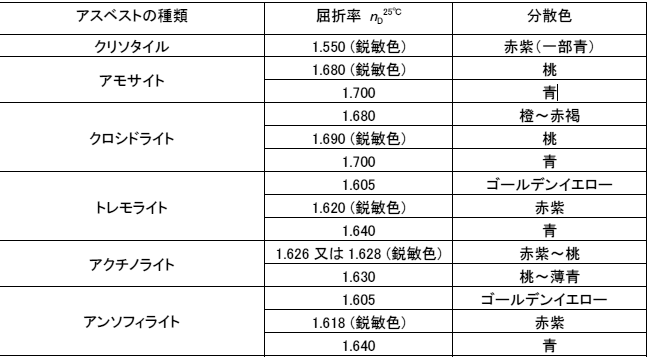 ※1.この表に示した浸液の屈折率と分散色はカーギルオイルを25℃で使用した場合のものであり、他のメーカーの浸液を使用には適用できない場合がある。 ※2.分散染色の色は浸液の温度変化の影響を受けるため、一般的には,25 ℃で観察できるよう顕微鏡用温度制御装置を利用するか,室温を25 ℃に保つなどが簡便な方法である。 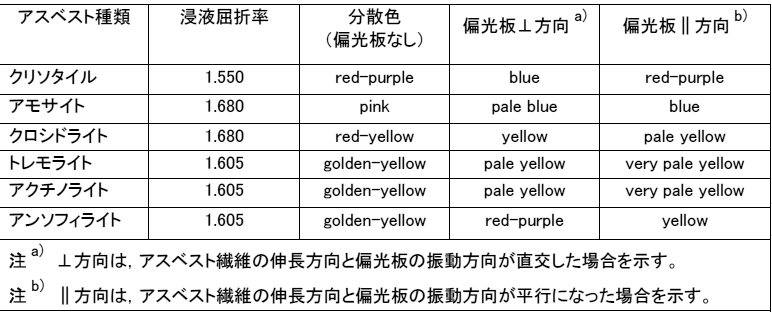 (詳細については参考文献:ASBESTOS IDENTIFICATION 1988 年,McCRONE RESEARCH INSTITUTE を参照) (社)日本作業環境測定協会(2009)による『平成21年度版 厚生労働省委託事業石綿含有建材の石綿含有率測定に係る講習会テキスト』から |
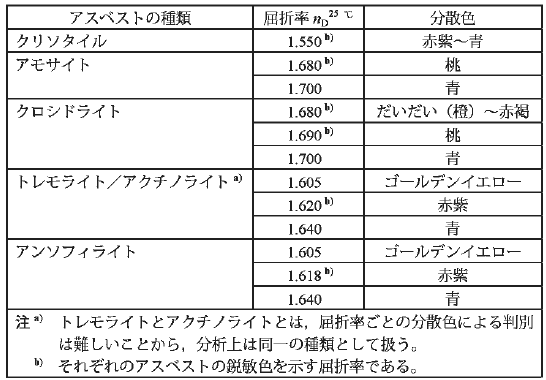 JIS A 1481(建材製品中のアスベスト含有率測定方法)から |
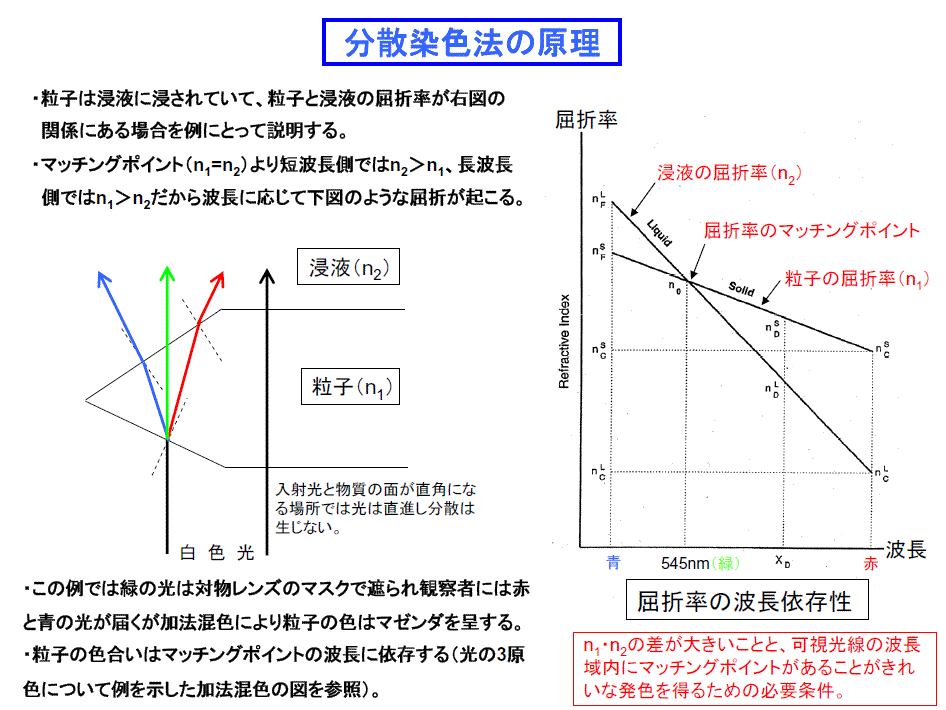 小坂(2008)による『光学顕微鏡法によるアスベスト分析の現状と課題』から |
|
|
crocidolite | amosite | chrysotile | anthophyllite | tremolite | actinolite | ||
|
|
柱状~針状 | 柱状~針状 | 曲がった繊維状のものが多い。枝分かれがある場合あり。 | 柱状~一部針状 | 板状~柱状、一部針状にも。 | 板状~柱状、一部針状にも。 | ||
|
じ 浸 液 屈 折 率 |
浸液 屈折率 |
|
|
|
|
|
|
|
| 分散色 | 黄色~橙色 | 紫~桃色 |
主に赤紫~紫。 青色になることもあり。全体的に暗い。 |
無色~水色 | 水色 | 水色(ほぼ無色) | ||
| 回転偏光板を入れたときの色の変化 | 橙色で明暗あり。 | 青色~黄色 | 橙色~青色 | 青で明暗(ほぼ変化なし) | 水色で明暗(ほぼ変化なし) | 青で明暗(ほぼ変化なし) | ||
| 位相差レンズを用いた場合の見え方 | 青~かすかに黒みがかっている。 | 青みががっている。 | 浸液と,屈折率が近いため,ぼんやりとしている。 |
輪郭がはっきりしている 無色 |
無色 |
輪郭がはっきりしている 無色 |
||
| アモサイト、クロシドライトとの違い | 分散色と消光位 | 分散色 | 分散色 | |||||
|
じ 浸 液 屈 折 率 |
浸液 屈折率 |
|
|
|
|
|
||
| 分散色 | 青色 | 青色 | 無色~水色 | 無色(分散色が出ない) | 無色(分散色が出ない) | |||
| 回転偏光板を入れたときの色の変化 | 青色で明暗 | 青色で明暗 | 青で明暗(ほぼ変化なし) | |||||
| 位相差レンズを用いた場合の見え方 | 輪郭が不明瞭。 | 輪郭が不明瞭。 |
輪郭がはっきりしている。 無色 |
無色 | 無色 | |||
| アモサイト、クロシドライトとの違い | 分散色と消光位 | 分散色 | 分散色 | |||||
|
|
浸液屈折率1.605 と1.640で同定。 | 浸液屈折率1.605 と1.640で同定。 | 浸液屈折率1.605 と1.640で同定。 | |||||
| //はポラライザ(偏光板)の振動方向が繊維の伸びに平行、⊥は繊維の伸びに垂直を示す。 | ||||||||
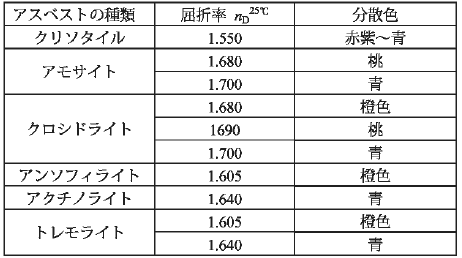 JIS K3850-1(空気中の繊維状粒子測定方法-第1部:光学顕微鏡法及び走査電子顕微鏡)から |
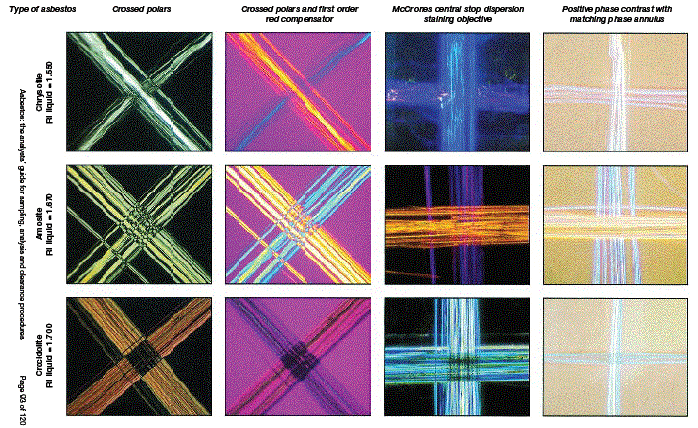 Figure A2.2 HSE asbestos reference samples viewed by polarised light microscopy 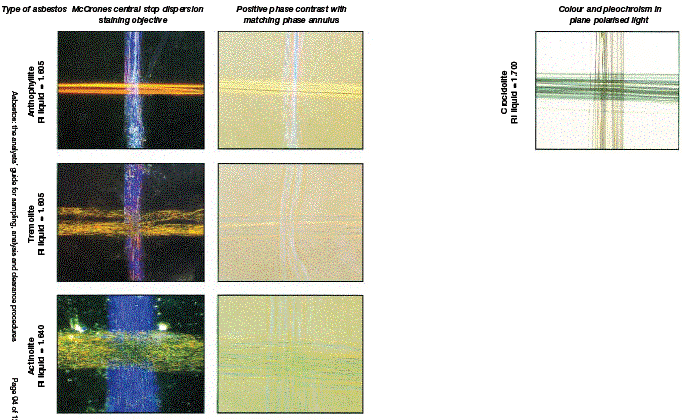 Figure A2.2 HSE asbestos reference samples viewed by polarised light microscopy (cont) For a compensator with the slow direction in the NE-SW orientation and polariser aligned in the E-W direction. All phase contrast dispersion mounts used the Series B (1.556, 1.680, 1.692, 1.640, 1.604, 1.604) RI liquids, and McCrones central stop dispersion staining mounts used the Series E high dispersion RI liquids (as given). Approximate magnification is X 100. Note: crossed polars and crossed polars with a first order compensator plate appearances for anthophyllite, tremolite and actinolite are the same as for amosite. HSE(英国健康安全局)(2005)による『Asbestos: The analysts' guide for sampling, analysis and clearance procedures』から 鋭敏色検板が挿入され〔速度の低い(屈折率の高い)方向はNE-SW(北東-南西)方向〕、ポラライザの振動方向はE-W(東西)方向である。それぞれの屈折率をもつ浸液が使われている。倍率は約100倍。 |
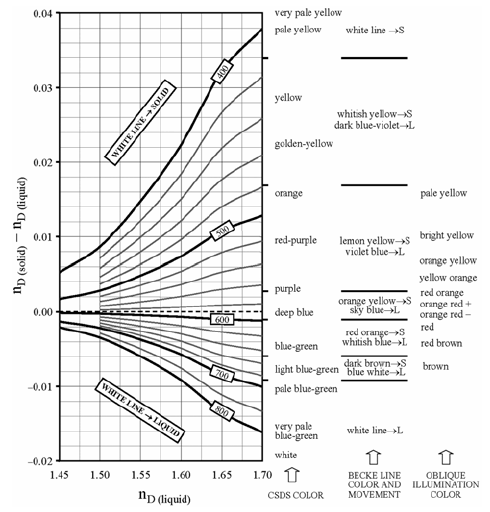 Su(2005)による『Dispersion staining - A versatile complement to Becke line method for refractive index determination』から |
|
建築物の耐火等吹付け材の石綿含有率の判定方法
第4 石綿の含有率の判定方法 |
|
|
crocidolite | amosite | chrysotile | anthophyllite | tremolite |
|
|
|
Cargille |
|
|
|
|
|
|
|
| // |
黄~深紅色 (420-520nm) |
黄~深紅色 (420-520nm) |
深紅~淡青緑色 (520-620nm) |
薄黄~黄色 (330-430nm) |
薄黄~黄色 (330-430nm) |
薄黄(260-360nm) |
|
| ⊥ |
薄黄~金黄色 (360-460nm) |
青深紅~淡青色 (560-660nm) |
青緑色~淡青色 (600-700nm) |
金黄~淡青緑色 (460-700nm) |
金黄~淡青緑色 (460-700nm) |
薄黄~金黄色(360-460nm) |
|
| //はポラライザ(偏光板)の振動方向が繊維の伸びに平行、⊥は繊維の伸びに垂直を示す。 | |||||||
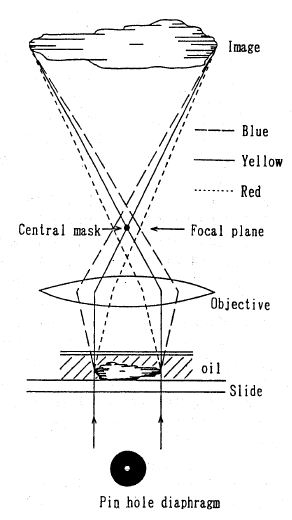 Fig.1 Schematic optical system of dispersion staining method. 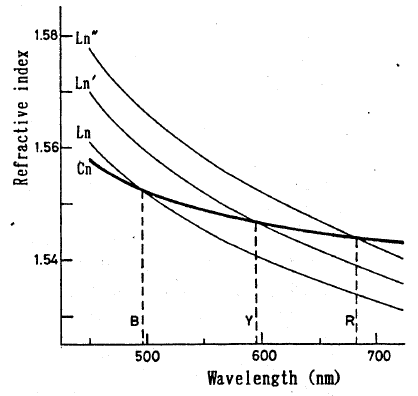 Fig.2 Relationship between wavelangth of light and refractive indices. Cn: index of crystal, Ln: index of immersion oil L1, Ln': index of oil L2, Ln'': index of oil L3. 宇野(1992)による『分散染色法によるアスベストの光学的同定』から 結晶と浸液の屈折率が等しい波長の光が、セントラル・マスク(セントラル・ストップ)によりカットされると、その色の補色に色づいて見える。Cnは結晶の屈折率で、浸液L1・L2・L3の屈折率をLn・Ln'・Ln''とすれば、 浸液L1(Ln)を用いた場合は青色光が除かれるため、赤色に着色する。逆に、浸液L3(Ln'')を用いた場合は赤色光が除かれるため、青色に着色する。 |
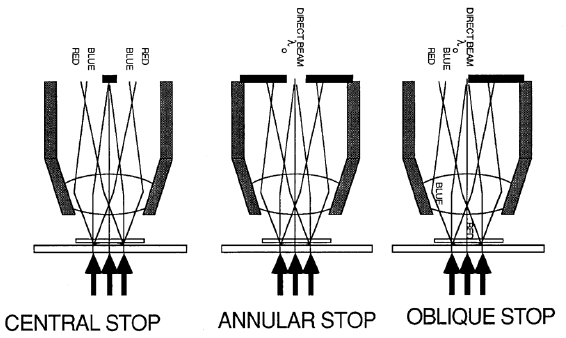 Figure 9: Objective stop dispersion staining Crutcher(1989)による『Introduction to dispersion staining microscopy』から |
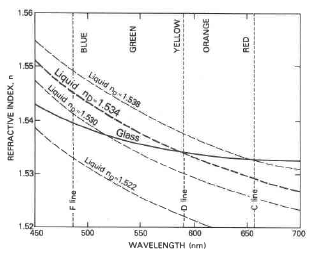 Fig. 1. Dispersion curves (refractive index vs. wavelength) for a typical glass and immersion liquids at a given temperature. |
|
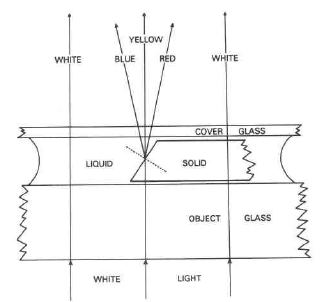 Fig.2. Spectrum formed by a beam of white light at an inclined solid/liquid interface. Refractive indices of solid and liquid match in the region of the yellow wavelengths. (Dashed line is normal to the interface.) |
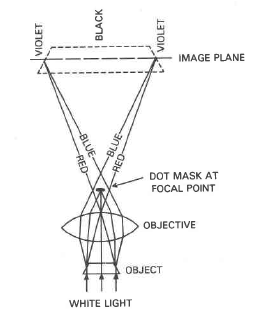 Fig. 3. Diagramatic representation of the frmation of the colored image of an immersed fragment using central focal masking. Refractive indices of fragment and liquid match in the region of the yellow wavelengths, rays of which are blocked by the dot mask at the focal point of the objective lens. |
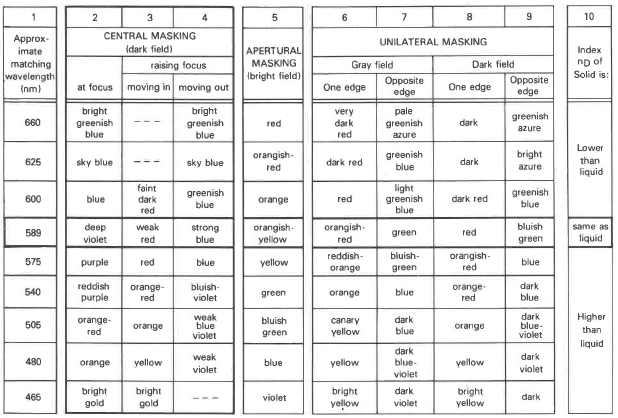 Fig. 4. Dispersion colors observed in focal masking, modified Cherkasov(1957). Colors may vary somewhat depending on spectral composition of the illumination. |
|
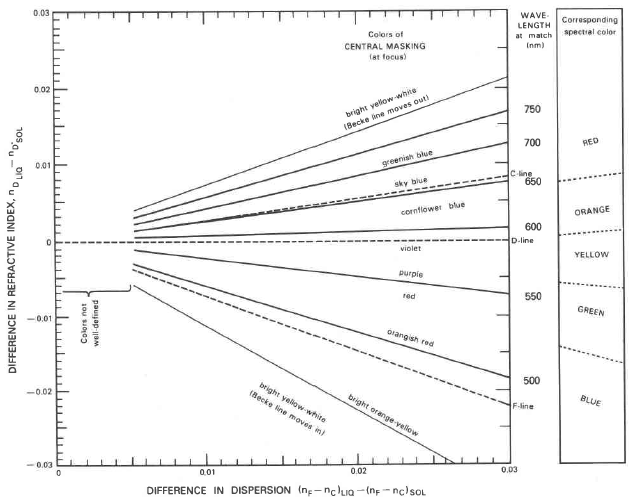 Fig. 7. Observed dispersion colors for various combinations of refractive index difference and dispersion difference between liquid and immersed fragment (adopted from Schmidt and Heidermanns, 1958.) Colors may vary somewhat depending on spectral composition of the illumination. |
|
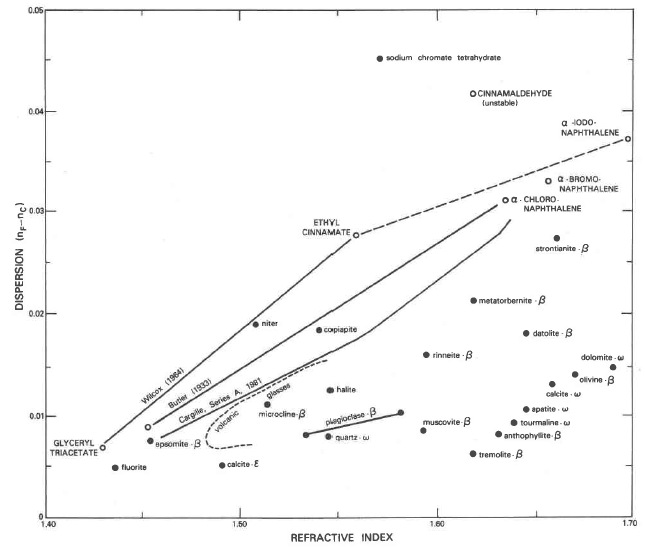 Fig. 8. Plot of dispersion vs. refractive index for selected organic immersion liquids and inorganic solids. Values for solids taken from Winchell (1929, table V) and Winchell and Winchell (1964, p. 137.) |
|
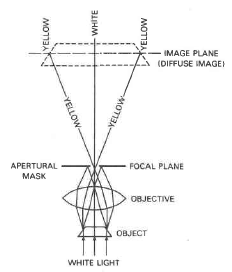 Fig. 42. Representation of the formation of the dispersion color image using apertural focal masking when refractive indices of fragment and liquid match in the region of the yellow wavelensths. |
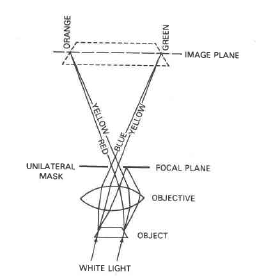 Fig. A3. Representation of the formation of the dispersion color image using unilateral focal masking when refractive indices of fragment and liquid match in the region of the yellow wavelengths. |
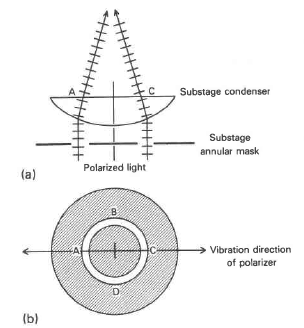 Fig. A4. Substage condensing system for annular focal masking: (a) vertical section in vibration plane of polarizer, (b) bottom view of substage annular opening. |
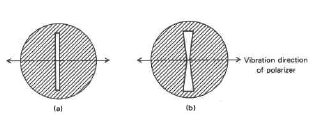 Fig. A5. Alternative forms of substage opening for strip focal masking: (a) simple strip opening, (b) flared opening for increased illumination. |
| Wilcox(1983)による『Refractive index determination using the central focal masking technique with dispersion colors』から | |
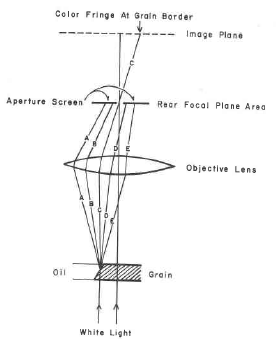 Fig.. l. Schematic diagram showing the effects of apertural screening on dispersed rays of white light as viewed in focus. |
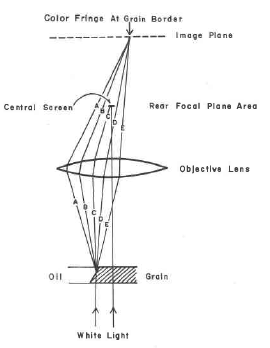 Fig. 2. Schematic diagram showing the effects of central screening on dispersed rays of white light as viewed in focus. |
| Laskowski et al.(1979)による『Measurement of refractive index in thin section using dispersion staining and oil immersion techniqies』から | |
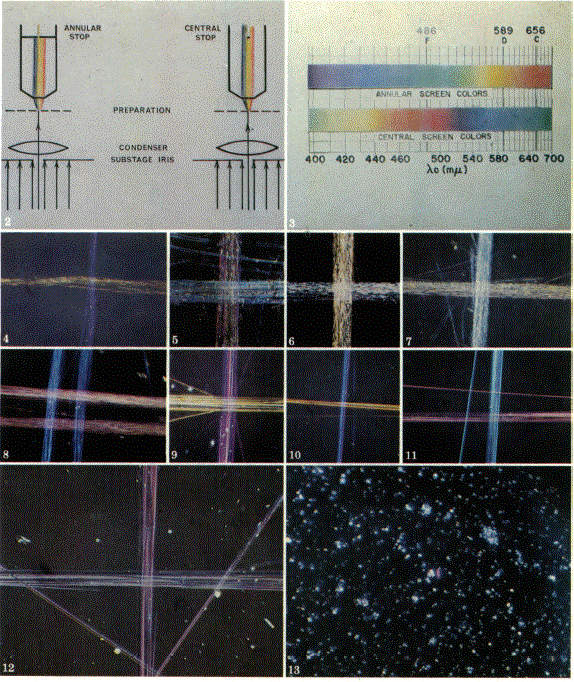 2. Schematic arrangement for annular and central
stop dispersion staining McCrone(1974)による『Detection and identification of asbestos by microscopical dispersion staining』から |
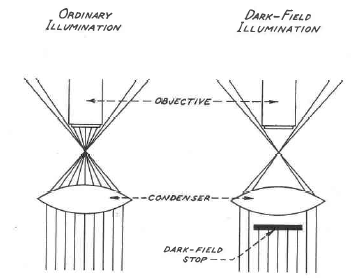 Fig.. 1 Dodge(1948)による『The dark-field color immersion method』から |