Wilcox(1983)による『Refractive
index determination using the central focal masking technique
with dispersion colors』から
American Mineralogist、68、1226-1236、1983年
Abstract
The central focal masking ("dispersion staining")
technique is convenient and effective for determining the refractive
index of a microfragment by the immersion method and for distinguishingb
etweenm ineralsi n an immersionm ount. For most microscopes the
only modification needed is the installation of a small opaque
dot at or near the focal point of the medium power objective.
White light illumination, stopped down to the angular aperture
of the opaque dot, produces a dark field on which the image of
the fragment is outlined in diagnostic dispersion color.
Precision of refractive index determination by this technique,
about ±0001 under routine controlled conditions, is similar to
that of the conventional Becke line technique using microchromatic
yellow illumination. However, it has the advantages that (l) near
the match the direction and approximate amount of mismatch may
be inferred from the dispersion color of the image alone without
the need for manipulation of the focus, (2) at the match the microfragment
is clearly visible, and (3) results are obtainable even in the
presence of an appreciable amount of inclusions or specific absorption
(body color) in the fragment.
Besides providing a useful means for refractive index determination,
focal masking permits rapid distinction among constituents in
a mixture and an estimation of their proportions. As a teaching
aid the focal masking technique provides a convincing demonstration
of the manner of image formation and resolution in the microscope.
Introduction
Determination of refractive index
Isotropic substqnces
Anisotropic substances
Interpolation and extrapolation
Precision and limitations of the technique
Additional applications
Acknowledgments
References
Appendix 1
Modification of the microscope
Appendix 2
Alternative modes of focal masking
Apertural focal masking
Unilateral focal masking
Annular focal masking
Strip focal masking
Appendix 3
Calibration of color perception
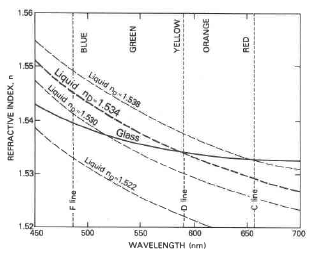
Fig. 1. Dispersion curves (refractive index vs. wavelength) for
a typical glass and immersion liquids at a given temperature.
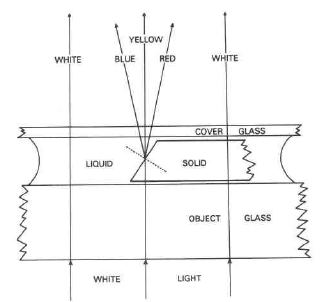
Fig.2. Spectrum formed by a beam of white light at an inclined
solid/liquid interface. Refractive indices of solid and liquid
match in the region of the yellow wavelengths. (Dashed line is
normal to
the interface.)
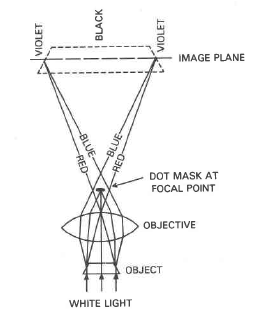
Fig. 3. Diagramatic representation of the frmation of the colored
image of an immersed fragment using central focal masking.
Refractive indices of fragment and liquid match in the region
of the yellow wavelengths, rays of which are blocked by the dot
mask at the focal point of the objective lens.
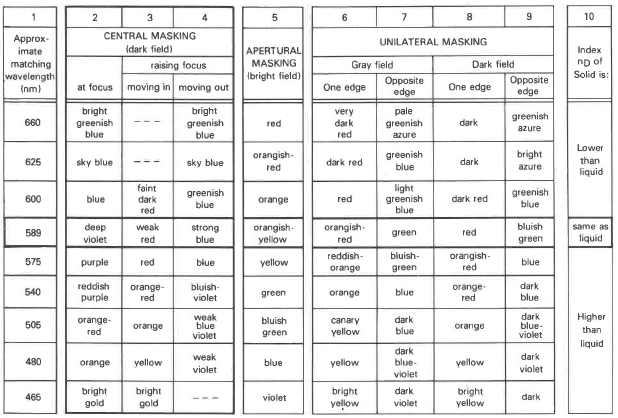
Fig. 4. Dispersion colors observed in focal masking, modified
Cherkasov(1957). Colors may vary somewhat depending on spectral
composition of the illumination.
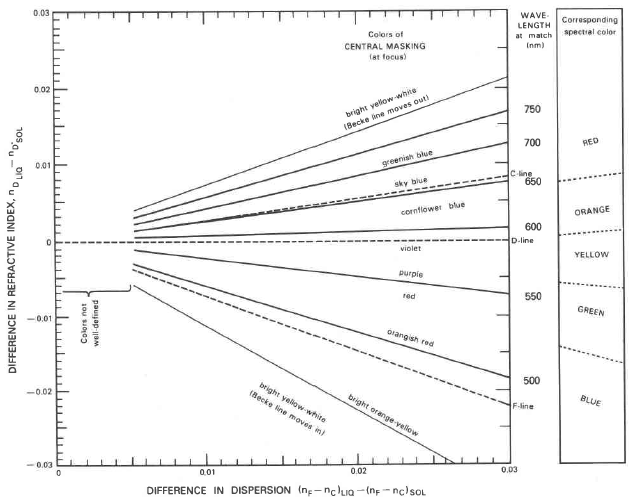
Fig. 7. Observed dispersion colors for various combinations of
refractive index difference and dispersion difference between
liquid and immersed fragment (adopted from Schmidt and Heidermanns,
1958.) Colors may vary somewhat depending on spectral composition
of the illumination.
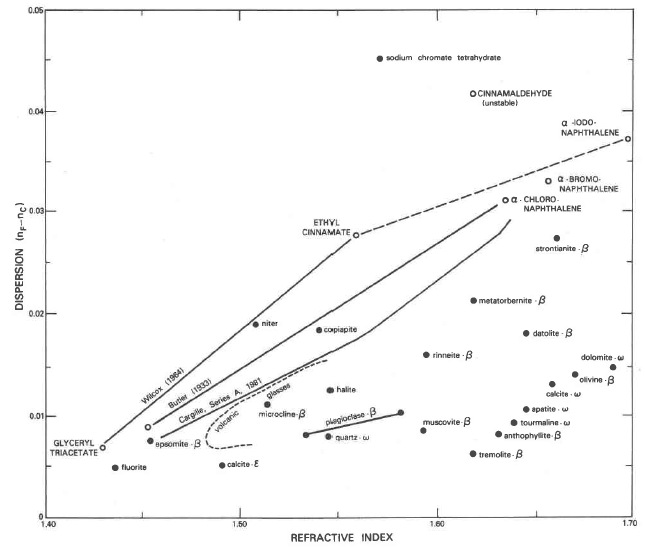
Fig. 8. Plot of dispersion vs. refractive index for selected
organic immersion liquids and inorganic solids. Values for solids
taken from Winchell (1929, table V) and Winchell and Winchell
(1964, p. 137.)
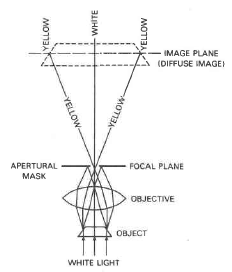
Fig. 42. Representation of the formation of the dispersion color
image using apertural focal masking when refractive indices
of fragment and liquid match in the region of the yellow
wavelensths.
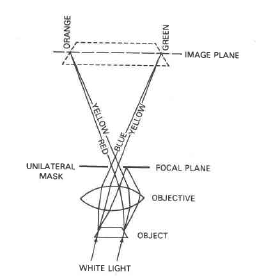
Fig. A3. Representation of the formation of the dispersion color
image using unilateral focal masking when refractive indices
of fragment and liquid match in the region of the yellow
wavelengths.
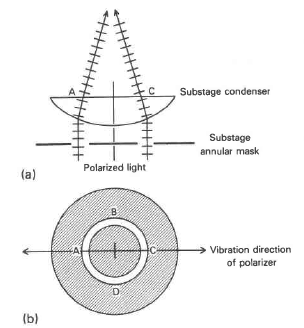
Fig. A4. Substage condensing system for annular focal masking:
(a) vertical section in vibration plane of polarizer, (b) bottom
view of substage annular opening.
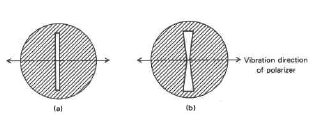
Fig. A5. Alternative forms of substage opening for strip focal
masking: (a) simple strip opening, (b) flared opening for
increased illumination.
Wilcox(1983)による『Refractive
index determination using the central focal masking technique
with dispersion colors』から |
戻る


