|
最終更新日:2016年10月26日
|
|
|
Fig.9. Depositional model for the accumulation of the phosphatic sequence in the Sete Lagoas Formation. Intertidal-supratidal deposits are composed of Facies F1. Upper subtidal deposits are composed of Facies F3 and F4. Lower subtidal deposits include Facies F4, F5 and F6. Middle shelf sediments are composed of Facies F7. |
Fig. 10. Interpretation of marine redox conditions that produved peritidal phosphorite in the Sete Lagoas Formation. Aeolian processes supplied P to the coast that fertilized photosynthetic microbial communities to create oxygen oases. Suboxic conditions along the coast pushed redox sensitive phosphogenic processes(P1) into peritidal sediments, promoting phosphogenesis(red dashed line). Anoxia in deeper settings is interpreted as having suspended P cycling in the water column(P2), preventing phosphogenesis. |
|
|
|
Fig. 12. Paragenesis of the phosphatic sequence in the Sete Lagoas Formation. Stage 1=authigenesis and hydraulic reworking; Stage 2=meteoric and shallow burial diagenesis; Stage =burial diagenesis and metamorphism; Stage 4=hydrothermal; Stage 5=pedogenesis. |
Drummond et al.(2015)による『Neoproterozoic peritidal phosphorite from the Sete Lagoas Formation (Brazil) and the Precambrian phosphorus cycle』から |
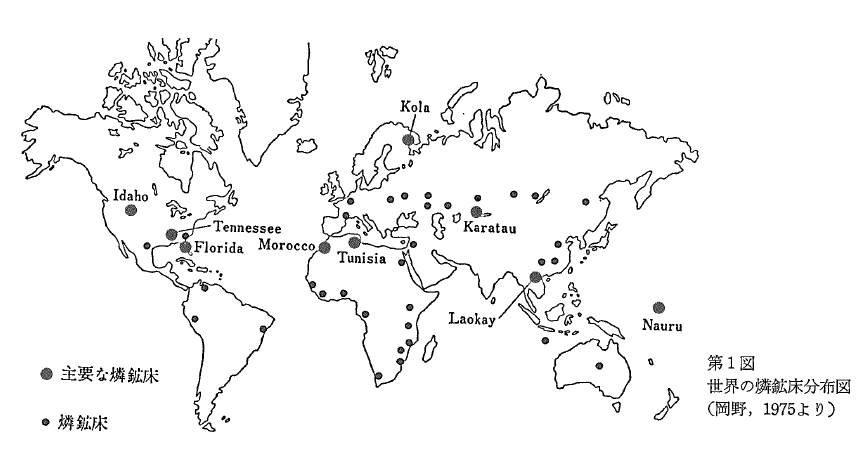
USGS(2014/3)による『World phosphate mines, deposits, and occurrences』から |
Figure 1. World phosphate rock resources (Source: IFDC). Van Kauwenbergほか(2013)による『Worl reserves of phosphate rock... a dynamic and unfolding story』から |
Figure 1. Seawater chemistry and Earth events as related to the three stages of ocean-atmosphere oxygenation (1, 2, 3). The degree of oxygenation immediately after the GOE is still largely unknown, but recent δ53Cr data suggests that at ca. 1.9 Ga oxygen levels may have dipped to pre-GOE concentrations (Frei et al., 2009). See Figure 2 and Table 1 for a more complete summary of the geochemical data for Earth’s oxygenation. PAL=present atmospheric levels; MIF=mass-independent fractionation. Based on data from Farquhar et al.(2000), Condie et al. (2001), Canfield (2005), Fedonkin (2009), Johnston et al. (2009), Lyons and Reinhard (2009), Konhauser et al. (2011), and Nelson et al. (2010). |
Figure 2. Geochemical proxies used to understand Earth’s oxygenation. A) δ34S data from sedimentary sulfides showing an increase in fractionation after ca. 2.4 Ga (Canfield, 2005). The double dashed line is the estimated range in δ34S values for SO42-. Lower dashed line is the maximum fractionation with sulfide. B) δ33S data from sedimentary sulfides (Farquhar et al., 2000; Farquhar and Wing, 2003). Mass independent S fractionations of 32S, 33S, and 34S indicate low atmospheric oxygen levels from ca. 3.8-3.0 Ga, an increase from ca. 2.7 to 2.4 Ga, and a permanent rise after ca. 2.4 Ga. The yellow horizontal line represents the range of values for mass dependent fractionation of S isotopes. C) δ56Fe data from bulk shale samples, iron formations, and pyrite (Johnson et al., 2008). The yellow horizontal line marks the range in δ56Fe values for Archean to modern, low-C and low-S clastic sedimentary rocks. Increased fractionation between ca. 2.7 and 2.5 Ga is the likely consequence of rising photosynthetic oxygen. D) δ53Cr data from iron formations (Frei et al., 2009). The yellow horizontal line shows the range of values of magmatic Cr3+-rich ores and minerals formed under high temperatures. Increased fractionation between ca. 2.8 and 2.6 Ga suggests a “whiff” or transient oxygen levels prior to the GOE. Decreased fractionation at ca. 1.9 Ga may record pre-GOE oxygen levels. E) Ni/Fe mole ratios for iron formations (Konhauser et al., 2009). Decline in Ni at ca. 2.7 Ga may have limited methanogens and contributed to the GOE. |
Figure 7. Continental margin iron formation. Lithofacies formed a sedimentary wedge that fines and thickens basinward. Coastal upwelling provided a sustained supply of anoxic bottom water rich in dissolved Fe and Si. Precipitation occurred in an oxygen stratified water column that was suboxic down to fair-weather wave base. Nearshore lithofacies consist of cross-stratified grainstones that are commonly stromatolitic. Laminated pristine lithofacies accumulated in low energy environments such as shallow lagoons and below fair-weather wave base on the middle and distal shelf. REE spidergrams show the behaviour of Ce across the shelf. A negative Ce anomaly is most pronounced along segments of the paleoshoreline that were oxygenated by photosynthesis. It disappears offshore where bottom and intermediate waters were anoxic. The positive Eu anomaly reflects the hydrothermal source of Fe (Klein, 2005 and references therein). SWB=storm wave base; FWB=fair-weather wave base. Modified from Pufahl (2010). |
Figure 8. Paragenesis typical of pristine iron formation in suboxic and anoxic paleoenvironments. Modified from Klein (2005) and Pufahl (2010). |
Figure 4. Temporal distribution of iron formation (red), ironstone (purple), phosphorite (yellow) and black shale (black). Based on deposit age, resource estimates and timing of Earth events in Glenn et al. (1994), Kholodov and Butuzova (2004), Condie et al. (2001), Klein (2005), Reddy and Evans (2009), and Bekker et al. (2010). Events: OP=appearance of oxygenic photosynthesis; GOE=Great Oxidation Event; BB=Boring billion; CE=Cambrian Explosion. Glaciations: 1=Mesoarchean; 2=Huronian; 3=Paleoproterozoic; 4=Neoproterozoic ‘Snow Ball’; 5=Ordovician; 6=Permian; 7=Neogene. Modified from Pufahl (2010). |
Figure 10. Continental margin phosphorite and black shale. Phosphorite accumulates within organic-rich sediment beneath the sites of coastal upwelling. A pronounced oxygen minimum zone (OMZ) develops as benthic bacteria exhaust oxygen to degrade organic matter. Black shale is also associated with upwelling, but can form in calm, nutrient-rich coastal environments such as lagoons. The plots show redox-related changes in trace element concentrations across the shelf. In the nearshore a negative U anomaly and elevated Cr records accumulation under oxic and suboxic conditions. Elevated U, V, Cu, Cd, Zn, Mo, and Ni reflects deposition in deeper anoxic portions of the shelf. SWB=storm wave base; FWB=fair-weather wave base. Modified from Pufahl (2010). |
Pufahl and Hiatt(2012)による『Oxygenation of the Earth’s atmosphere-ocean system: A review of physical and chemical sedimentologic responses』から |
Open-cast mining of phosphate rock in Togo. Most of the world’s phosphate rock is extracted from open pits, as shown here, or from large-scale mines equipped with drag lines or shovel/excavator systems. Credit: Alexandra Pugachevsky UNEP(HP/2011/8)による『Phosphorus and Food Production』から |
Figure 2. Schematic vertical section across continental platform, showing key lithologies and spatial relationship between phosphorites and other deposit types and hydrocarbons (modified from Sheldon, 1963; Hein et al., 2004). |
Figure 3. Phosphorite of Sulphur Mountain Formation, northeast British Columbia. Phosphate ooids in carbonate matrix (planepolarized light; shorter margin of the photograph equals 500 microns). This phosphorite contains 23.6% P2O5, 1167.4 ppm of rare earth elements (including 227 ppm La, 122.5 ppm Ce, 45.4 ppm Pr, 186 ppm Nd, 35.7 ppm Sm, 8.75 ppm Eu, 43.5 ppm Gd, 8.4 ppm Ho, 23.7 ppm Er, 3.0 ppm Tm, 15.2 ppm Yb, 2.1 Lu and 399 ppm Y). |
AGE OF MINERALIZATION Deposits range in age from Proterozoic to Holocene. Phosphate deposits are particularly abundant in Cambrian, Permian, Jurassic, Cretaceous, Eocene and Miocene times (Cook and McElhinny, 1979). In terms of inferred resources (tonnage), the Eocene, Miocene and Permian are the most important time intervals. In British Columbia, the majority of phosphate occurrences are located in rocks of Jurassic and Triassic age. GENETIC MODEL Seawater averages 0.071 ppm phosphorous (Redfield, 1958) and may contain as much as 0.372 ppm phosphorus (Gulbradsen and Robertson, 1973). Warm surface waters typically contain less than 0.0033 ppm phosphorus (McKelvey, 1973). Phosphate rocks and primary phosphorites form in or laterally adjacent to organic-rich sediments beneath regions where upwelling, nutrient-rich, cold waters interact with a warm sunlit surface seawater layer, creating favourable conditions for intense algal bloom. Algae die, or are eaten by other life forms, then accumulate on the seafloor as fecal pellets and/or organic debris beneath sites of active coastal upwelling. Decomposition of organic debris in an oxygen-deprived environment by bacteria and dissolution of fish bones and scales are linked to precipitation of phosphate minerals (phosphogenesis) near the sediment-water interface. Precipitation of apatite within intergranular spaces during diagenesis and through non-biological chemical processes may also contribute to formation of phosphate rocks. |
|
Simandl et al.(2011)による『Sedimentary Phosphate Deposits Mineral Deposit Profile F0』から |
Economic and potentially economic phosphate deposits of the world Van Kauwenberg(2010/11)による『World phosphate rock Reserves and resources』から |
|
|
||||||||||||||||||||||||||||||||||||||||||||||||||||||||||||||||||||||||||||||||||||||||||||||||||||||||||||||||||||||||||
2009) Reserves. IFDC Reserve and Resource Estimate
|
|||||||||||||||||||||||||||||||||||||||||||||||||||||||||||||||||||||||||||||||||||||||||||||||||||||||||||||||||||||||||||
|
|||||||||||||||||||||||||||||||||||||||||||||||||||||||||||||||||||||||||||||||||||||||||||||||||||||||||||||||||||||||||||
Van Kauwenbergh(2010/9)による『World Phosphate Rock Reserves and Resources』から |
Fig. 10. Extent of phosphogenesis resulting from Fe-redox pumping on Precambrian and Phanerozoic shelves. As Fe-(oxyhydr)oxides are buried beneath the Fe-redox interface they dissolve, liberating adsorbed PO43- to pore water. Phosphogenesis is limited in the sediment by the availability of seawater-derived F-. The difference in the size of phosphogenic regions in the Precambrian and Phanerozoic is ascribed to the disparity in the oxygenation state of the seafloor. In the Precambrian, photosynthetic stromatolites in nearshore environments produced a suboxic seafloor that facilitated Fe-redox pumping and thus, phosphogenesis. Phosphogenesis could not occur in the middle and distal shelf because these regions were below the oxygen chemocline. This transition is interpreted to have roughly coincided with fair weather wave base. Phosphogenesis in the Phanerozoic occurs across the entire spectrum of shelf environments because the seafloor is generally well oxygenated. In this model the term “suboxic” is used as a relative measure of oxygen levels in the water column and sediment and does not refer to specific authigenic reactions or oxygen concentrations (cf. Canfield and Thamdrup, 2009). FWB = fair weather wave base; SWB = storm wave base. Nelson et al.(2010)による『Paleoceanographic constraints on Precambrian phosphorite accumulation, Baraga Group, Michigan, USA』から |
Fig.1: Phosphorite deposits of the Mediterranean area (Al-Bassam, 1974) |
Fig.10: Classification and dominant occurrence of phosphate components in marine shelf environments |
||||||||||||||||||||||||||||||||||||
※写真は任意に縮小しているため、示されたサイズではないので注意。
※写真は任意に縮小しているため、示されたサイズではないので注意。 |
||||||||||||||||||||||||||||||||||||
Al-Bassam et al.(2010)による『Petrographic Classification of Phosphate Components of East Mediterranian Phosphorite Deposits』から |
Figure 1 Occurrence of phosphorite deposits through the Phanerozoic. Estimated abundance of phosphate is given on a logarithmic scale in tons P2O5 (after Cook & McElhinny, 1979). Red stars indicate the age of phosphorites investigated in this thesis. |
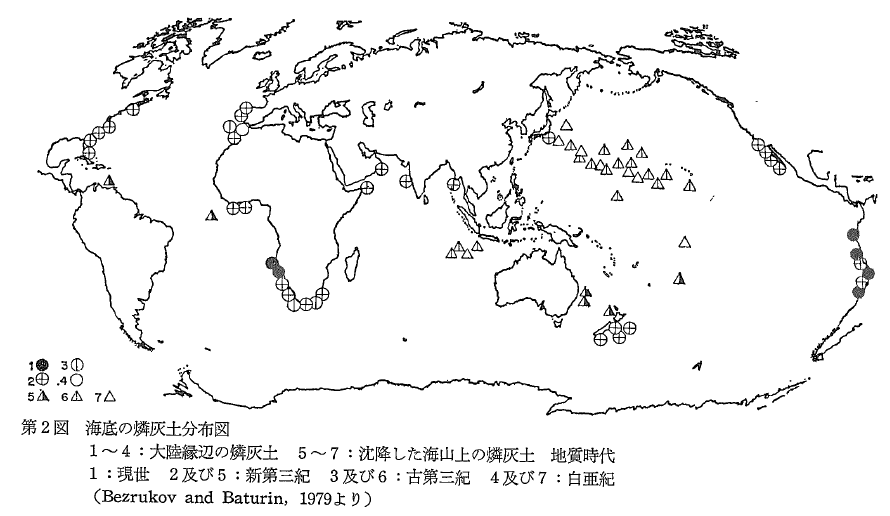
Figure 2 Areas of modern phosphogenesis and relict phosphorites at the sea floor. Areas of coastal upwelling are indicated as well (modified after Baturin, 1982; from Follmi, 1996). Circles highlighted in red indicate sites explored in this thesis. |
Figure 3 Simplified global, pre-human phosphorus cycle in the ocean, showing the most important fluxes (arrows indicate the direction of the flux) and reservoirs of phosphorus (modified after Compton et al., 2000). Red circle: area of interest addressed in this thesis, detailed processes occurring at this site are outlined in section 1.4 and Figure 5. |
Figure 4 Scheme, illustrating the fate of phosphorus from the surface zone of ocean waters. Numbers in red indicate the processes that remove phosphate from the water (see text). 1: biological uptake, 2: adsorption onto particles, 3: formation of authigenic carbonate fluorapatite. |
Figure 5 A) Scheme of the processes involved in phosphogenesis and phosphorus burial in marine sediments of coastal upwelling systems (modified after Compton et al., 2000). PIP: particulate inorganic phosphorus, DIP: dissolved inorganic phosphorus, DOP: dissolved organic phosphorus, CFA: carbonate fluorapatite, OC: organic carbon, P: phosphorus. B) Simplified scheme of processes influencing the pore water phosphate concentration in marine sediments close to the sediment-water interface (modified after Krajewski et al., 1994). | |
Figure 6 Typical pore water phosphate profile and reservoirs of phosphorus in surface sediments of coastal upwelling areas, exemplarily shown on sediments from the continental margin off Namibia (modified after Hensen et al., 2005). |
|
Fig. 12. Scenario of phosphoooid genesis. (A) Carbonate flour apatite (CFA) layers formed in the suboxic zone close to the bottom water (bw)/sediment (sed) interface. Organic matter (OM) accumulated from the water column and was degraded. (B) During times of enhanced organic matter supply, the anoxic/sulfidic zone moved upwards. Hydrogen sulfide induced pyrite formation in the outer CFA layer. (C) Decreasing organic matter supply, and thus, a downward moving anoxic/sulfidic zone led to the formation of the next CFA layer. (D) Phosphoooids were eroded, transported, and the outer CFA layer was partially abraded and corroded. (E) After the return to a lower energy regime and ooid re-deposition, CFA precipitation around phosphoooids was reinitiated under the same conditions as in (A). (F) A new episode of increasing organic matter supply caused repeated pyrite formation. (G) Formation of the outermost CFA layer under conditions as in (A). |
Fig. 13. Scenario of phosphorite crust formation off Peru. (A) Phosphoooids were transported to the place of crust formation. (B) During quieter times, organic matter from the water column deposited. Microbial degradation of the organic material led to suboxic conditions close to the sediment-water interface and the liberation of phosphate to the pore water. Hardground forming phosphatic laminae developed and sealed subjacent phosphoooid layers. Due to enhanced sulfate reduction in the sealed phosphoooid layers, anoxic/sulfidic conditions established. Bottom currents eroded the soft organic matter above the phosphatic laminae from time to time. (C) During the next erosional event a subsequent phosphoooid flow deposited on top of the phosphatic laminae. During times of more oxygenated bottom waters, organisms bored through the phosphatic hardgrounds. (D) The phosphatic laminite formed in the Pleistocene after a long time period without crust growth. Organic matter from the water column continuously deposited and microbial degradation led to establishment of suboxic conditions and phosphate enrichment close to the sediment-water interface. Phosphatic layers sealed organic rich layers and anoxic/sulfidic conditions developed within the laminite leading to local precipitation of sulfide minerals. |
Arning(2008/9)による『Phosphogenesis in Coastal Upwelling Systems - Bacterially-induced Phosphorite Formation』から |
Fig. 2. Distribution of economic phosphorus resources in the Earth's history. Kholodov and Butuzova(2001)による『Problems of Iron and Phosphorus Geochemistry in the Precambrian』から |
【参考】 Figure 9.2. Distribution of economic phosphorus resources in earth history according to the volutionary/uniformitarian timescale (modified by Mrs. Melanie Richard from Kholodov and Butuzova, 2001, p. 293). Oardによる『Chapter 9 Phosphorites and High Phosphate Sedimentary Rocks』から |
Figure 9.1. World map of sites of present day phosphorite formation, Cenozoic oceanic phosphorites at the sea floor (relict), and zones of coastal upwelling (redrawn by Mrs. Melanie Richard from Follmi, 1996, p. 62). Oardによる『Chapter 9 Phosphorites and High Phosphate Sedimentary Rocks』から |
|
Fig. 1 Spatial and temporal distribution of Proterozoic and Cambrian phosphorites. The geochronological scale on the left is adapted directly from Harland et al., as are the chronostratographic boundaries. The distribution and time range of the glacial and tillitic deposits indicated is based largely on various authors in Hambrey and Harland with the exception of column 10 where Compston and Zhang are followed. Authorities consulted for the stratigraphic positioning of the phosphorites are for columns 1-14; (1) Cathcart, Borrello; (2) Trompette et al., Affaton; (3) Viland, Bertland-Sarfati; (4) Poilsen, Bassor, Sougy; (5) Rozanov, Eganov, Missarzhevsky and Mambetov; (6) Kazarinov and Krasilnikova; (7) Bjamba, Ilyin, Ilyin and Bjamba; (8) Bhatti et al., Hasan et al., Shah; (9) Kalmykov et al.; (10), (11), Lu Yanhao, Wang Yangeng, Luo Huilin et al., (12), (13), Lu Yanhao, Chang Wentang; (14) Callen, Fleming, Knight. |
Fig. 2 Abundance of phosphorite deposits during the late Precambrian and Phanerozoic (modified after Cook and McElhinny) and sulphur and carbon isotope curves for evaporite sulphates and carbonates respectively (after Claypool et al. and Veizer et al.). δ34S value for lattice sulphate in phosphorites is after Blishovsky et al. |
Cook and Shergold(1984/3)による『Phosphorus, phosphorites and skeletal evolution at the Precambrian-Cambrian boundary』から |
|
|
|
||||||||||||||||||||||
|
|
||||||||||||||||||||||
2.1 堆積型燐灰土鉱床 このタイプの燐鉱鉱床は一般に層状・レンズ状・連続鉱のう状を示しながら、砂岩・頁岩・珪岩・炭酸塩岩の岩層中に夾在し、ときには団塊として頁岩中に散在する鉱石で構成されていることもある。 燐鉱物は主として非晶質・隠微晶質・微晶質の弗素燐灰石で、大小の球状集合・緻密塊状集合・団塊状集合などを形づくり、通常、量的にはさまざまであるが、粘土鉱物・石英・海緑石・黄鉄鉱・苦灰石・方解石・酸化鉄などを混有する。 |
|||||||||||||||||||||||
岸本(1981/5)による『中国の燐鉱資源』から |