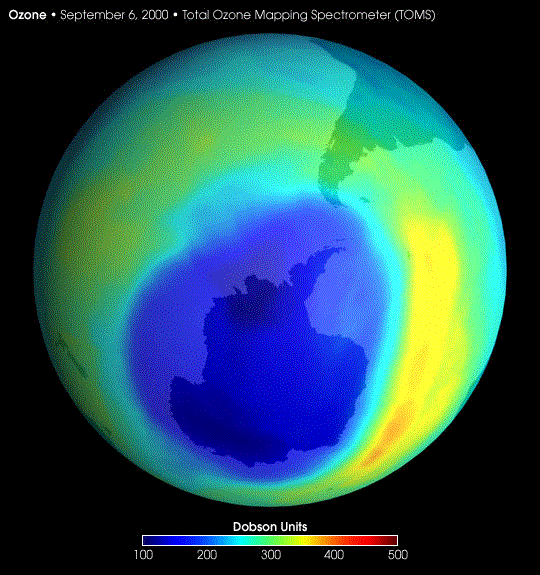
 乲NASA earth observatory偺亀News亁偺亀New Images亁偺拞偺亀Largest-ever Ozone Hole over Antarctica亁偐傜乴 撿嬌戝棨忋嬻偺僆僝儞儂乕儖乮夁嫀嵟戝偱偁偭偨2000擭9寧帪揰乯丅惵偄晹暘傎偳僆僝儞偑彮側偄丅 |
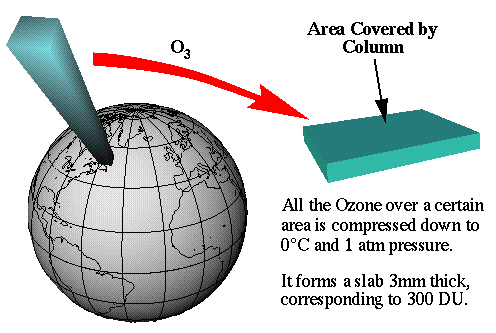 乲Centre for Atmospheric Science乮Cambridge University, UK乯偵傛傞The Ozone Hole Tour偺拞偺亀Dobson Unit - Definition亁偐傜乴 僪僽僜儞扨埵偼丄偁傞応強偺忋嬻偵懚嵼偡傞僆僝儞傪0亷偍傛傃1婥埑偺忦審偵側傞傛偆偵埑弅偟偨応崌丄偦偺岤偝偑0.01mm偱偁傟偽1DU偲掕媊偝傟傞丅暯嬒揑偵偼3mm偱丄300DU偱偁傞丅 |
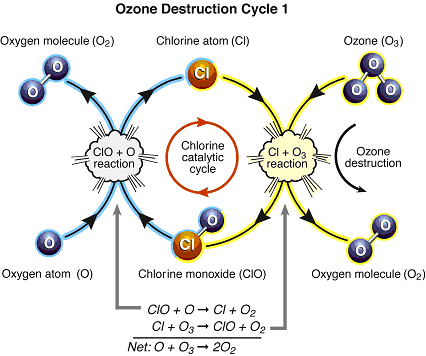 Figure Q9-1. Ozone destruction Cycle 1. 乲NOAA Aeronomy Laboratory偺亀International Ozone-Layer Assessments亁偺亀WMO/UNEP Scientific Assessment of Ozone Depletion: 2002亁偺亀Twenty Questions and Answers About the Ozone Layer亁偺亀II丂THE OZONE DEPLETION PROCESS亁偺拞偺亀Q9: What are the chlorine and bromine reactions that destroy stratospheric ozone?亁偐傜乴 僆僝儞攋夡偺儊僇僯僘儉丅 |
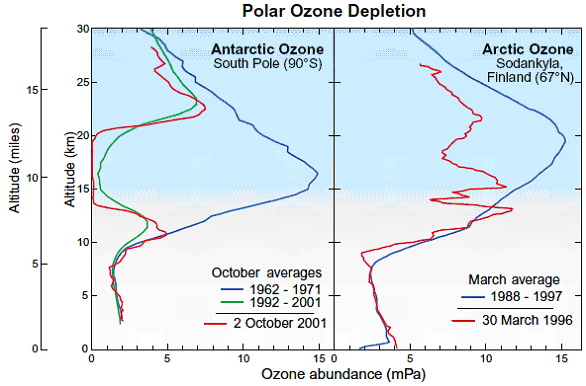 Figure Q11-2. Arctic and Antarctic ozone distribution.
乲NOAA Aeronomy Laboratory偺亀International Ozone-Layer Assessments亁偺亀WMO/UNEP Scientific Assessment of Ozone Depletion: 2002亁偺亀Twenty Questions and Answers About the Ozone Layer亁偺亀III丂STRATOSPHERIC OZONE DEPLETION亁偺拞偺亀Q11: How severe is the depletion of the Antarctic ozone layer?亁偐傜乴 撿嬌偲杒嬌忋嬻偺僆僝儞憌偑攋夡偝傟偰偄傞偙偲傪帵偡娤應僨乕僞丅僼儘儞偑斊恖偱偁傞偑丄椉嬌偲偔偵撿嬌偱攋夡偑挊偟偄偺偼嬌堟惉憌寳塤偑廳梫側栶妱傪偟偰偄傞偲峫偊傜傟偰偄傞丅 |
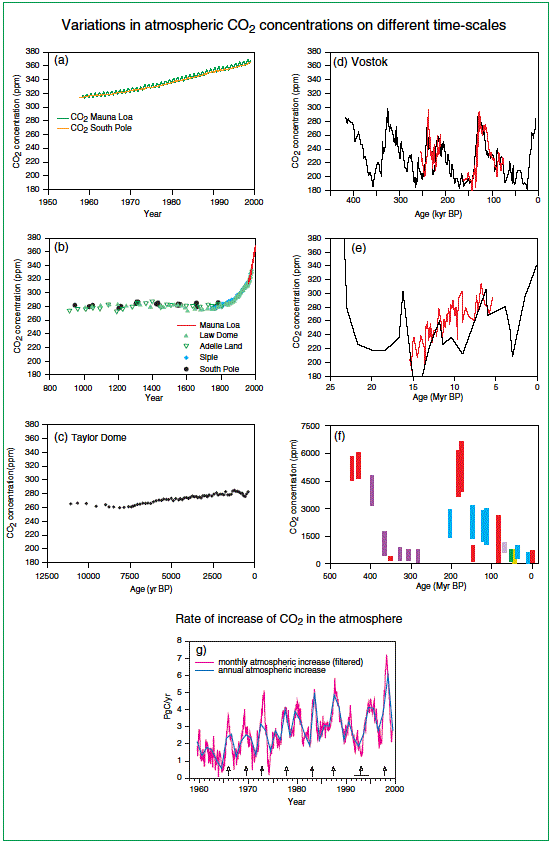 Figure 10: Variations in atmospheric CO2
concentration on different time-scales. 乲Intergovernmental Panel on Climate Change (IPCC) 偵傛傞亀Climate Change 2001: Synthesis Report亁偺亀WG I - Technical Summary亁偺拞偺亀Variations in atmospheric CO2 concentrations on different time-scales亁偐傜乴 IPCC偵傛傞夁嫀偺偝傑偞傑側帪娫僗働乕儖偱偺戝婥拞擇巁壔扽慺擹搙偺曄摦丅 |
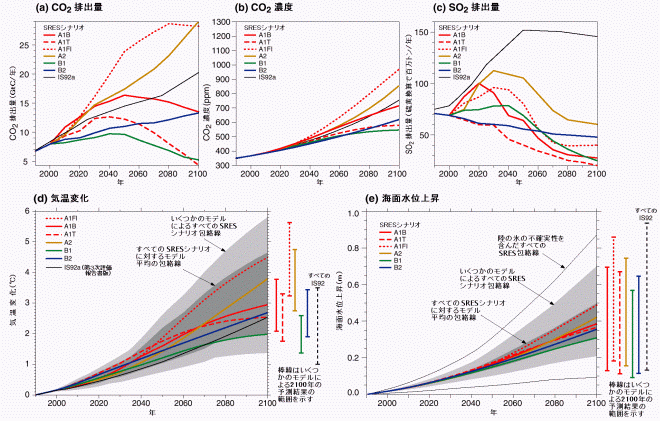 恾SPM-5丗21悽婭偺抧媴偺婥岓偼丆帺慠偺曄壔偲婥岓僔僗僥儉偺恖娫妶摦偵懳偡傞墳摎偱寛傑傞偙偲偵側傞丅 乵乮a乯偼戞3復恾3.12丆乮b乯偼戞3復恾3.12丆乮c乯偼戞5復恾5.13丆乮d乯偼戞9復恾9.14丆乮e乯偼戞11復恾11.12丆晅榐2偵婎偯偔乶 IPCC偵傛傞2100擭傑偱偺婥壏偲奀柺悈埵偺忋徃梊應丅 |