|
最終更新日:2016年12月11日
図15.世界の集光型太陽熱発電設備容量、国別、地域別(2004年〜2013年) 出典:本章の巻末注1を参照。 |
図16.世界の太陽熱利用システム設備容量 上位10か国の割合(2012年) 出典:本章の巻末注4を参照。 |
図17.太陽熱利用システム追加容量 上位10か国(2012年) 出典:本章の巻末注55を参照。 |
図18.世界の太陽熱利用システム設備容量(2000年〜2013年) 出典:本章の巻末注7を参照。 |
ISEPによる『自然エネルギー世界白書 2014』から |
ISEPによる『自然エネルギー白書 2014』から |
※:土地利用率[%]=反射鏡の投影面積(アパチャ面積)/設置する土地面積 出典:“Concentrating Solar Power Global Outlook 09”(2009, SolarPACES, ESTERA, Greenpeace),Stirling Energy Systems プレスリリース(http://www.stirlingenergy.com/pdf/2010_01_22.pdf),“Technology Roadmap Concentrating Solar Power”(2010, IEA),“Global Potential of Concentrating Solar Power”(2009, SolarPACES)より NEDO 作成 NEDO(2013/12)による『再生可能エネルギー技術白書』の『第5章 太陽熱発電・太陽熱利用』から |
Efficiency graph of solar collector performance |
|
Graph of efficiency and temperature ranges of various types of collectors (radiation: 1000 W/m2) |
|
Darling(HP/2012/1)による『The Encyclopedia of Alternative Energy and Sustainable Living』の『solar collector』から |
Flate plate collector. Credit: US Dept of Energy Darling(HP/2012/1)による『The Encyclopedia of Alternative Energy and Sustainable Living』の『flat-plate solar collector』から |
Direct-flow evacuated-tube collectors |
Heat pipe evacuated-tube collectors |
Darling(HP/2012/1)による『The Encyclopedia of Alternative Energy and Sustainable Living』の『evacuated tube collector』から |
A comparison of the energy output (kW.h/day) of a flat plate collector (blue lines; Thermodynamics S42-P]; absorber 2.8 m2) and an evacuated tube collector (green lines; SunMaxx 20EVT; absorber 3.1 m2. Data obtained from SRCC certification documents on the Internet. Tm-Ta = temperature difference between water in the collector and the ambient temperature. Q = insolation during the measurements. Firstly, as (Tm-Ta) increases the flat plate collector loses efficiency more rapidly than the evac tube collector. This means the flat plate collector is less efficient in producing water higher than 25 degrees C above ambient (i.e. to the right of the red marks on the graph). Secondly, even though the output of both collectors drop off strongly under cloudy conditions (low insolation), the evac tube collector yields significantly more energy under cloudiness than the flat plate collector. Although many factors obstruct the extrapolation from two collectors to two different technologies, above, the basic relationships between their efficiencies remain valid. Wikipedia(HP/2012/1)による『Solar thermal collector』から |
|
|
|
注:各数値は、温水プール用途(非ガラス管式集熱器)を除く。世界の新規導入量は全体での追加分;既存値は撤去済み設備の推計値を含む。中国と世界のデータはGWth
で四捨五入。Weiss とMauthner は、彼らの調査が世界市場の85〜90% は含んでいると見積もっている。上記の世界総計や各数値はこの点を考慮に入れ、その結果世界総容量は控えめに見て5%
を加えている。ブラジルの設置容量は、2009年末に3.7GWthに達している。このデータは、Renata Grisoli、CENBIO,Brazil
とREN21 関係者との2011 年2 月の情報交換による。しかし、全ての数字において一貫性を保証するため、 Weiss
とMauthner のデータをこの表に使用している。国際的に認められている100万u=0.7GWth を用いる。 1 中国の数値は2010 年に下方修正されている。従来の報告書では近年設置されたが稼働していない大量の設備数も計算に含めていたためである。以前の報告書では、新規設置の累積容量のみ中国のデータに反映され、稼働しなくなる設備に対しては反映されていない。(これは、他国での老化による設備の撤去とは異なる;中国では、比較的最近導入された設備が、寿命が尽きる以前に使用できなくなっている)さらに、過去には、中国で製造および輸出した設備と中国に設置された設備とでは差が開いていた。このような差異および訂正は、世界の太陽熱温水器に関する以前の報告書に大幅に影響を与えている。また、本報告書は以前の報告書と比較してはならないということを意味する。 報告書の他のところにも使用されている世界総容量の2010 年推計値に注意(e.g 世界市場の概要;表R1):2010 年の太陽熱パネル容量である185GWth はWeiss とMauthnerによる推計であり、すべてのパネル容量は2010年末には総計196GWthとなる。約10%〜11% の市場占有率を見せる非ガラス集熱器を差し引くと総計は176GWthになるが、Weiss とMauthnerの調査に含まれていない国々を反映させることにより5%上昇し、185GWth に調整される。2010年の全体の新規導入量は30GWth であり、Weiss とMauthnerの調査の既存の非ガラス管式集熱器における2009 年と2010 年の相違(25GWth)や2010 年に全世界的に5GWth 減少したという前提に基づいて推定したものである(中国以外での設備の年次撤去率は5% であり、2010 年に中国では2GWth ほど稼働しなくなっている)。 出典:Werner Weiss および Frantz Mauthner, Solar Heat Worldwide: Markets and Contributions to Energy Supply 2009(Paris: IEA Solar Heating and Cooling Programme, 2011年5月) |
REN21〔ISEP訳〕による『自然エネルギー世界白書2011』から |
Figure 2: Total capacity in operation [GWel], [GWth] 2010 and annually energy generated [TWhel], [TWhth]. Sources: EWEA, EPIA, GWEC, IEA SHC 2011, Morse Associates Inc., REN 21 |
Figure 3: Share of the total installed capacity in operation (glazed and unglazed water and air collectors) by economic regions at the end of 2009 |
Figure 4: Distribution of the total installed capacity in operation by collector type in 2009 |
Figure 5: Total installed capacity of water collectors in operation in the 10 leading countries by the end of 2009 |
Weiss & Mauthner(2011)による『Solar Heat Worldwide』から |
太陽集熱器の種類 NEDO(HP/2011/11)による『太陽熱利用』から |
|
|
|
NEDO(HP/2011/11)による『太陽熱利用』から |
A:給湯システム |
B:暖房・給湯システム(床暖房) |
C:暖房・給湯システム(空気集熱暖房) |
D:冷暖房・給湯システム |
資源エネルギー庁(HP/2011/11)による『太陽熱利用』から |
REN21〔ISEP訳〕(HP/2011/6)による『自然エネルギー世界白書2010』から |
|
|
|
|
ソーラーシステム振興協会(2011/1)による『太陽熱テイクオフ大会ソーラーシステム振興協会の取り組み』から |
Figure 5: Growth of CSP production under four scenarios (TWh/y) |
Figure 6: Growth of CSP production by region (TWh/y) |
IEA(2010)による『Technology Roadmap Concentrating Solar Power』から |
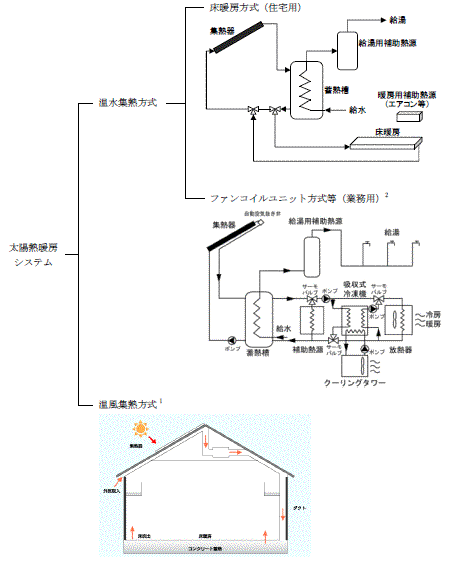
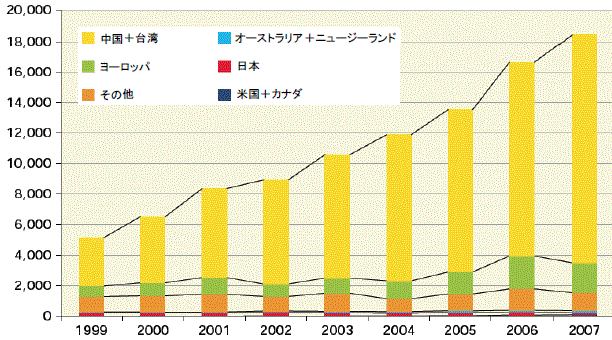
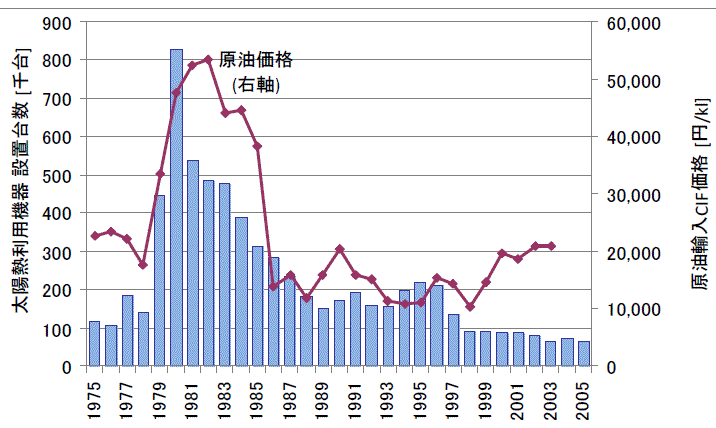
図表8.1 太陽熱暖房システムの分類 出典1:NEDO ホームページ(http://app2.infoc.nedo.go.jp/kaisetsu/) 出典2:「太陽エネルギー新利用システム技術研究開発に係る事前調査」(2004, NEDO) 図表8.7 世界における太陽熱利用機器の導入実績(MWth、単年) 出典:“Solar Heat Worldwide -Markets and Contribution to the Energy Supply 2007”(2009, IEA) 図表8.9 日本における太陽熱利用機器の導入実績(単年) ※原油輸入CIF 価格:運賃や船荷保険料を上乗せした価格(CIF:Cost, Insurance,and Freight) 出典:エネルギー白書2005 年版、NEDO 新エネデータ(http://www.nedo.go.jp/nedata/index.html)、「新エネルギーガイドブック2008」(NEDO)より作成 NEDO(2010)によるNEDO再生可能エネルギー技術白書の中の『その他の再生可能エネルギー等(太陽熱冷暖房、中小水力発電、地熱発電、温泉熱発電・熱利用、雪氷熱利用、海流・潮流発電、潮汐力発電、熱電発電、圧電発電、工場等廃熱利用、温度差熱利用)の技術の現状』から |
図1 ソーラーシステムの基本形態 |
図2 なぜ太陽熱で冷房ができるのか |
原子力百科事典ATOMICA(2004)による『ソーラーシステムのしくみ』から |