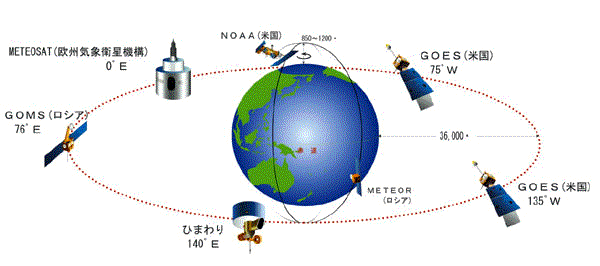
〔気象庁の気象衛星センターの『「ひまわり」を中心とした気象衛星の観測システム』の『全地球規模で気象観測』から〕 |
戻る<1|2|3|4|5|6|7|8|9|10|11|12|13|14|15<
|
|
| 配付プリント等 |
| 補足説明 |
|
|

〔気象庁の気象衛星センターの『「ひまわり」を中心とした気象衛星の観測システム』の『全地球規模で気象観測』から〕 |
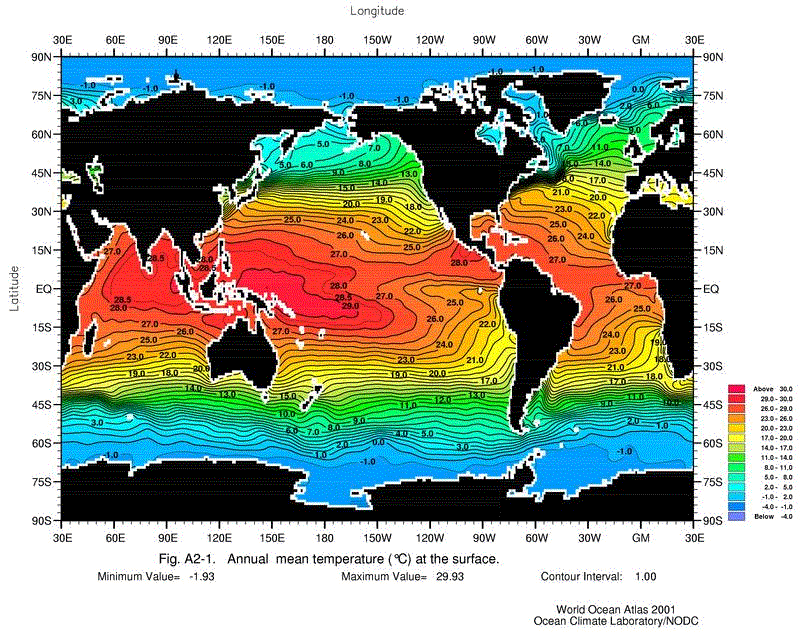 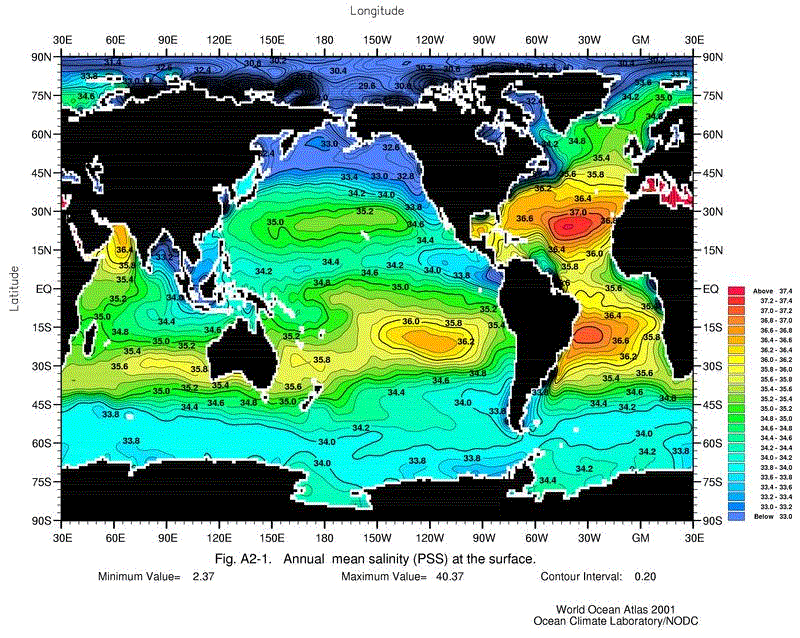 〔NODCの『OCL』の『OCL Products』の中の『World Ocean Atlas 2001 Figures (WOA01F) 』から〕 |
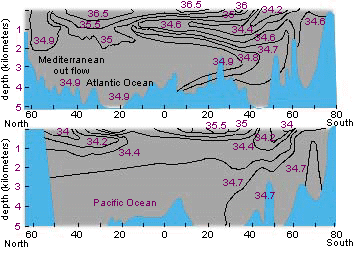 Figure 1. The salinities of Earth's Oceans measured in ‰.(塩分:上は大西洋、下は太平洋) 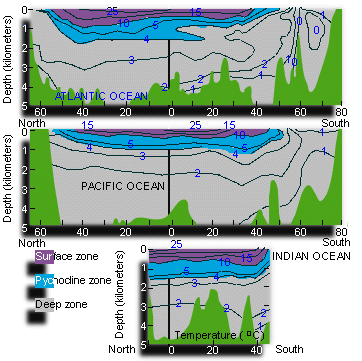 Figure 2: Thermal structure of Earth's Oceans.(水温:上は大西洋、中は太平洋、下はインド洋) 〔The University of Michigan's Global Change CurriculumのIntroduction to Global Changeの『Global Change 1』の中の『The Blue Planet: Salinity, Circulation, and the Conveyor Belt』から〕 緯度によらず、海洋底は1~2℃。 |
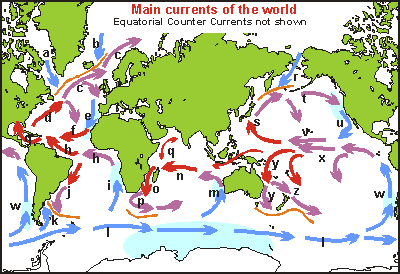 |
a Labrador Current b East Greenland C. c North Atlantic Drift d Gulf Stream e Canary C. f North Equatorial C. g Caribbean C. h South Equatorial C. i Benguela C. j Brazil C. k Falkland C. l West Wind Drift m West Australian C. |
n South Equatorial C. o Mozambique C. p Agulhas C. q Monsoon Drift r Kamchatka C./Oya Shio s Kuro Shio C. t North Pacific Drift u California C. v North Equatorial C. w Peru/ Humboldt C. x South Equatorial C. y East Australia C. z East Auckland C. |
|
〔Seafriends Marine Conservation and Education Centreによるseafriendsの『oceanography』の中の『Oceanography - currents』から〕 主な海流。 |
||
【ブロッカー(Wallace Smith Broecker Broecker;1931年~)による海洋ベルトコンベア】
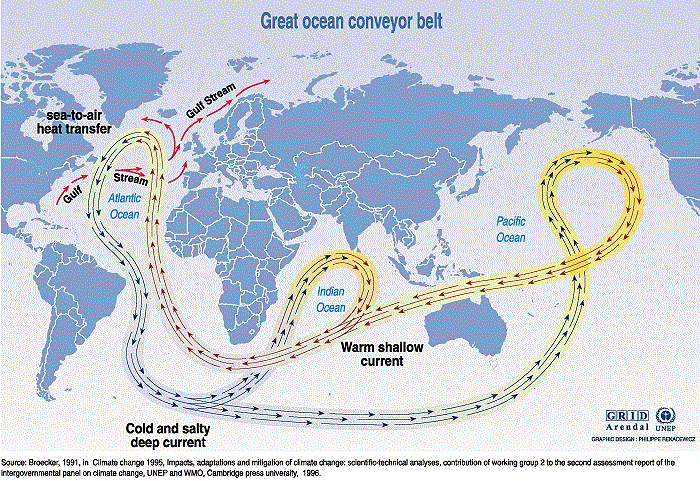 〔UNEPの『Maps & Graphics』の『Vital Climate Graphics』の『Potential impacts of climate change』から〕 ブロッカーによる海洋ベルトコンベアモデル。 |
| 参考 |
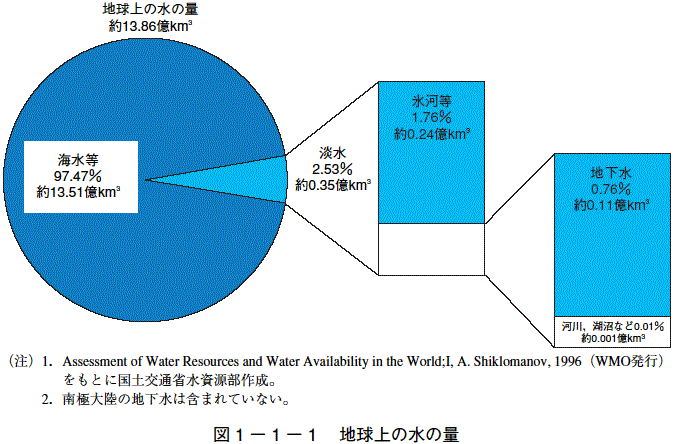 〔国土交通省の『土地・水資源関係』の『水資源部』の中の『日本の水資源』の『平成16年版 日本の水資源』の『第Ⅱ編第1章本文』から〕 |
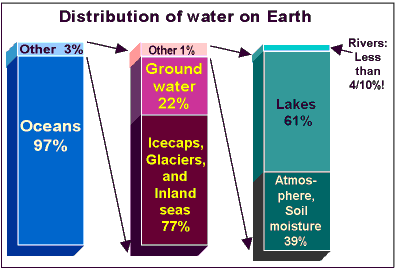
Source: Nace, U.S. Geological Survey, 1967 〔米国地質調査所によるWater Science for Schoolsの『Earth's Water』の『Earth's water distribution』から〕 地球上の水の分布。 |
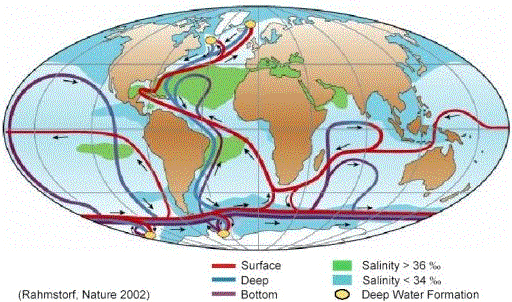 Figure 1. Schematic representation of the global thermohaline
circulation(熱塩循環). 〔Potsdam Institute for Climate Impact ResearchのStefan Rahmstorf氏による『The Thermohaline Ocean Circulation A Brief Fact Sheet』から〕 ブロッカーのモデルの改訂版。 |
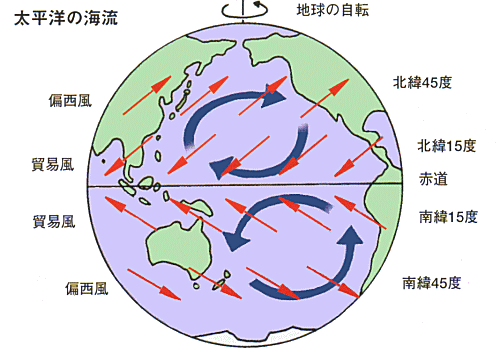 〔(財)日本海事広報協会による海と船なるほど豆事典の『海の自然のなるほど』の『海流はどうしておきるの』から〕 地表の温度は、赤道地域で高くて極地域で低いが、その温度差をなくすように大気と海水は動く。大気の場合は「大気の大循環」と呼ばれる循環となるが、海水の場合は表層での「海流」とよばれる循環ならびに深層も含めた海洋の大循環(上の『海洋ベルトコンベア』)として循環する。海流はとくに大気(風)の影響を強く受ける。 |