|
最終更新日:2017年8月2日
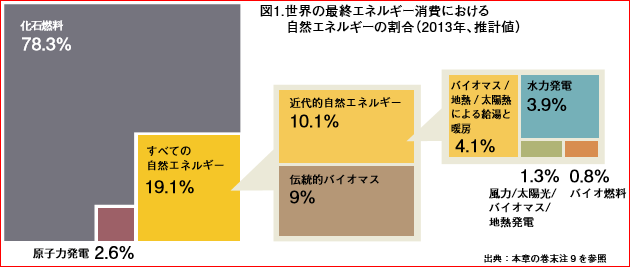
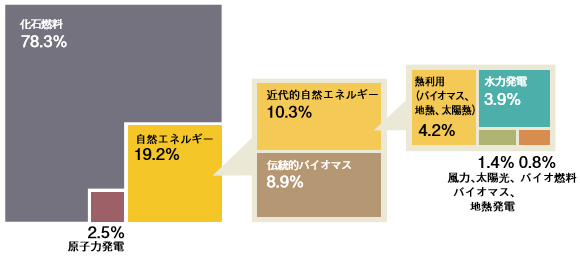
世界の最終エネルギー消費における自然エネルギーの割合(2014年、推計値) |
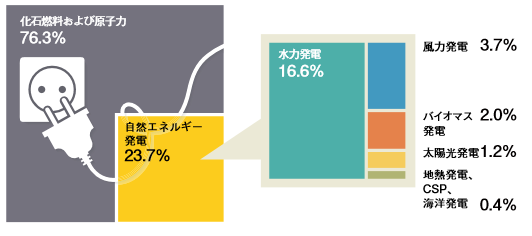
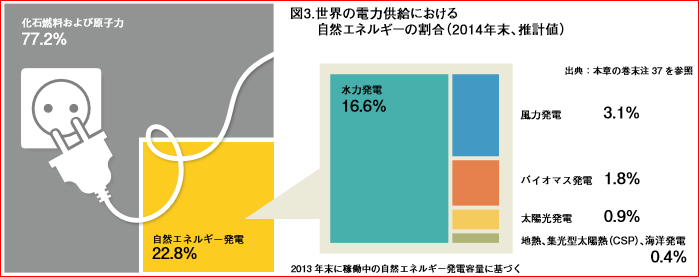
世界の電力供給における自然エネルギーの割合(2015年末、推計値) 2015年末に稼働中の自然エネルギー発電容量に基づく。四捨五入のため、合計値は必ずしも整合しない。 |
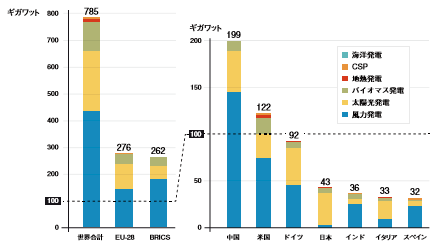
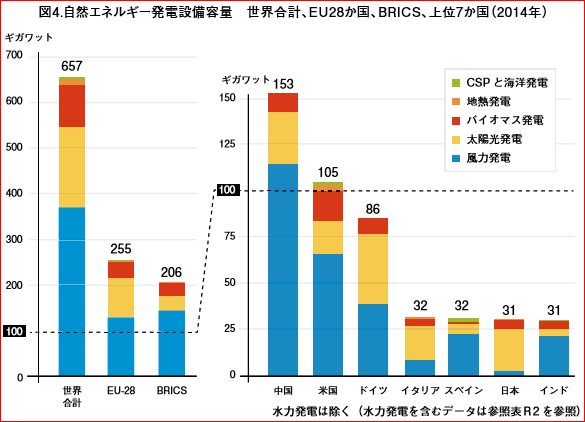
自然エネルギー発電設備容量 世界合計、EU28か国、上位7か国(2015年末) |
|
ISEPによる『自然エネルギー世界白書
2016』から ※ISEPによる『自然エネルギー白書2016』(120p)および『世界と日本の自然エネルギーの現状(2016年データ)』(10枚)も参照。 ※REN21によるGlobal Status Reportの『Renewables 2017 Global Status Report』(302p)も参照。 |
|
|
|
|
ISEPによる『自然エネルギー世界白書 2015』から |
|
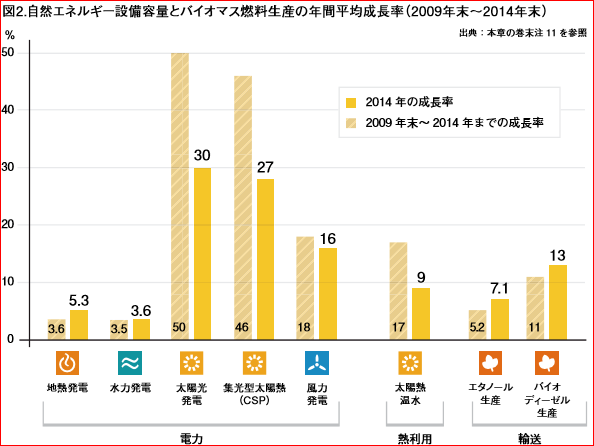
図2:自然エネルギー設備容量とバイオマス燃料生産の年間平均成長率(2008年末〜2013年末) |
|
図4.自然エネルギー発電設備容量 世界合計、EU28か国、BRICS、上位6か国(2013年) |
ISEPによる『自然エネルギー世界白書 2014』から |
図 1.3:世界の自然エネルギー市場のトレンド (出典:UNEP, Global Trends in Renewable Energy Investment 2013 より ISEP 作成)。 |
図 1.6:世界の最終エネルギー需要に占める自然エネルギーの割合(2011年) 出典:「自然エネルギー世界白書 2013」(REN21)。 |
|
注:2012年末時点で稼働中の自然エネルギー発電容量に基づく。 図 1.8:世界の電力供給における自然エネルギーの推計割合(2012年) (出典:「自然エネルギー世界白書 2013」REN21)。 |
図 1.7:自然エネルギー設備容量とバイオ燃料生産の年間平均成長率 (出典:「自然エネルギー世界白書 2013」REN21)。 |
|
|
図 1.16: 日本国内の自然エネルギーによる発電量の推計(ISEP 調査) |
図 1.17:日本の 100% 自然エネルギーシナリオ(WWF ジャパン、2011年) |
図 1.19:環境省の調査による自然エネルギーの地域別導入ポテンシャル(環境省の調査結果を基に ISEP 作成) |
図 1.18:都道府県別の自然エネルギー電力供給割合ランキング(出所:永続地帯研究会) |
|
ISEPによる『自然エネルギー白書 2014』から |
図表0-1 再生可能エネルギーの概念図 注(1) 本表は経済産業省の公表資料に基づき会計検査院で作成した。 |
図表0-2-2 平成25年度末における我が国の再エネ発電設備の導入状況 (注) 本表は経済産業省「再生可能エネルギー発電設備の導入状況について」に基づき会計検査院で作成した。 |
会計検査院(2014/10)による『会計検査院法第30条の2の規定に基づく報告書 再生可能エネルギーに関する事業の実施状況等について』 |
出典:全シナリオ名、及び引用文は、「補足欄2:掲載シナリオ一覧」参照 |
情報源: この章については巻末注19 と補足欄2 を参照。 |
出典:本章については後注25 参照 |
情報源: 正確なシナリオ名と引用は補足欄2、シナリオの要約はオンライン補足情報「シナリオ概要報告」を参照。 |
出典:全シナリオ名、及び引用文は、「補足欄2:掲載シナリオ一覧」参照 |
|
環境エネルギー政策研究所(ISEP)による『世界自然エネルギー未来白書(Renewables Global Futures Report)』(2013/2)から |
注:表中には概算値を示している。 注:順位は投資額、発電容量、バイオ燃料生産量の絶対量に基づいている。自然エネルギー発電設備容量、太陽光発電、太陽熱温水/
暖房の国民一人あたりの容量の国別順位でみられるように、一人当たりの数値では多くのカテゴリーで順位が大きく異なることが分かる。設備容量(GW)よりも発電量(TWh)を考慮した場合、水力発電の国別順位は変動する。これはいくつかの国ではベースロードの供給を水力発電に依存しているが、その他の国では電力需要に追従したり、ピーク対応をさせているためである。 図1. 世界の最終エネルギー消費における自然エネルギーの割合(2010年) 出典:本章の巻末注1を参照 環境エネルギー政策研究所(ISEP)による『自然エネルギー世界白書 2012』(REN21によるRenewables 2012 Global Status Reportの和訳)から |
Figure 1. Renewable Energy Share of Global Final Energy Consumption, 2010 |
Figure 2. Average Annual Growth Rates of Renewable Energy Capacity and Biofuels Production, 2006-2011 |
Figure 3. Estimated Renewable Energy Share of Global Electricity Production, 2011 |
Figure 4. Renewable Power Capacities1, EU 27, BRICs, and Top Seven Countries, 2011 |
REN21による『Renewables 2012 Global Status Report』から |
|
|
|
|
REN21〔ISEP訳〕(HP/2012/7)による『自然エネルギー世界白書2011』から |
Figure 1: The levelised cost of renewable power generatiobn technologies Note: Assumes the cost of capital is 10%. The bands reflect ranges of typical investment costs (excluding transmission and distribution) and capacity factors. PT = Parabolic Trough, ST = Solar Tower, BFB/CFB = Bubbling Fluidised Bed/CirculatingG Fluidised Bed, AD = Anaerobic Digester, CHP = Combined Heat and Power. IRENA(2012/11)による『Renewable Power Generation Costs』から |
REN21〔ISEP訳〕(HP/2011/6)による『自然エネルギー世界白書2010』から |
|
|
|
|
|
|
REN21〔ISEP訳〕(HP/2011/6)による『自然エネルギー世界白書2010』から |
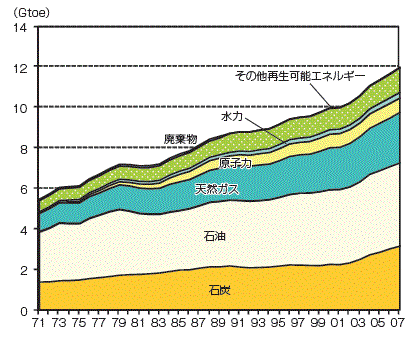
【第121-2-2】世界の再生可能エネルギー消費構成(2007) (出所) IEA「Energy Balances of Non-OECD Countries(2009 年版)」をもとに作成 【第121-2-1】世界の一次エネルギー供給の推移 (出所) IEA「Energy Balances of Non-OECD Countries(2009 年版)」をもとに作成 資源エネルギー庁(2010)による『平成21年度エネルギーに関する年次報告(エネルギー白書)』から |
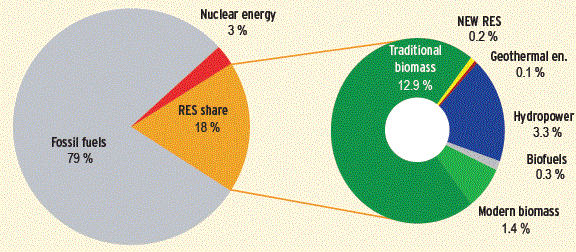
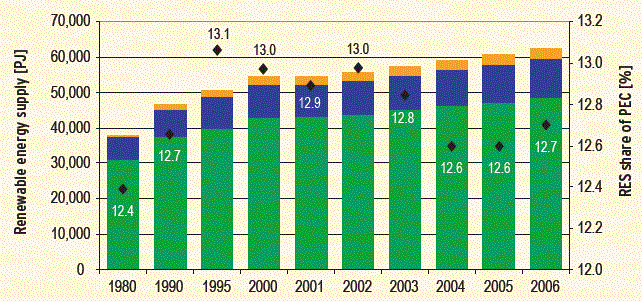
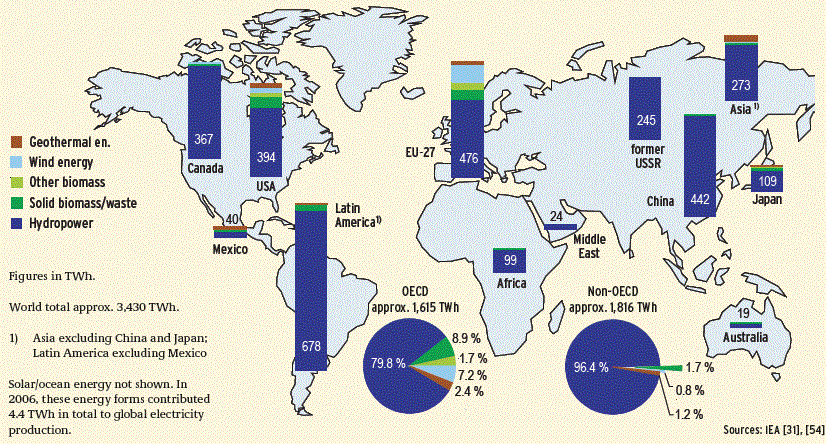
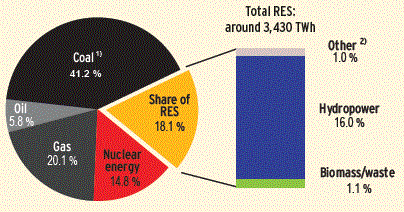
Structure of global final energy consumption, 2006 The global final energy share is higher than the global primary energy share. This is partly due to traditional biomass, all of which represents final energy consumption. Furthermore, the level of primary energy share also depends on the method used to calculate the primary energy equivalent of renewable energy sources, cf. Appendix, para 5, 11 and 12. New RES = Wind, solar and ocean energy Source: according to REN21 [33] Global development of renewable primary energy supply and share of renewable energy sources (RES) 1) Only includes the renewable portion of waste. On calculation of the RES share, cf. also Appendix, para 12. Sources: IEA [31], [54] Electricity generation from renewable energy sources in various regions, 2006 Share of renewable energy sources in global electricity generation, 2006 At 16 %, global electricity generation from hydropower is higher than that from nuclear energy (14.8 %). Looking at the PEC shares, this ratio is inverted, with nuclear energy providing a considerably higher share of PEC at 6.2 % than hydropower at 2.2 %. The reason for this distortion is that according to international agreements, electricity from uclear power is rated at an average conversion effi ciency of 33 % in relation to primary energy, while electricity from hydropower is rated at a conversion effi ciency of 100 % according to the so-called physical energy content method; cf. Appendix, para. 5. 1) Includes non-renewable portion of waste (0.2 %). 2) Geothermal energy, solar energy, wind energy, ocean energy. Sources: IEA [31], [54] Federal Ministry for the Environment, Nature Conservation and Nuclear Safety (BMU)(2009)による『Renewable Energy Sources in Figures National and International Development』から |
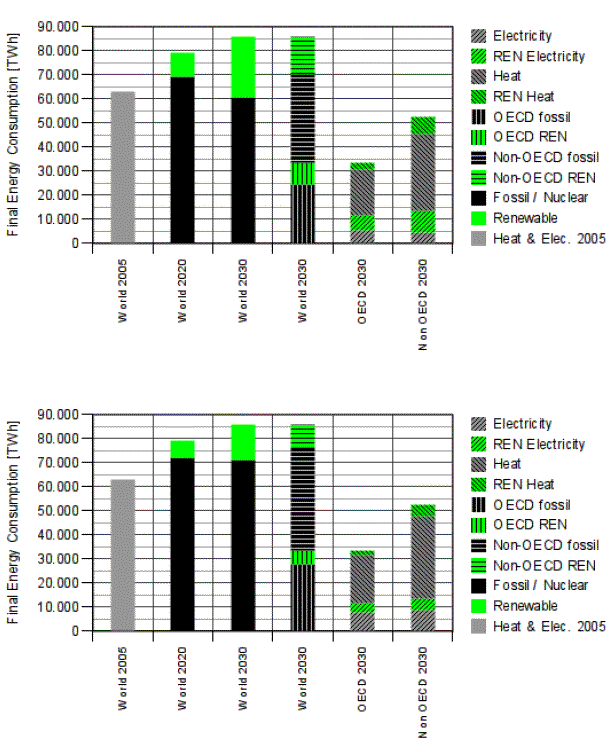
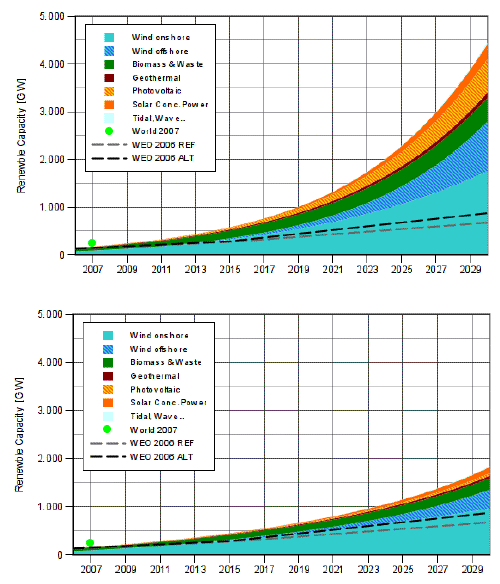
The first bar shows the final energy demand in 2005 (grey), without breakdown to fossil or renewable sources. Bars 2 an d 3 show the development of final energy demand up to 2030, the renewables contribution (always green) according to the scenarios and the fossil & nuclear contribution (always black or grey). The remaining bars provide more details on the figure for 2030. Bar 4 shows the values for OECD (vertically hatched, black is fossil, green is renewable) and non-OECD (horizontally hatched). Bars 5 and 6 show details for OECD (bar 5) and non-OECD (bar 6), broken down to electricity (hatched lower left to upper right) and heat (hatched upper left to lower right). Again renewewables are green but fossils are grey this time. Figure 3: Development of “new” renewable electricity generating capacities in the world regions in the ”High Variant” (upper figure) and ”Low Variant Scenario” (lower figure) [EWG; 2008].Data on renewable capacity 2007: [REN 21; 2007]. 〔Peter,S. and Lehmann,H.(2008)によるRenewable Energy Outlook 2030 Energy Watch Group Global Renewable Energy Scenariosから〕 |
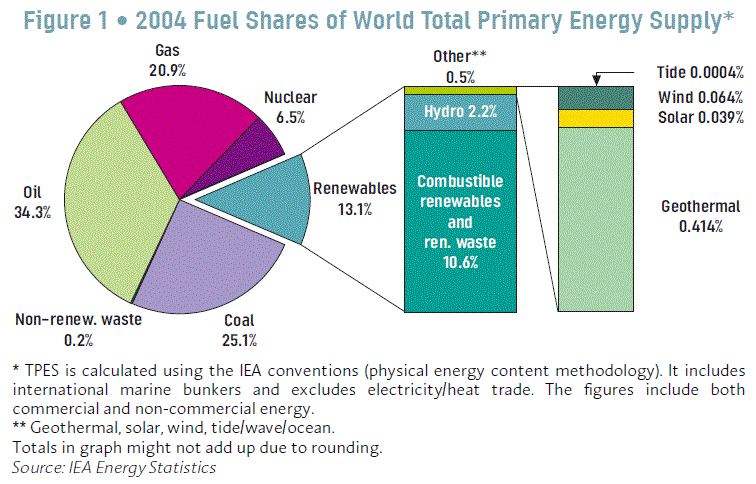
IEA(2007)による『Renewables in Global Energy Supply An IEA Fact Sheet』から |