『Abstract
It is generally assumed that oceanic gas hydrates contain a huge
volume of natural gases, mainly methane. The most widely cited
estimate of global hydrate-bound gas is 21×15 m3 of
methane at STP (or 〜10,000 Gt of methane carbon), which is proposed
as a “consensus value” from several independent estimations. This
large gas hydrate reservoir is further suggested as an important
component of the global carbon cycle and as a future energy source.
Here, I present a revised and updated set of well-justified global
estimates and discuss how and why they changed over time. It appears
that the global estimates of hydrate-bound magnitude from 1970s−early
1980s (estimates on the order of 1017−1018
m3) to late 1980s−early 1990s (1016 m3)
to late 1990s−present (1014−1015 m3).
The decrease of estimates is a result of growing knowledge of
the distribution and concentration of gas hydrates in marine sediments
and ongoing efforts to better constrain the volume of hydrate-bearing
sediments and their gas yield. These parameters appear to be relatively
well constrained at present through DSDP/ODP drilling and direct
measurements of gas concentrations in sediments. The global estimate
of hydrate-bound gas that best reflects the current knowledge
of submarine gas hydrate is in the range (1−5)×1015
m3 (〜500−2500 Gt of methane carbon). A significantly
smaller global gas hydrate inventory implies that the role of
gas hydrates in the global carbon cycle may not be as significant
as speculated previously. Gas hydrate may be considered a future
energy source not because the global volume of hydrate-bound gas
is large, but because some individual gas hydrate accumulations
may contain significant and concentrated resources that may be
profitably recovered in the future.
Keywords: Gas hydrate; Methane; Global estimates; Carbon cycle;
Energy source』
1. Introduction
『
| 最低値−最高値 | 最もよい見積り | 文 献 |
| 5−25 | Trofimuk et al.(1977) | |
| 7600 | Dobrynin et al.(1981) | |
| 3.1 | McIver(1981) | |
| 40 | Kvenvolden and Claypool(1988) | |
| 10 | Makogon(1981) | |
| 21 | Kvenvolden(1988) | |
| 21 | MacDonald(1990) | |
| 26−140 | 26 | Gornitz and Fung(1994) |
| 23−91 | 46 | Harvey and Huang(1995) |
| 1 | Ginsburg and Soloviev(1995) | |
| 7 | Holbrook et al.(1996) | |
| 15 | Makogon(1997) | |
| 2−20 | Dickens et al.(1997) |
2. Review of global estimates in a chronological order
『
|
|
平均値 |
|
| 3021−3085 | 3053 | Trofimuk et al.(1973) |
| 1135 | Trofimuk et al.(1975) | |
| 1573 | Cherskiy and Tsarev(1977) | |
| 〜1550 | Nesterov and Salmanov(1981) | |
| >0.016 | Trofimuk et al.(1977) | |
| 〜110−130 | 〜120 | Trofimuk et al.(1979) |
| 3.1 | MIver(1981) | |
| 5−25 | 15 | Makogon(1981), Trofimuk et al.(1981,1983a) |
| 15 | Trofimuc et al.(1983b) | |
| 40 | Kvenvolden and Claypool(1988) | |
| 〜20 | Kvenvolden(1988) | |
| 20 | MacDonald(1990) | |
| 26.4−139.1 | 26.4 | Gornitz and Fung(1994) |
| 〜22.7−90.7 | 〜45.4 | Harvey and Huang(1995) |
| 1 | Ginsburg and Soloviev(1995) | |
| 〜6.8 | Holbrook et al.(1996) | |
| 15 | Makogon(1997) | |
| >0.2 | Soloviev(2002) | |
| 3−5 | 4 | Milkov et al.(2003) |
| 1−5 | 2.5 | 本研究 |
| 太字はさらなる分析に根拠となる見積りとして用いられたことを示し(詳細は本文を参照)、イタリック字はそれぞれの著者によって示されたデータから計算された見積りを示す。 | ||
3. Discussion
3.1. Decrease of global estimates as a function of time and the
growing understanding of natural gas hydrate
3.2. How much is really out there?
4. Implications
4.1. Gas hydrate as a component of the global carbon cycle
『
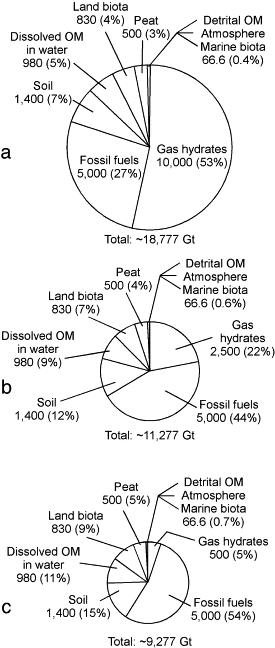
図4 世界のハイドレート量の見積りが異なる場合の、地球の有機炭素の分布(ケロジェンおよびビチューメンのような分散した有機炭素は除く)。値は炭素Gt(ギガトン)。
(a) ガスハイドレート中のメタン炭素の見積りを10000Gtとした場合の分布(Kvenvolden, 1993)。
(b) 世界のハイドレートに固定されたガスの体積が上限値であると仮定して、世界のガスハイドレートの見積りを改定した場合の分布。
(c) 世界のハイドレートに固定されたガスの体積が下限値であると仮定して、世界のガスハイドレート量の見積りを改定した場合の分布。』
4.2. Gas hydrate as a potential energy source
5. Conclusions
Acknowledgements
References