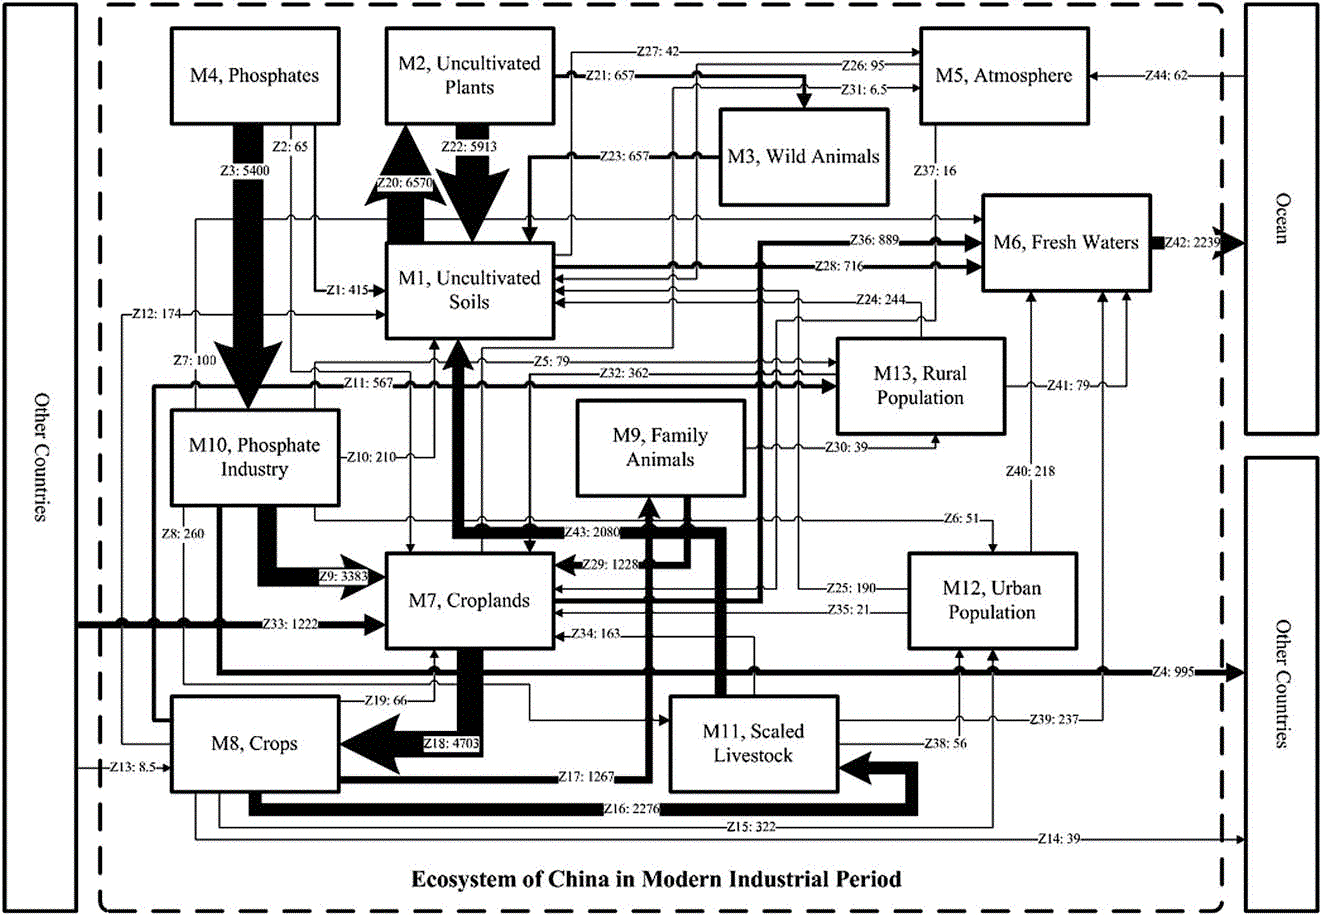
Fig. 3. Phosphorus metabolism network model of China in modern industrial period (kt).
〔Fan,Y., Hu,S., Chen,D., Li,Y. and Shen,J.(2009)によるThe evolution of phosphorus metabolism model in Chinaから〕
『Abstract
It is important to analyze why phosphorus metabolism is unsustainable
in China's modern industrial society. In this paper, the Substance
Flow Analysis (SFA) approach is used to build different models
of phosphorus metabolism for the following three periods: the
prehuman period, traditional agricultural period and modern industrial
period. Based on these models, the evolution process of phosphorus
metabolism in China is analyzed from the viewpoint of its metabolic
structure and intensity. The indices of intensity analysis involve
phosphorus input, phosphorus circulation and recycling efficiency,
phosphorus production and production efficiency, water phosphorus
emission and water emission proportion, solid waste phosphorus
output and solid waste discharge proportion. Though the analysis
of the evolution process, the key factors that cause the lack
of sustainability of phosphorus metabolism in China are identified,
which can be summarized by four aspects: the increase of soil
phosphorus accumulation, the increase of water phosphorus emission,
the decrease of recycling efficiency and the decrease of production
efficiency in croplands. Furthermore, the specific unsustainable
processes of phosphor resources utilization in China are discussed.
For these unsustainable processes, the relevant solutions for
the phosphor resources crisis are given.
Keywords: Phosphor resource; Metabolism; Evolution; Substance
Flow Analysis (SFA)』
1. Introduction
2. Modelling of the phosphorus metabolism network in China
2.1. Phosphorus metabolism in the prehuman period
2.2. Phosphorus metabolism in the traditional agricultural period
2.3. Phosphorus metabolism in the modern industrial period
3. Evolution of phosphorus metabolism model in China
3.1. Structure evolution
3.2. Intensity evolution
4. Discussion and conclusion
(1) Increase of soil phosphorus accumulation
(2) Increase of water phosphorus emission
(3) Decrease of recycling efficiency
(4) Decrease of production efficiency of croplands
References
 Fig. 3. Phosphorus metabolism network model of China in modern industrial period (kt). 〔Fan,Y., Hu,S., Chen,D., Li,Y. and Shen,J.(2009)によるThe evolution of phosphorus metabolism model in Chinaから〕 |
|
非耕作 土壌 |
非耕作 植物 |
非耕作 動物 |
リン産業 | 農耕地 | 農作物 |
Family Animals |
Scaled Livestock |
農村人口 | 都会人口 | |
| リン入力(1000トン/年) | 9978 | 6570 | 657 | 5400 | 6526 | 4712 | 1267 | 2536 | 685 | 429 |
| リン循環(1000トン/年) | 8824 | - | - | - | 1840 | - | 0 | 0 | - | - |
| リサイクル効率(%) | 88.4 | - | - | - | 28.2 | - | 0 | 0 | - | - |
| リン生産(1000トン/年) | 6570 | 657 | - | 4768 | 4703 | 4481 | 39 | 56 | - | - |
| 生産効率(%) | 65.8 | 10.0 | - | 88.3 | 72.1 | 95.1 | 3.1 | 2.2 | - | - |
|
水によるリン排出 (1000トン/年) |
716 | 0 | 0 | 100 | 889 | 0 | 0 | 237 | 79 | 218 |
| 水排出割合(%) | 7.2 | 0 | 0 | 1.9 | 13.6 | 0 | 0 | 9.3 | 11.5 | 50.8 |
|
固体廃物によるリン出力 (1000トン/年) |
- | 0 | 0 | 210 | - | 174 | 0 | 2080 | 244 | 190 |
| 固体廃物流出割合(%) | - | 0 | 0 | 3.9 | - | 3.7 | 0 | 82.0 | 35.6 | 44.3 |