Chen,M., Chen,J. and Sun,F.(2008): Agricultural
phosphorus flow and its environmental impacts in China. Science
of the Total Environment, 405, 140-152.
『中国における農業リン・フローとその環境インパクト』
『Abstract
The transfer of nutrients from agricultural land to waters attracts
the attention of policy makers as well as scientists as it plays
an increasingly significant role in affecting the water environment.
It is therefore essential to first understand the nutrient flow
in agricultural systems and then correspondingly formulate a series
of cost-effective policies and best management practices (BMPs).
On the basis of an emission inventory analysis (EIA) and a nutrient
full balance (NFB) calculation, this paper presents a partial
substance flow analysis (SFA) method, as well as an Agricultural
Phosphorus Flow Analysis (AgiPhosFA) model, to describe the phosphorus
(P) flow in the agricultural systems in China and assess the impact
of human activities on waters driven by agriculture and rural
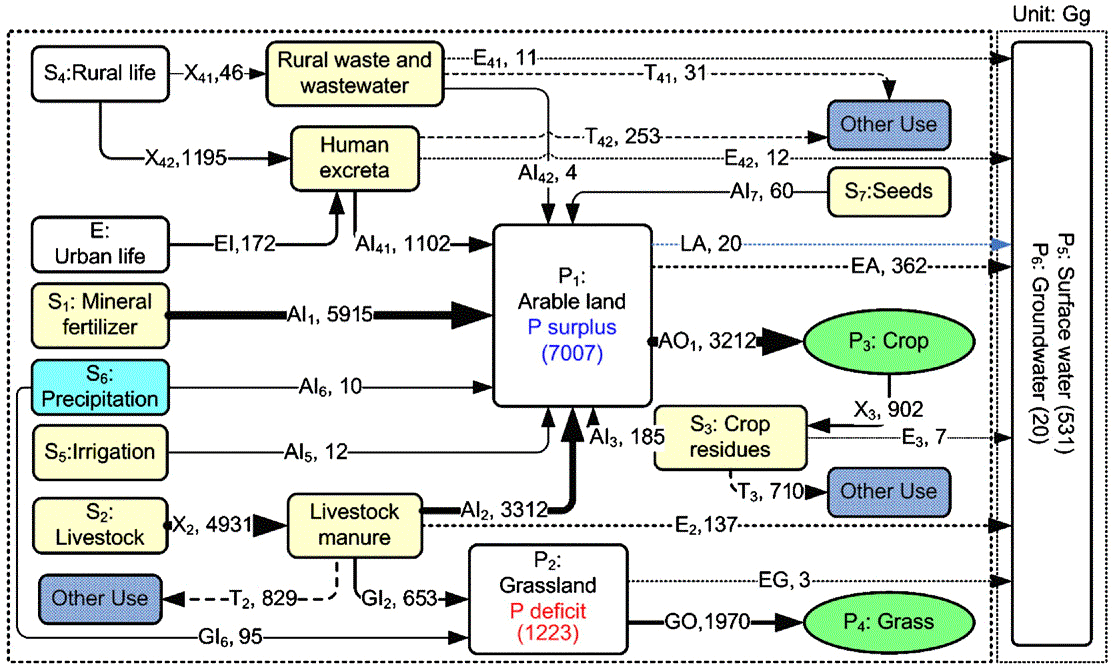
life. It is estimated that average P input and output were 28.9
kg ha-1 a-1 and 14.2 kg ha-1
a-1 respectively in China in 2004, while the total
P utilization efficiency (Plant uptake P/P input) in agriculture
was 45.7% leading to an average P surplus of 14.7 kg ha-1
a-1. Excessive P application through mineral fertilizer
in the arable farming system has led to the accumulation of soil
P and constituted a risk to the recipient water quality, whereas
the grassland grazing system is confronted with a severe P deficit
problem which has resulted in widespread grass degradation. Therefore
it may be an efficient way to mitigate the problems simultaneously
by regulating and balancing the P flows between the two systems.
Uncertainties of the method and model are also discussed in terms
of model conceptualization, data and parameters, and spatial and
temporal variability.
Keywords: agricultural pollution; Emission inventory; Nutrient
balance; Phosphorus; Substance flow analysis; Uncertainty』
1. Introduction
1.1. Driving forces of agricultural pollution in China
1.2. The biogeochemistry of phosphorus
1.3. Aims of the study
2. The methodology and data
2.1. The model of agricultural phosphorus flow analysis (AgiPhosFA)
2.2. Statistical data and coefficients
3. Results and discussion
3.1. Full phosphorus balance in Chinese agriculture in 2004
3.2. Phosphorus flow in Chinese agriculture in 2004
3.3. P release from soil into water in Chinese agriculture in
2004
3.4. Uncertainties in the methodology and the model
3.4.1. Conceptualization of the system
3.4.2. Data and parameters
3.4.3. Spatial and temporal variability
4. Conclusion and further work
Acknowledgements
References
ホームへ


