Table of contents
Acknowledgement
1. Introduction
2. The global P-cycle
2.1. Flows
2.2. Reservoirs3. Production and use of P-resources
3. Production and use of P-resources
3.1. P mining
Resources
Products
Quality
Content and waste
Radioactivity
Cadmium
Geopolitics
3.2. Future demand for P
Current use of fertilizer P
Global
EU27
NL
Trends in demand for P fertlizer
Duration of resources
First estimates using annual growth percentage in demand
Effect of increasing global population and urbanization
Effect of changing diets
Increased production of feed
More meat in the diets
Effect of bioenergy crops
Aquaculture
Pooled estimate for future demand
3.3. Losses in the P-cycle
Mining losses
Erosion
The P-balance on crop land and fertilization
Human excreta
Slaughter waste
Animal manure
4. Possibilities for efficient use and re-use
Increase efficiency in agricultural production systems
Recovery from seawater
Recovery from sewage sludge and slaughter waste
5. Discussion
6. Conclusions & Summary
7. References
|
|
|
大気からの沈着 | 3-4 | 3 |
浸食および流出 | 25-30 | 19-22 |
植物による摂取 | ||
陸上 | 70-100 | 71-200 |
海洋 | 900-1200 | 600-1100 |
海洋堆積物への埋没 | 20-35 | 8-9 |
海から陸へ(漁業) | 0.3 | |
鉱業によるP | 12-14* | |
* 2008年に、肥料としての消費が約18(100万トンP/年)となった。 |
|
(100万トンP) |
文献 |
|
R1 | 堆積物(地殻の岩石と60cm以深の土壌と海洋堆積物) | 800,000,000-4,000,000,0000 | 1 |
R2 | 土壌(0-50cm) | 40,000-50,000 | 2 |
無機P | 35,000-40,000 | 2 | |
有機P | 5,000-10,000 | 2 | |
R7 | 鉱業利用可能なP | 2,400-6,600 | 3 |
海洋 | 93,000 | 2 | |
R4 | 表層、0-300m(全溶存P) | 3,000 | 1 |
R5 | 深層、300-3300m(全溶存P) | 90,000 | 1 |
R3 | 陸上の植物体 | 500-550 | 2 |
動物体 | 30-50 | 2 | |
人体 | 3 | 2 | |
R6 | 海洋植物体 | 50-140 | 1 |
R8 | 大気中 | 0.028 | 1 |
1=Ruttenberg、2=Smil、3=Jasinski。 |
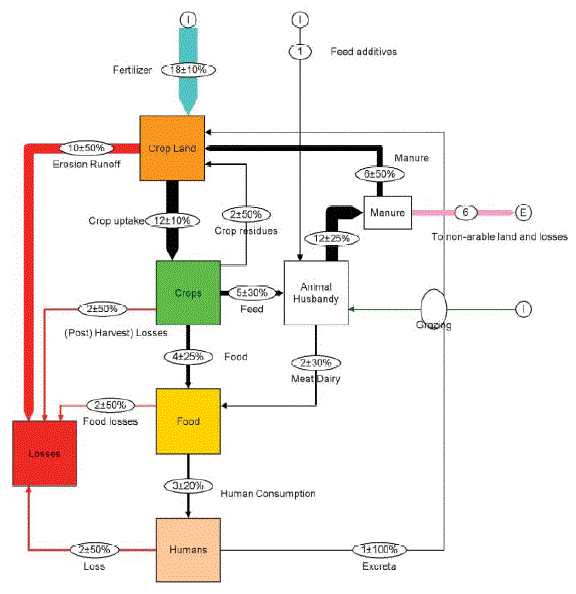
Smit,A.L., Bindraban,P.S., Schroder(oの頭に´), J.J., Conijn,J.G. and vander Merr,H.G.(2009)による『Phosphorus in agriculture: global resources, trends and developments』から 図1.入力(I、流入)と出力(O、流出)および耕地の食料生産体系(Cordell, 2008, 2009による)を通じてSmil(2000, 2007)とLiu et al.(2008)のデータと我々の計算も考慮した、世界における主要なリン・フロー図 |