Parfitt,R.L., Schipper,L.A., Baisden,W.T.
and Elliott,A.H.(2006): Nitrogen inputs and outputs for New
Zealand in 2001 at national and regional scales. Biogeochemistry,
80, 71-88.
『2001年のニュージーランドの国と州での窒素収支』
『Abstract
The Nanjing Declaration on Nitrogen Management, signed in Nanjing
in October 2004, calls for national governments to optimize N
management by several strategies including assessment of N cycles.
Here we develop a first N budget for New Zealand (267,000 km2),
at both national and regional scales. The national inputs are
estimated to be 36.5 kg/ha, mainly from biological N fixation,
but also increasingly from fertilizer application and atmospheric
deposition. The outputs are estimated at 40.5 kg/ha. Biological
N fixation from legumes in pasture was the most important input
in most regions. Exceptions were Auckland, with a large urban
population, and the West Coast of the South Island, with large
tracts of rain forest. Outputs were distributed in the order leaching>ammonia
volatilisation>erosion = produce = denitrification. These outputs
are very different from global averages because of the large numbers
of grazing animals on pasture. A large loss occurs between the
subsoil and the oceans, and further research is needed to identify
these pathways. Riverine export of N was generally well correlated
with inputs.
Key words: Aquifers; DON; Groundwater; Nitrate; Rivers; Sediment』
Introduction
Methods
Inputs of N
N fixation by pasture legumes
Other biological N fixation, and deposition from the atmosphere
Outputs of N
Ammonia volatilisation and redeposition
Produce exported overseas and consumed in NZ
Loss of N by erosion to ocean and by burial in landslides
Leaching, loss to aquifers, attenuation in water, and export
of solutes in rivers to oceans
N2O emissions and denitrification
Fires
Forest storage
Results and discussion
Inputs of N
Outputs of N
Leaching, erosion and transport to oceans
Gaseous losses
Produce exported overseas and consumed in New Zealand
Forest storage
Unresolved gains and losses
Comparisons with other countries
Conclusions
Acknowledgements
References

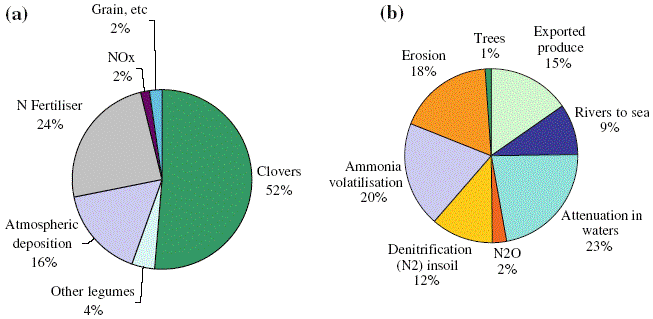
Figure 4. Estimates of (a) nitrogen sources and inputs
− total 976 Gg N (36.5 kg N/ha) and (b) nitrogen storage and
losses − total 1079 Gg N (40.5 kg N/ha).

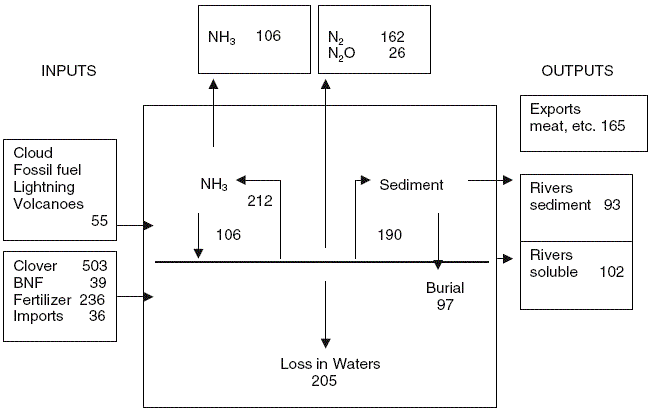
Figure 5. Inputs and outputs of N for New Zealand in 2001,
Gg N/y.
〔Parfitt,R.L., Schipper,L.A., Baisden,W.T. and Elliott,A.H.(2006):
Nitrogen inputs and outputs for New Zealand in 2001 at national
and regional scales. Biogeochemistry, 80, 71-88.から〕 |
戻る

