『Abstract
Nitrate concentrations approaching and greater than the maximum
contaminated level are impairing the viability of many groundwater
basins as drinking water sources. Nitrate isotope data are effective
in determining contaminant sources, especially when combined with
other isotopic tracers such as stable isotopes of water and 3H-He
ages to give insight into the routes and timing of NO3
inputs to the flow system. This combination of techniques is demonstrated
in Livermore, CA, where it is determined that low NO3
reclaimed wastewater predominates in the NW, while two flowpaths
with distinct NO3 sources originate in the
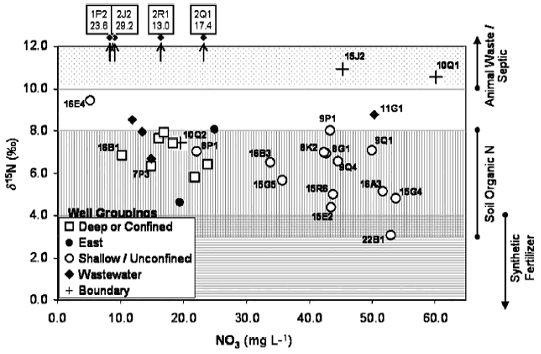
SE. Along the eastern flowpath, δ15N values greater
than 10‰ indicate that animal waste is the primary source. Diminishing
concentrations over time suggest that contamination results from
historical land use practices. The other flowpath begins in an
area where rapid recharge, primarily of low-NO3
imported water (identified by stable isotopes of water and a 3H-He
residence time of <1 year), mobilizes a significant local NO3 source, bringing groundwater concentrations
up to 53 mg NO3 L-1. In this area,
artificial recharge of imported water via local arroyos increases
the flux of NO3 to the regional aquifer.
The low δ15N value (3.1‰) in this location implicates
synthetic fertilizer. In addition to these anthropogenic sources,
natural NO3 background levels between 15
and 20 mg NO3 L-1 are found in
deep wells with residence times greater than 50 a.』
1. Introduction
2. Study site
3. Land use history
4. Methods
4.1. Sample collection
4.2. Laboratory methods
4.3. Isotope and dissolved gas techniques
5. Results and discussion
5.1. Excess nitrogen
5.2. Groundwater sources
5.3. Groundwater chemistry
5.4. Nitrate sources
5.4.1. Applied wastewater
5.4.2. Manure
5.4.3. Fertilizer and soil organic nitrogen
6. Conclusions
Acknowledgements
References
Fig. 6. Nitrate concentrations and δ15N values in groundwater. Expected δ15N ranges for various sources are identified. Several samples from the wastewater region had δ15N values off the scale of the chart, as indicated. Regions represented by well symbols are defined in Fig. 2. 〔Moore,K.B., Ekwurzel,B., Esser,B.K., Hudson,G.B. and Moran,J.E.(2006): Sources of groundwater nitrate revealed using residence time and isotope methods. Applied Geochemistry, 21, 1016-1029.から〕 |