『Abstract
The correspondence between atmospheric CO2 concentrations and
globally averaged surface temperatures in the recent past suggests
that this coupling may be of great antiquity. Here, I compare
490 published proxy records of CO2 spanning
the Ordovician to Neogene with records of global cool events to
evaluate the strength of CO2-temperature
coupling over the Phanerozoic (last 542 my). For periods with
sufficient CO2 coverage, all cool events
are associated with CO2 levels below 1000
ppm. A CO2 threshold of below 〜500 ppm is
suggested for the initiation of widespread, continental glaciations,
although this threshold was likely higher during the Paleozoic
due to a lower solar luminosity at that time. Also, based on data
from the Jurassic and Cretaceous, a CO2 threshold
of below 〜1000 ppm is proposed for the initiation of cool non-glacial
conditions. A pervasive, tight correlation between CO2
and temperature is found both at coarse (10 my timescales) and
fine resolutions up to the temporal limits of the data set (million-year
timescales), indicating that CO2, operating
in combination with many other factors such as solar luminosity
and paleogeography, has imparted strong control over global temperatures
for much of the Phanerozoic.』
1. Introduction
1.1. Temperature records
1.2. CO2 records
1.3. Phanerozoic CO2 and temperature: What
do the records say?
2. Methods
3. Results and discussion
3.1. Fidelity of Phanerozoic CO2 record
3.2. Correlating CO2 to temperature: Late
Ordovician glaciation (Hirnantian; 445.6-443.7 Ma)
3.3. Correlating CO2 to temperature: Late
Devonian and early Carboniferous glaciation (361-349 Ma)
3.4. Correlating CO2 to temperature: Permo-Carboniferous
glaciation (326-267 Ma)
3.5. Correlating CO2 to temperature: Early
Jurassic to Cretaceous cool pulses (184-66.5 Ma)
3.5.1. Late Pliensbachian (184-183 Ma)
3.5.2. Bathonian (167.7-164.7 Ma) and late Callovian to middle
Oxfordian (162-159 Ma)
3.5.3. Valanginian (140.5-139.5 Ma, 137.5-136.5 Ma)
3.5.4. Tithonian to early Berriasian (150-144 Ma) and Aptian
(125.0-112.0 Ma)
3.5.5. mid-Cenomanian (97.5-96.5 Ma) and mid-Turonian (91-89
Ma)
3.5.6. Maastrichtian (71.6-69.6 Ma; 67.5-66.5 Ma; 65.6-65.5
Ma)
3.5.7. Jurassic and Cretaceous summary
3.6. Correlating CO2 to temperature: Late
Cenozoic glaciation (34 Ma - present)
3.7. Future work
4. Conclusion
Acknowledgments
Appendix A. Supplementary data
References
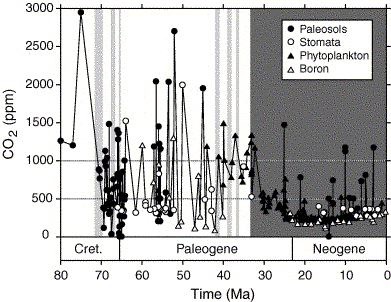
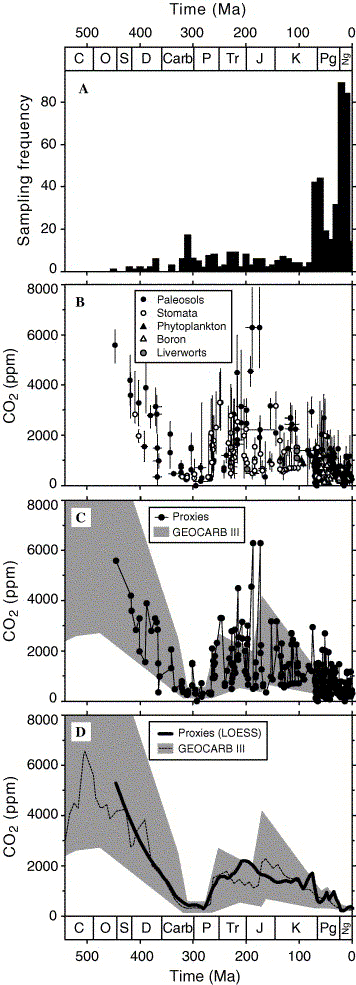
Fig. 1. Atmospheric CO2 through the Phanerozoic. (A) Temporal distribution of the CO2 proxy record, expressed in 10 my time blocks. (B) Phanerozoic CO2 proxy record, categorized by method. Errors in CO2 estimates and ages are given when available. See electronic annex for further details. (C) The same CO2 record as in (B), but expressed as a time series without error bars. Also plotted are the range of reasonable CO2 predictions from the geochemical model GEOCARB III (Berner and Kothavala, 2001). (D) Comparison of the best-guess predictions of GEOCARB III (dashed line) with a smoothed representation of the proxy record (solid line; locally weighted regression [LOESS]; sampling proportion = 0.1; polynomial degree = 2) that best matches the temporal resolution of GEOCARB (〜10 my time-step). This approach differs from Royer et al. (2004), who expressed the proxy record in 10 my time-steps, because here the ages of the GEOCARB output have been calibrated to the timescale of Gradstein et al. (2004) and no longer follow an even 10 my time-step. Fig. 4. CO2 and temperature records for the late Cretaceous to present day (80-0 Ma). The CO2 record is derived from Fig. 1B. Cold periods with strong evidence for geographically widespread ice are marked with dark shaded bands. Cool-to-cold periods with indirect or equivocal evidence for ice (see Section 2 for details) are marked with light shaded bands; such periods supported by only weak evidence are annotated with a question mark. The horizontal dashed lines at 1000 and 500 ppm CO2 represent the proposed CO2 thresholds for, respectively, the initiation of globally cool events and full glacials. 〔Royer,D.L.(2006): CO2-forced climate thresholds during the Phanerozoic. Geochimica et Cosmochimica Acta, 70, 5665-5675.から〕 |