Zhu,Q., Aller,R.C. and Fan,Y.(2006): Two-dimensional pH distributions and dynamics in bioturbated marine sediments. Geochimica et Cosmochimica Acta, 70, 4933-4949.

『生物によって撹乱された海洋堆積物における2次元pH分布とダイナミクス』


Abstract
 The seafloor is the site of intense bigeochemical and mineral dissolution-precipitation reactions which generate strong gradients in pH near the sediment-overlying water interface. These gradients are usually measured in one-dimension vertically with depth. Two-dimensional pH distributions in marine sediments were examined at high resolution (65×65μm pixel) and analytical precision over areas of 〜150 to 225 cm2 using a newly developed pH planar fluorosensor. Dramatic three-dimensional gradients, complex heterogeneity, and dynamic changes of pH occur in the surfacial zone of deposits inhabited by macrofauna. pH can vary by ±2 units horizontally as well as vertically over millimeter scales. pH minima zones often form in association with redoxclines within a few millimeters of inner burrow walls, and become more pronounced with time if burrows remain stable and irrigated for extended periods. Microenvironmental pH minima also form locally around decaying biomass and relict burrow tracks, and dissipate with time (〜5 d). H+ concentrations and fluxes in sandy mud show complex acid-base reaction distributions with net H+ fluxes around burrows up to 〜12 nmol cm-2 d-1 and maximum net reaction rates varying between -90 (consumption) to 120 (production) μM d-1 (〜90 nmol cm-1 d-1 burrow length). Acid producing zones that surround irrigated burrows are largely balanced by acid titration zones along inner burrow walls and outer radial boundaries. The geometry and scaling of pH microenvironments are functions of diagenetic reaction rates and three-dimensional transport patterns determined by sediment properties, such as diffusive tortuosity, and by benthic community characteristics such as the abundance, mobility, and size of infauna. Previously, undocumented biogeochemical phenomena such as low pH regions associated with in-filled relict biogenic structures and burrowing tracks are readily demonstrated by two-dimensional and time-dependent images of pH and sedimentary structure.』

1. Introduction
2. Methods
 2.1. pH planar fluorosensor foil
 2.2. Sensor calibration
 2.3. Optical instrumentation
 2.4. Sediment samples
 2.5. Spatial and temporal two-dimensional pH measurements
 2.6. Proton flux and reaction calculations
3. Results
 3.1. Sensor performance
 3.2. pH distributions in vertically stratified sediment and analytical verification
 3.3. pH distributions and dynamics in burrowed sediments
  3.3.1. General patterns
  3.3.2. Quantitative spatial and temporal concentration - reaction distributions
  3.3.3. pH distributions around infilled burrows and infauna
 3.4. pH distributions and localized decay of reactive organic matter
4. Discussion
5. Conclusions
Acknowledgments
References

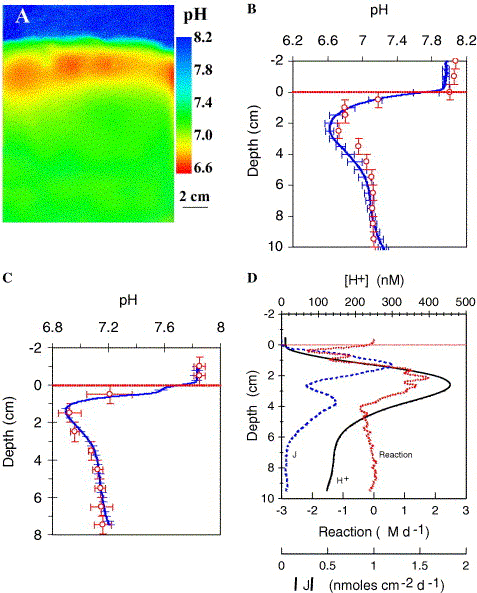
Fig. 2. pH distribution pattern in a largely vertically stratified sediment. (A) Two-dimensional pH distribution pattern (pseudocolored) in subtidal core and overlying water obtained from central Long Island Sound (35 m depth) (September 2003). No distinct burrows are present. (B) The average vertical pH profile of (A) calculated from each horizontal pixel layer (continuous line, ±SD) and that obtained from a minielectrode (open dots) at 1-cm interval measurements. (C) pH distributions in originally homogenized surface sediment obtained from central Long Island Sound (September 2004) measured with the planar fluorosensor (line) and a glass pH mini-electrode (dot) over 1 cm intervals (n = 6). The standard deviation of the fluorosensor measurements were calculated from each horizontal pixel layer (bar). (D) Total H+ concentration distributions, flux vector magnitudes, and net reaction rate averaged across the center 5.75 cm in (A). Model estimates using Eqs. (3a), (3b), (4) and (5) were made in the image plane only.
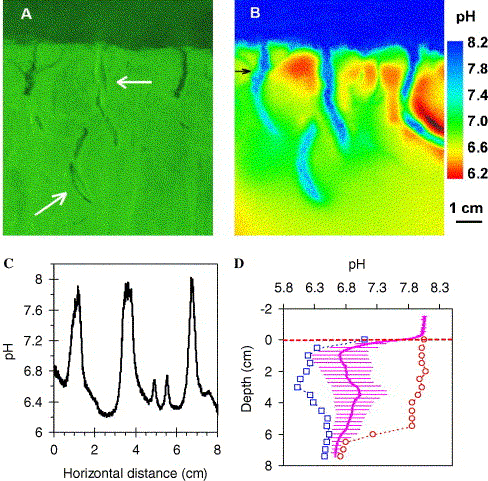
Fig. 3. pH distribution pattern in bioturbated marine sediment. (A) A visible image (green band) of intertidal sediment from Flax Pond (Long Island, USA) (October 2003) incubated for 8 days in the presence of N. succinea (white arrows). At least four burrows formed by the animals are evident at the time of imaging. The two burrows in the middle of the image are inhabited; the rightmost burrow structure was formed on day 1, and remained stable and intermittantly utilized thereafter; the leftmost burrow is younger and was formed on day 8. (B) Corresponding two-dimensional pH distribution of sediment (A). (C) The horizontal pH profile extracted along the black arrow in panel B. (D) The average vertical pH profile of panel B (horizontal average, ±SD) with minimum (square) and maximum pH (circle) in the calculated layer.

〔Zhu,Q., Aller,R.C. and Fan,Y.(2006): Two-dimensional pH distributions and dynamics in bioturbated marine sediments. Geochimica et Cosmochimica Acta, 70, 4933-4949.から〕


戻る