Berner,R.A.(2006): GEOCARBSULF: A
combined model for Phanerozoic atmospheric O2 and CO2. Geochimica et
Cosmochimica Acta, 70, 5653-5664.
『GEOCARBSULF:顕生代の大気中O2とCO2についての結合モデル』
『Abstract
A model for the combined long-term cycles of carbon and sulfur
has been constructed which combines all the factors modifying
weathering and degassing of the GEOCARB III model [Berner R.A.,
Kothavala Z., 2001. GEOCARB III: a revised model of atmospheric
CO2 over Phanerozoic time. Am. J. Sci.
301, 182-204] for CO2 with rapid recycling
and oxygen dependent carbon and sulfur isotope fractionation of
an isotope mass balance model for O2 [Berner
R.A., 2001. Modeling atmospheric O2 over
Phanerozoic time. Geochim. Cosmochim. Acta 65, 685-694].
New isotopic data for both carbon and sulfur are used and new
feedbacks are created by combining the models. Sensitivity analysis
is done by determining (1) the effect on weathering rates of using
rapid recycling (rapid recycling treats carbon and sulfur weathering
in terms of young rapidly weathering rocks and older more slowly
weathering rocks); (2) the effect on O2 of
using different initial starting conditions; (3) the effect on
O2 of using different data for carbon isotope
fractionation during photosynthesis and alternative values of
oceanic δ13C for the past 200 million years; (4) the
effect on sulfur isotope fractionation and on O2
of varying the size of O2 feedback during
sedimentary pyrite formation; (5) the effect on O2
of varying the dependence of organic matter and pyrite weathering
on tectonic uplift plus erosion, and the degree of exposure of
coastal lands by sea level change; (6) the effect on CO2
of adding the variability of volcanic rock weathering over time
[Berner, R.A., 2006. Inclusion of the weathering of volcanic rocks
in the GEOCARBSULF model. Am. J. Sci. 306 (in press)].
Results show a similar trend of atmospheric CO2
over the Phanerozoic to the results of GEOCARB III, but with some
differences during the early Paleozoic and, for variable volcanic
rock weathering, lower CO2 values during
the Mesozoic. Atmospheric oxygen shows a major broad late Paleozoic
peak with a maximum value of about 30% O2
in the Permian, a secondary less-broad peak centered near the
Silurian/Devonian boundary, variation between 15% and 20% O2 during the Cambrian and Ordovician, a very sharp
drop from 30% to 15% O2 at the Permo-Triassic
boundary, and a more-or less continuous rise in O2
from the late Triassic to the present.』
1. Introduction
2. GEOCARBSULF modeling
2.1. Fundamentals
2.2. Rapid recycling and O2
2.3. Initial values and O2
2.4. Carbon isotope fractionation and O2
2.5. Sulfur isotope fractionation and O2
2.6. Land area, relief, erosion and O2
2.7. Atmospheric carbon dioxide
3. discussion and conclusions
Acknowledgements
References

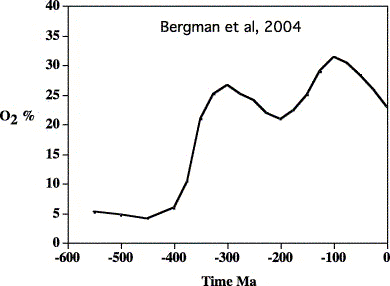
Fig. 19. Plot of O2 vs time from Bergman
et al. (2004).

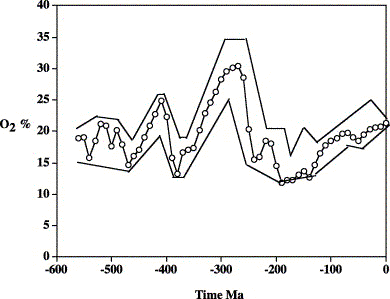
Fig. 20. Plot of O2 vs time for the
standard GEOCARBSULF model with a crude estimate of the range
of error based on sensitivity study. Triassic O2
values differ from those shown in the other plots of the present
study because of the use of alternative δ13C data
(Korte et al., 2005a and Korte et al., 2005b; see Fig. 1). This
enables O2 concentrations to be equal to
or in excess of 12%, the value believed to be the minimum to
support forest fires (Chaloner, 1989 and Wildman et al., 2004b).
〔Berner,R.A.(2006): GEOCARBSULF: A combined model for Phanerozoic
atmospheric O2 and CO2.
Geochimica et Cosmochimica Acta, 70, 5653-5664.から〕 |
- Bergman,N.M., Lenton,T.M. and Watson,A.J.(2004): COPSE:
a new model of biogeochemical cycling over Phanerozoic time.
Am. J. Sci., 304, 397-437.
- Chaloner,W.G.(1989): Fossil charcoal as an indicator of
paleoatmospheric oxygen level. J. Geol. Soc. London,
14, 171-174.
- Korte,C., Jasper,T., Kozur,H.W. and Veizer,J.(2005): δ13C
and δ18O values of Permian brachiopods: A record of
seawater evolution and continental glaciation. Palaeogeogr.
Palaeoclimatol. Palaeoecol., 224, 333-351.
- Korte,C., Kozur,H.W. and Veizer,J.(2005): δ13C
and δ18O values of Triassic brachiopods and carbonate
rocks as proxies for coeval seawater and palaeotemperature..
Palaeogeogr. Palaeoclimatol. Palaeoecol., 226,
287-306.
- Wildman,R.A., Hickey,L.J., Dickinson,M.B., Berner,R.A., Robinson,J.M.,
Dietrich,M., Essenhigh,R.H. and Wildman,C.B.(2004): Burning
of forest materials under late Paleozoic high atmospheric oxygen
levels. Geology, 32, 457-460.
戻る

