European Environment Agency (2005):
Source
apportionment of nitrogen and phosphorus inputs into the aquatic
environment. EEA Report, No.7, 48p.
『水環境へ負荷された窒素とリンの汚染源別寄与割合』
Contents
Acknowledgements
『Executive summary
Eutrophication is the excessive enrichment of waters with
nutrients and the associated adverse biological effects, and it
is still one of the major environmental problems across Europe.
European waters are affected across the whole range from inland
water bodies such as groundwater, rivers and lakes, to transitional
and coastal waters and ecosystems in open seas. Eutrophication
is caused by large anthropogenic inputs of the nutrients nitrogen
(N) and phosphorus (P) to the aquatic environment from a range
of societal sectors.
During the last 10 years, the EEA has in its state of the environment
reports and water reports presented results on the sectoral contribution
of nitrogen and phosphorus to the pollution of the aquatic environment.
The study aims at updating this information on the source apportionment
of the total load of nitrogen and phosphorus to the aquatic environment
on a large scale: country, large river basins, and sea areas.
Source apportionment is the estimation of the contribution by
different sectors to water pollution. In this study, the focus
has been on the nutrients nitrogen and phosphorus from land-based
activities to the aquatic environment, with the primary focus
on the agricultural contribution.
The overall approach has been to compile results from existing
source apportionment studies for the assessment. Source apportionment
results from the following sources have been used:
・international organisations such as transboundary river commissions
and regional marine conventions;
・national and regional studies;
・research activities.
The north-western part of Europe is generally well covered by
source apportionment studies, but there is a shortage of information
from the Mediterranean countries and some eastern European countries.
Key messages
・Run-off from agricultural land is the principal source of nitrogen
pollution. Agriculture is typically contributing 50.80 % of the
total load.
・The total area-specific load (kg N/ha per year) increases with
increasing human activities, in particular with more intensive
agricultural production in the catchments (Figure
1).
・For phosphorus, point sources such as households and industry
still tend to be the most significant source. However, as point
source discharges in many countries have been markedly reduced
during the last 15 years, agriculture has sometimes become the
main source.
・In regions with low population density and low percentage of
agricultural land such as the Baltic Sea catchment, the area-specific
phosphorus load is only one third of the load in densely populated
regions in central and north-western Europe (Figure
2).
Nitrogen load in selected countries and catchments
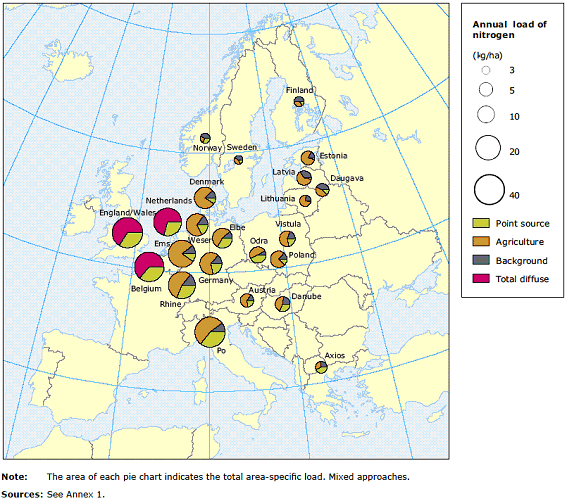
・The total area-specific load of nitrogen (kg N/ha per year),
illustrated by the area of the pie charts on Map
1, increases generally with increasing agricultural activity.
The total area-specific load in the catchments/countries in north-western
Europe is more than double (triple) than in the Nordic countries
and Baltic States.
・For all countries and catchments examined, agricultural or diffuse
losses (agriculture plus background) account for more than 60
% of the total load.
Phosphorus load in selected countries and catchments
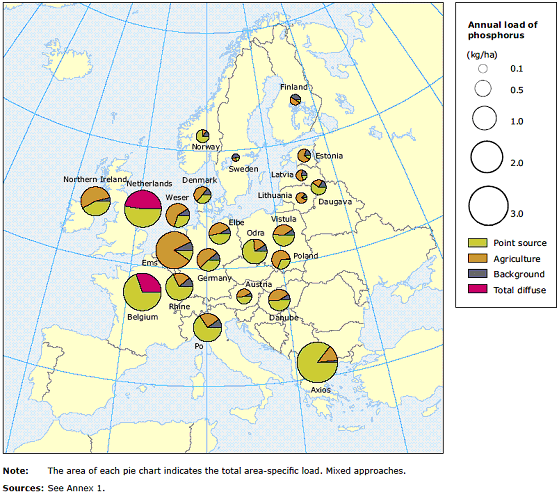
・Similar to nitrogen, the total area-specific load of phosphorus
(kg P/ha per year) is highest in countries and catchments with
high population density and high share of agricultural land (Map 2).
・In countries/catchments such as Belgium and the Odra and Po catchments
with high population density and without nutrient removal at the
majority of wastewater treatment plants, point sources generally
account for more than two thirds of the load.
Large European river catchments
・The total area-specific nitrogen load varies with a factor five
for large European river catchments. There is a high area-specific
nitrogen load in the agriculturally intensive catchments.
・There is a close relationship between the total area-specific
nitrogen load and the surplus of nitrogen applied to agricultural
catchments for large European river catchments (Figure
3).
・For most of the central European large river catchments, point
sources account for the majority of the phosphorus load (Figure
4).
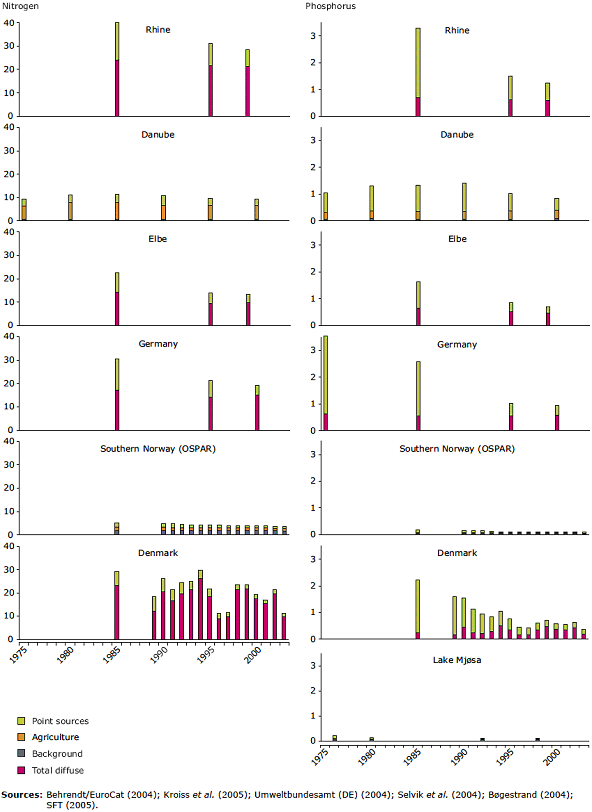
Trends during the past 30 years
・Discharges of both nitrogen and phosphorus from point sources
have decreased significantly during the past 30 years, whereas
the loss from diffuse sources has generally remained at a constant
level (Figure 5).
・The change has been largest for phosphorus, where it has also
resulted in the largest reduction in the total load due to the
previously very high share of point source discharges.
・The loss from diffuse sources has become relatively more significant
as a consequence of the reduced point source discharges.
The changes are mainly due to improved purification of urban
wastewater. In the Nordic and western European countries, purification
is now very effective and eastern European countries are now following
a similar development.
Measures to reduce the nitrogen surplus on agricultural land
are now beginning to show results in terms of a reduction in diffuse
losses of nitrogen to water. For example, in Denmark, the nitrogen
surplus was reduced by 34 % over the period 1989 to 2003 followed
by a marked decrease in the marine nitrogen load (Andersen et
al., 2004). However, due to a combination of processes affecting
the nitrogen cycle in soil and water, the reduction in diffuse
loading of the aquatic environment can be delayed by many years
after measures have been implemented on land.
Outlook
This study is the first step in a wider framework action dealing
with the assessment of nutrient inputs from agriculture and other
sources into water bodies of inland waters as well as transitional,
coastal and marine waters and is seen in the context of ongoing
EEA work on agriculture and environment.
In order to assess the effectiveness of current policies and
agreements and to identify gaps, it is essential to know how nutrient
inputs are distributed across sectors. Results from source apportionment
studies are therefore important in the policy formulation process
and in monitoring the implementation of policies and the effectiveness
of measures.
To help achieve this, a European-wide source apportionment of
nutrient loads could be carried out applying an appropriate source
apportionment tool at regular intervals (e.g. every three to five
years) for a representative part or for the entire network of
stations within the Eionet-water network. This will establish
time series of source apportionment for all the different regions
across Europe.
In the short term, the EEA aims at a spatially differentiated
assessment of the agricultural share of the total nutrient input
into the aquatic environment. Furthermore, the spatially differentiated
assessment will address the relationship between agricultural
activities in the catchments and resulting water quality of the
rivers draining the catchments. Building upon this, the EEA intends
to investigate the possible use of medium-scale models for European
assessments, conceivably linked to more detailed modelling approaches
in hot-spot areas.』
1 Introduction
2 Concept of source apportionment
2.1 Eutrophication and sources of nitrogen (N) and phosphorus
(P)
2.2 Sources covered
2.3 Different methods used in source apportionment studies
2.4 Presentation of source apportionments
3 Information sources
3.1 Load compilation and source apportionment studies for
Europe's seas
3.2 Source apportionments at national level
3.3 Source apportionments for river catchments
4 European source apportionments
4.1 Coastal and marine areas
4.1.1 Nitrogen
4.1.2 Phosphorus
4.1.3 Regional differences in load and source apportionment
to the two sea areas
4.2 Countries
4.3 Large river catchments
4.4 Smaller catchments
4.5 Large lake catchments
5 Sources of pollution
5.1 Background loss
5.2 Agricultural diffuse loss
5.3 Atmospheric deposition
5.4 Rural population
5.5 Point sources
6 Geographical differences
7 Temporal changes
8 What additional work on source apportionment is needed?
9 References
Annex 1 Data table for Maps 1, 2, 6.1 and 6.2
Annex 2 Bibliography on source apportionment (and load) for European
seas
Annex 3 Bibliography on national source apportionment
Annex 4 Bibliography on European river
catchment source apportionment studies
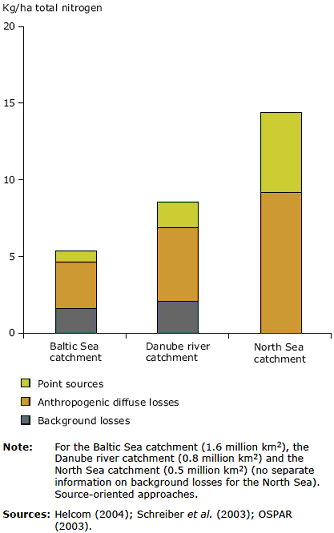
Figure 1 Source apportionment of annual nitrogen load
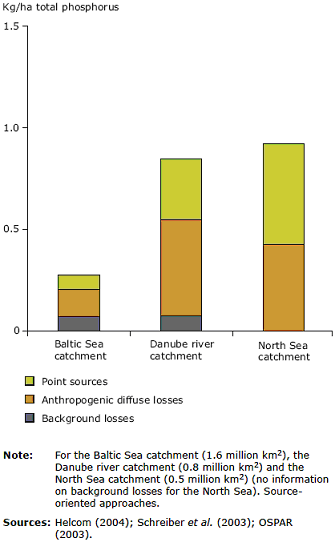
Figure 2 Source apportionment of annual phosphorus load
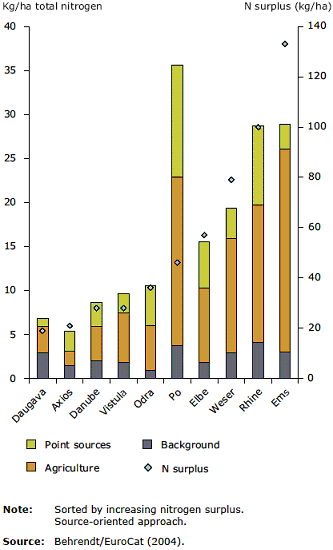
Figure 3 Total area-specific nitrogen load (before retention)
by sources and nitrogen surplus in large river catchments using
the Moneris model
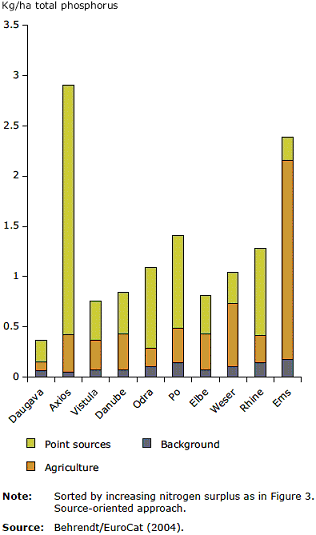
Figure 4 Total area-specific phosphorus load (before retention)
by sources in large river catchments using the Moneris model
〔European Environment Agency (2005): Source
apportionment of nitrogen and phosphorus inputs into the aquatic
environment. EEA Report, No.7, 48p.から〕 |
Annex 4 Bibliography
on European river catchment source apportionment studies
- ANPA. Stato dell'Ambiente, 3/2001. Primo rapporto
SINAnet sulle Acque.
- Behrendt/EuroCat (2004). 'Past, present and future changes
in catchment fluxes'. Deliverable 4.4 of the EuroCat project.
- Behrendt, H., Bach, M., Kunkel, R., Opitz, D., Pagenkopf,
W.-G., Scholz, G. and Wendland, F. (2003). Nutrient emissions
into surface waters of Germany on the base of a harmonised procedure.
Report to the Federal Environment Agency.
Available at http://osiris.uba.de/gisudienste/Herata/npbilanz/under
'Publications' and http://osiris.uba.de/gisudienste/Herata/npbilanz/bericht/english/summary.pdf.
- Behrendt, H., Dannowski, R., Deumlich, D., Dolezal, F., Kajewski,
I., Kornmilch, M., Korol, R., Mioduszewski, W., Opitz, D., Steidl,
J. and Stronska, M. (2002). 'Nutrient and heavy metal emissions
into the river system of Odra - Results and comparison of models'/'Narstoff(aの頭に¨) und Schwermetalleintrage(後のaの頭に¨)
in das Flusssystem der Oder'. In IGB- Leibniz, Institute of
Freshwater Ecology and Inland Fisheries annual report 2001.
http://www.igb-berlin.de/institut/deutsch/2001/Research/nutrient_heavymetal_emissions.pdf.
- Bernet. Baltic eutrophication regional network. http://www.bernet.org/wm125051.
- Brandt, M. and Ejhed, H. (2002). Transport - Retention
- Kallfordelning(aのoの頭に¨) Belastning pa(aの頭に゜) havet. Report from Naturvardsverket
No 5247 (in Swedish).
Del 1: http://www.naturvardsverket.se/bokhandeln/pdf/620-5247s1_44.pdf
- pp. 1-44.
Del 2: http://www.naturvardsverket.se/bokhandeln/pdf/620-5247s45_117.pdf
- pp. 45-177.
- Boestrand(oには/が付く), J. (ed.) (1999).
Vandlob(oには/が付く) og kilder 1998.
NOVA 2003. Technical report from NERI No 292.
- Boestrand(oには/が付く), J. (ed.) (2004).
Vandlob(oには/が付く) 2003.
NOVA 2003. Technical report from NERI No 516.
http://www2.dmu.dk/1_Viden/2_Publikationer/3_Fagrapporter/rapporter/FR516.pdf.
- De Wit, M., van Gaans, P., Bleuten, W., Bendoricchio, G.
and Behrendt, H. (2001). 'The contribution of agriculture
to nutrient pollution in three European rivers'. European
Water Management, 2/2002 (published online). http://www.ewaonline.de/journal/2002_02.pdf.
- Euroharp. 'Towards European harmonised procedures for
quantification of nutrient losses from diffuse sources'.
EU fifth framework programme research project.
Information available at http://EUROHARP.org/.
- Finlands miljocentral(oの頭に¨) (2005).
'Naringsbelastning(最初のaの頭に¨) pa(aの頭に゜) vattendrag och naturlig urlakning'.
http://www.miljo.fi/default.asp?contentid=118735&lan=SV.
- IKSR (1996). Bestandsaufnahme der Phosphor- und Stickstoffeintrage(aの頭に¨) 1996.
- Kowalkowski, T. and Buszewski, V. (2004). 'Modelling of
past, present and future state of nutrient emission into the
Vistula river system. Implementation of Moneris model to the
Vistula river catchment'. Deliverable WP4 of the EuroCat
project.
- Nashoug (ed.) (1999). Vannkvaliteten i Mjosa(oには/が付く)
- for(oには/が付く) og na(aの頭に゜)
Mjosovervakingen(最初のoの/が付く、aの頭に゜) gjennom
25 ar(aの頭に゜). Report from Styringsgruppa
for overvaking(aの頭に゜) av Mjosa(oに/が付く).
http://www.fylkesmannen.no/fmt_liste_kort.asp?tgid=5374&gid=5383&amid=1003083&g5375=x&g5374=x&.
- Nikolaidis, N. P., Karageorgis, A., Kapsimalis, V., Drakopoulou,
P., Skoulikidis, N. and Behrendt, H. (2004). 'Modelling of
Axios river basin'. Deliverable WP4 of the EuroCat project.
- OSPAR (2000). Quality Status Report 2000. OSPAR
Commission, London. http://www.ospar.org/eng/html/qsr2000/QSR2000welcome3.htm.
- Palmeri, L., Bendoricchio, G. and Artioli, Y. (2005). 'Modelling
nutrient emissions from river systems and loads to the coastal
zone: Po river case study, Italy'. Ecological Modelling,
184, 2005, pp. 37-53.
- Schreiber et al. (2003). 'Harmonised inventory of point
and diffuse emissions of N and P for the Danube river basin'.
Delivery 5.5 of the Danubs project.
http://128.130.103.159/D5.5
web version.pdf.
- Selvik, J. R., Borgvang, S. A., Eggestad, H. O. and Tjomsland,
T. (2004). Tilforsler(oには/が付く) av
naeringssalter(aeは繋がった1文字) til Norges kystomrader(aの頭に゜) 2003, beregnet med tilforselsmodellen
TEOTIL. Report from NIVA to Statens forurensningstilsyn
(SFT).
http://www.sft.no/publikasjoner/overvaking/2059/ta2059.pdf.
- Somlyody(後のoの頭に´), L., Brunner, P. H.,
Fenz, R., Kroiβ, H., Lampert, C. and Zessner, M. (1997). 'Nutrient
balances for Danube countries'. Project EU/AR/102A/91. Danube
applied research programme, Phare, Vienna.
- Tonderski, A. (1997). 'Control of nutrient fluxes in large
river basins'. Linkoping(oの頭に¨)
Studies in Arts and Science, No 157. Abstract.
http://www.bibl.liu.se/liupubl/disp/disp97/arts157s.htm.
- Umweltbundesamt (DE) (2004). 'Nahrstoffeintrage(両方のaの頭に¨) in die Fluβgebiete Deutschlands'.
http://osiris.uba.de/gisudienste/Herata/npbilanz/.
- UNDP/GEF (1999). Danube pollution reduction programme.
Transboundary Analysis Report.
Available at the ICPDR home page: http://www.icpdr.org/pls/danubis/danubis_db.dyn_navigator.show.
- van Dijk, S., Knoop, J., De Wit M. J. M. and Leewis, R. J.
(1997). Source apportionment and quantification of nitrogen
transport, and retention, in the River Rhine. RIVM report
733008004. http://www.rivm.nl/bibliotheek/rapporten/733008004.html.
- Vassiljev, A. and Stalnacke, P. (2003). 'Statistical modelling
of riverine nutrient sources and retention in the Lake Peipsi
drainage basin'. Paper presented at the Diffuse Pollution
Conference, Dublin, 2003. http://www.ucd.ie/dipcon/docs/theme10/theme10_09.PDF.
戻る


