International Energy Agency (2005):
30
Key Energy Trends - in the IEA & Worldwide. 30th
Anniversary of the International Energy Agency, 35p.
üw30é╠ÅdŚvé╚āGālāŗāMü[īXī³ü|IEAé©éµéčÉóŖEé┼üx
üwSince the creation of the International Energy Agency thirty
years ago, the world energy scene has changed significantly. Energy
production is more diverse by type and geographically, demand
growth is shifting outside the IEA countries, technology has made
tremendous progress and environmental concerns have emerged as
a driver for energy policies.
For the Agency's 25th Anniversary, we produced 25 graphs and tables
to capture the high points of a quarter century of change - first
at world level, then among our Member countries.The brochure was
well received. On the occasion of the IEA's 30th Anniversary we
have produced a similar brochure, adding five new graphs for our
thirty years.
As this rapid survey shows, our Members' energy policies have
been guided by the concepts laid down in the International Energy
Program of 1974, the 1977 IEA Principles for Energy Policy and
the 1993 Shared Goals. They have evolved with the challenges to
promote the IEA's "Three E's" of energy security, economic
growth and environmental protection.
But new factors bring new challenges. The need to ensure adequate
financing of energy investment in liberalised markets, the dramatic
emergence of new large consumers outside of the OECD and the recognition
of a shameful degree of energy poverty for more than a quarter
of the world's population, add new concerns for policymakers.
To understand and respond effectively, OECD countries need accurate
and timely data, detailed analysis, and exchanges of expertise
- all of which are core activities of the IEA. With these tools
and close cooperation with Member countries, the IEA is well-positioned
to face
these new and evolving challenges.
Looking forward, we believe the IEA will continue to play an important
role advising its Members on global energy policy.We will count
ourselves fortunate if we can achieve as much in the next thirty
years as was achieved in the first.
Claude Mandil
Executive Directorüx
WORLD
1. World Energy Supply
2. Regional Energy Supply
3. Regional Oil Production
4. Regional Gas Production
5. Regional Coal Production
6. Annual Growth of Renewables Supply
7. World Electricity Generation
8. Final Consumption by Sector
9. Selected World Energy Indicators
10. Regional CO2 Emissions
11. Crude Oil Prices
12. Energy and Poverty
IEA
13. IEA Energy Supply
14. IEA Electricity Generation
15. IEA Oil Net Imports by Origin
16. Strategic Stocks of IEA Importing Countries
17. A Sectoral View of IEA Energy Demand
18. Final Energy Demand and Savings
19. Selected IEA Energy Indicators
20. Energy Intensity Effects by End-Use Sector
21. Selected Fuel Price Indices
22. IEA Government Budgets for Energy R&D
OUTLOOK
23. Increase in World Energy Production and Consumption
24. World Primary Energy Demand Outlook
25. Regional Primary Energy Demand Outlook
26. Global Oil Import Dependency
27. CO2 Emissions Outlook
28. Investment Needs in the Energy Sector
INDICATORS
29. Regional Indicators
30. OECD Country Indicators
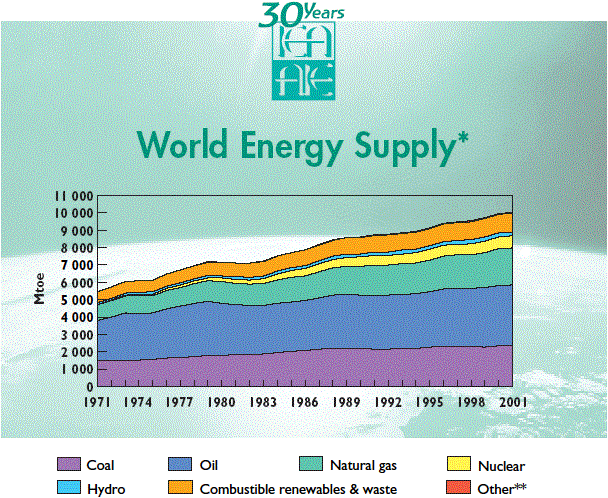
- Over the 30-year period of 1971 to 2001, the world's total
primary energy supply increased by 84%, reaching just over 10
000 Mtoe (million tonnes of oil equivalent). This equates to
a compound growth rate of about 2.1% per annum. By comparison,
world population grew by 1.6% and Gross Domestic Product by 3%
over the same period.
- Energy supply growth was fairly constant over the period,
except in 1974-1975 and in the early 1980s as a consequence of
the first two oil shocks, and in the early 1990s following the
dissolution of the Soviet Union.
- In 1973, oil was by far the largest component in total primary
energy supply, with
45.1%. This share has fallen to only 35% in 2001.
- The share of coal dropped slightly, from around 25% to just
over 23% in 2001. The share of combustible renewables and waste
- mainly wood and charcoal, often referred to as traditional
biomass, used for cooking in developing countries - has remained
stable over the past 30 years, at around 11%.
- Natural gas and nuclear have experienced a significant increase
from 16.2% and
0.9% respectively in 1973 to 21.2% and 6.9% in 2001.
* Total Primary Energy Supply (TPES). Excludes
international marine bunkers and electricity trade.
** Other includes geothermal, solar, wind and heat, etc.
Sources: Energy Balances of OECD Countries; Energy Statistics
and Balances of Non-OECD Countries.
ükInternational Energy Agency (2005): 30
Key Energy Trends - in the IEA & Worldwide. 30th
Anniversary of the International Energy Agency, 35p.é®éńül |
¢▀éķ