Energy Information Administration (2006):
International
Energy Outlook 2006. U.S. Department of Energy, 192p.
üwŹæŹ█āGālāŗāMü[ōW¢] 2006üx
Contents
Prefaceü@
üwHighlightsü@
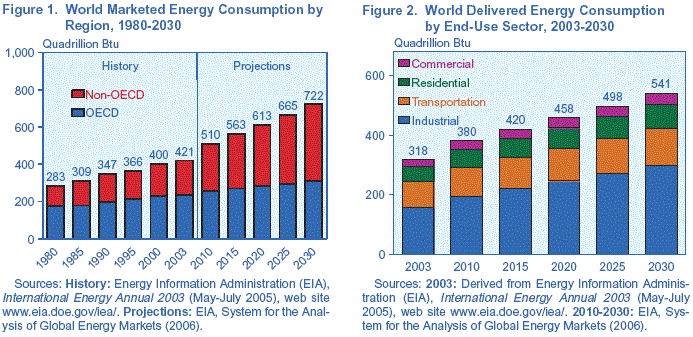
ü@World energy consumption is projected to increase by 71 percent
from 2003 to 2030. Fossil fuels continue to supply much of the
energy used worldwide, and oil remains the dominant energy source.
ü@In the International Energy Outlook 2006 (IEO2006) reference
case, world marketed energy consumption increases on average by
2.0 percent per year from 2003 to 2030. Although world oil prices
in the reference case, which remain between $47 and $59 per barrel
(in real 2004 dollars), dampen the growth in demand for oil, total
world energy use continues to increase as a result of robust economic
growth. Worldwide, total energy use grows from 421 quadrillion
British thermal units (Btu) in 2003 to 563 quadrillion Btu in
2015 and 722 quadrillion Btu in 2030 (Figure 1).
ü@The most rapid growth in energy demand from 2003 to 2030 is projected
for nations outside the Organization for Economic Cooperation
and Development (non-OECD nations). Energy demand growth averages
3.7 percent per year for non-OECD Asia (which includes China and
India), 2.8 percent per year for Central and South America, 2.6
percent per year for Africa, 2.4 percent per year for the Middle
East, and 1.8 percent per year for non-OECD Europe and Eurasia.
The increases result from projections of strong regional economic
growth. For all the non-OECD regions combined, economic activity-as
measured by gross domestic product (GDP) in purchasing power parity
terms-expands by 5.0 percent per
year on average, as compared with an average of 2.6 percent per
year for the OECD economies.
 |
ü@The OECD nations, for the most part, are more mature energy consumers
with well-established infrastructures, and their economies generally
are moving away from energy-intensive industries toward services.
Consequently, total OECD energy demand increases by an average
of 1.0 percent per year over the projection period, as compared
with an average increase of 3.0 percent per year for total non-OECD
energy demand.
ü@Trends in end-use sector energy consumption can vary widely,
according to the level and pace of economic development in a given
region. On a worldwide basis, energy demand in the industrial
sector grows most rapidly, at an average rate of 2.4 percent per
year (Figure 2). Slower growth is projected for the buildings
sectors: residential energy use rises by an average of 1.7 percent
per year and commercial energy use by 1.8 percent per year from
2003 to 2030 for the world as a whole. The slowest growth in energy
demand among the end-use sectors is projected for transportation,
at 1.4 percent per year.
In contrast, the International Energy Outlook 2005 (IEO-2005)
reference case showed transportation energy use growing at the
same rate as industrial energy use and faster than energy use
in the buildings sectors. The higher world oil prices in IEO2006
are largely responsible for the slower growth in transportation
sector energydemand, in that oil dominates transportation energy
use, and there are currently no fuels that compete widely with
oil in the transportation sector.
ü@In the OECD, where population growth generally is slow or negative
in many countries over the projection period, the slowest growth
in energy use is projected for the residential sector, at 0.6
percent per year; and the fastest growth is in the industrial
sector, averaging 1.2 percent annually. For the non-OECD regions
as a whole, strong growth in demand for energy is projected for
every end-use sector, ranging from 2.3 percent per year in the
transportation sector to 3.2 percent per year in the commercial
and industrial sectors.
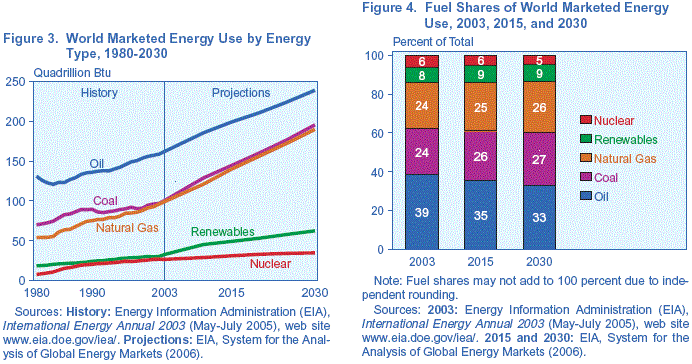
ü@In the IEO2006 reference case, the use of all energy sources
increases through 2030 (Figure 3). Fossil fuels (oil, natural
gas, and coal) continue to supply much of the energy used worldwide.
Oil remains the dominant energy source, given its importance in
the transportation and industrial end-use sectors; however, higher
world oil prices in this yearüfs outlook mean that oil's share
of the world energy market is lessened in the projection as other
fuels replace oil where possible.
In IEO2005, in contrast, the oil share of total energy
demand was relatively stable from 2002 to 2025. Renewable energy
sources become more economically competitive with fossil fuels
in the reference case, and renewable energy use expands as rapidly
as consumption of natural gas and coal. Higher fossil fuel prices
also support renewed interest in expanding the use of nuclear
power to generate electricity.
ü@World oil use grows from 80 million barrels per day in 2003 to
98 million barrels per day in 2015 and 118 millionbarrels per
day in 2030 in the reference case. The IEO2006 projection
for oil demand in 2025 is 8 million barrels per day lower than
the 119 million barrels per day projected in IEO2005, which
extended only to 2025. The slower growth in this year's projections
is in large part explained by the substantially higher world oil
prices in the IEO2006 reference case. Indeed, world oil
prices in 2025-expressed as the average price of imported low-sulfur,
light crude oil to U.S. refiners (see box on page 3)-are 35 percent
higher than in IEO2005. In the IEO2006 reference
case, world oil prices rise from $31 per barrel (in real 2004
dollars) in 2003 to $57 per barrel in 2030, and oil's share of
total world energy use falls from 39 percent to 33 percent (Figure
4).ü@To meet the projected increase in world oil demand in
the reference case, total petroleum supply in 2030 will need to
be 38 million barrels per day higher than the 2003 level of 80
million barrels per day. OPEC producers are expected to provide
14.6 million barrels per day of the increase. Higher oil prices
cause a substantial increase in non-OPEC oil production-23.7 million
barrels per day, which represents 62 percent of the increase in
total world oil supplies over the projection period. In
addition, unconventional resources (including biofuels, coal-to-liquids,
and gas-to-liquids) are expected to become more competitive. In
2003, world production of unconventional resources totaled only
1.8 million barrels per day; in the IEO2006 reference case,
unconventional resource supplies rise to 11.5 million barrels
per day and account for nearly 10 percent of total world petroleum
supply in 2030.
ü@The higher oil prices in this yearüfs reference case raise the
projected demand for, and price of, natural gas. Natural
gas consumption increases on average by 2.4 percent per year from
2003 to 2030. The higher natural gas prices also make coal more
cost-competitive, especially in the electric power sector. As
a result, for the first time since the Energy Information Administration
(EIA) began publishing outlooks for worldwide energy use in 1990,
demand for coal grows faster than demand for natural gas in the
IEO2006 projections, albeit only slightly faster, at 2.5
percent per year. Among the end-use sectors, the industrial sector
remains the largest consumer of natural gas worldwide, accounting
for 52 percent of
the total increase in demand for natural gas between 2003 and
2030. Natural gas also is expected to remain an important energy
source in the electric power sector, particularly for new generating
capacity.
World Oil Prices in IEO2006
In previous IEOs, the world crude oil price was defined on the
basis of the average imported refiner acquisition cost of crude
oil to the United States (IRAC), which represented the weighted
average of all imported crude oil. Historically, the IRAC price
has tended to be a few dollars less than the widely cited prices
of premium crudes, such as West Texas
Intermediate (WTI) and Brent, which refiners generally prefer
for their low viscosity and sulfur content. In the past 2 years,
the price difference between premium crudes and IRAC has widened-in
particular, the price spread between premium crudes and heavier,
high-sulfur crudes. In an effort to provide a crude oil price
that is more consistent with those generally reported in the
media, IEO2006 uses the average price of imported low-sulfur,
light crude oil to
U.S. refiners. |
ü@World coal consumption is projected to increase from
5,440 million short tons in 2003 to 7,792 million short tons in
2015, at an average annual rate of 3.0 percent. The rate of growth
in world coal use slows after 2015 to 2.0 percent annually through
2030, when coal consumption totals 10,561 million short tons.
Of the coal produced worldwide in 2003, 67 percent was shipped
to electricity producers and 30 percent to industrial consumers,
the two end-use sectors that account for virtually all the growth
in coal use in the mid-term. On a worldwide basis coal's share
of industrial sector energy use
increases, mostly because of the substantial growth projected
for coal consumption in China's industrial sector. In the IEO2006
reference case, industrial energy use in China more than triples
from 2003 to 2030 as a result of the country's abundant coal reserves,
its limited reserves of oil and natural gas, and its leading position
in world steel production.
ü@World net electricity consumption more than doubles in the reference
case, from 14,781 billion kilowatthours in 2003 to 21,699 billion
kilowatthours in 2015 and 30,116 billion kilowatthours in 2030.
Most of the growth in electricity demand occurs in the non-OECD
nations, where electricity use increases on average by 3.9 percent
per year from 2003 to 2030, as compared with 1.5 percent per year
in theOECDnations. Worldwide, increases are projected for all
primary energy sources in electricity generation (Figure 5). Coal
and natural gas remain the most important fuels for electricity
generation throughout the projection period, however, accounting
for more than two-thirds of the total increment in energy use
for electricity production in the reference case.
ü@Consumption of electricity generated from nuclear power worldwide
increases from 2,523 billion kilowatthours in 2003 to 3,299 billion
kilowatthours in 2030 in the IEO2006 reference case. Higher fossil
fuel prices and concerns about security of energy supplies are
expected to improve prospects for nuclear power capacity over
the projection period, and many countries are expected to build
new nuclear power plants. World nuclear capacity rises from 361
gigawatts in 2003 to 438 gigawatts in 2030, with significant declines
in capacity projected only for Europe, where several countries
have either plans or mandates to phase out nuclear power, or where
old reactors are expected to be retired and not replaced.
ü@Non-OECD Asia accounts for 69 percent of the increase in non-OECD
nuclear capacity in the reference case and
leads the growth in nuclear power generation with an average increase
of 6.3 percent per year from 2003 to 2030. The 51 gigawatts of
additional installed nuclear generating capacity projected for
non-OECD Asia includes 33 gigawatts in China and 12 gigawatts
in India. Russia accounts for most of the remaining non-OECD additions,
adding 22 gigawatts of nuclear capacity over the 2003 to 2030
period.
ü@Rising fossil fuel prices also allow renewable energy sources
to compete economically in the electric power sector. Consumption
of hydroelectricity and other gridconnected renewable energy sources
expands by 2.4 percent per year-approximately the same as the
rates of growth projected for natural gas and coal-and the renewable
energy share of the world's total energy consumption increases
from 8 percent in 2003 to 9 percent in 2030.
ü@Much of the projected growth in renewable electricity generation
results from the expected completion of large hydroelectric facilities
in non-OECD nations, especially in non-OECD Asia, where the need
to expand electricity production with associated dams and reservoirs
often outweighs concerns about environmental impacts and the relocation
of populations. China, India, and Laos, among other non-OECD Asian
economies, already are constructing or planning new large-scale
hydroelectric facilities.
ü@Apart from Turkey, where development of the 7.5-gigawatt Southeast
Anatolia hydroelectric system is ongoing, most hydroelectric resources
in the OECD nations already have been developed or lie far from
population centers. As a result, nonhydroelectric marketed renewables,
such as wind, solar, geothermal, and biomass, are expected to
account for most of the growth in OECD renewable energy use, given
government programs and policies to encourage their expansion.
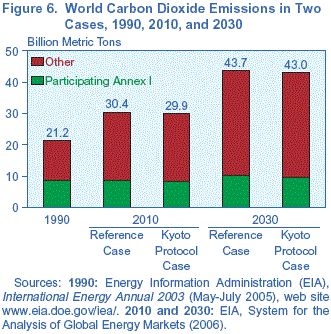
ü@World carbon dioxide emissions continue to increase steadily
in the IEO2006 reference case, from 25.0 billion metric
tons in 2003 to 33.7 billion metric tons in 2015 and 43.7 billion
metric tons in 2030. Carbon dioxide is one of the most prevalent
greenhouse gases in the atmosphere, and anthropogenic (human-caused)
emissions of carbon dioxide result primarily from the combustion
of fossil fuels for energy. Three-fourths of the projected increase
in carbon dioxide emissions results from fossil fuel consumption
in non-OECD countries.
ü@The Kyoto Protocol, which requires participating "Annex
I" countries1 to reduce their carbon dioxide emissions
collectively to an annual average of about 5 percent below their
1990 level over the 2008-2012 period, became a legally binding
treaty on February 16, 2006, 90 days after it was ratified by
Russia. The IEO2006 reference case does not include the
potential impacts of the Kyoto Protocol, because the treaty does
not indicate the methods by which ratifying parties will implement
their obligations either in the first commitment period or after
2012. To examine the implications of the treaty for energy use
and carbon dioxide emissions, a Kyoto Protocol case was analyzed.
ü@A number of assumptions were made in developing the IEO2006
Kyoto Protocol case. First, it was assumed that energy use would
not vary from the reference case projection for countries that
are not undertaking emissions reduction commitments. In addition,
assumptions were made about how the affected participating regions
would achieve their reductions. In OECD Europe, stated intentions
that ügmostüh of the emissions reductions will be achieved domestically
led to an assumption that 50 percent of the aggregate emissions
reduction for OECD Europe would be met by domestic reductions.
With no stated intentions about levels of domestic reductions
in Japan or in Canada, an assumption was made that a 25-percent
share of total reductions in both countries would be met domestically.
Finally, it was assumed that
the emissions commitments would remain in effect attheir 2008-2012
level through 2030.
ü@In the Kyoto Protocol case (Figure 6), energy-related carbon
dioxide emissions in the participating nations are 673 million
metric tons lower than in the reference case in 2030. In those
countries required to make reductions in the Kyoto Protocol case
(Canada, Japan, and OECD Europe), emissions decline from 6.1 billion
metric tons in 2003 to 5.9 billion metric tons in 2010. After
2010, however, their emissions begin to rise again-to 6.5 billion
metric tons in 2030-when participants find it less expensive to
purchase permits than to make domestic reductions.
ü@Continued heavy reliance on coal and other fossil fuels in many
parts of the world suggests that even if nations that have ratified
the Kyoto Protocol reduce their carbon dioxide emissions as required
in the treaty, there still will be substantial increases in carbon
dioxide emissions worldwide. In the IEO2006 Kyoto Protocol
case, worldwide carbon dioxide emissions rise to 29.9 billion
metric tons in 2010 and 43.0 million metric tons in 2030.
1Austria, Belgium, Bulgaria, Canada,
Croatia, Czech Republic, Denmark, Estonia, Finland, France, Germany,
Greece, Hungary, Iceland, Ireland, Italy, Japan, Latvia, Lithuania,
Luxembourg, Monaco, the Netherlands, New Zealand, Norway, Poland,
Portugal, Romania, Russia, Slovakia, Slovenia, Spain, Sweden,
Switzerland, Ukraine, and the United Kingdom. Australia, Belarus,
Turkey, and the United States are Annex I nations that will not
participate in the Protocol.üx
1.
World Energy and Economic Outlookü@
ü@Outlook for World Energy Consumptionü@
ü@World Economic Outlookü@
ü@Alternative Growth Casesü@
ü@Trends in Energy Intensityü@
2.
Energy Consumption by End-Use Sectorü@
ü@Residential Sectorü@
ü@Commercial Sectorü@
ü@Industrial Sectorü@
ü@Transportation Sectorü@
ü@References
3. World
Oil Markets
ü@World Oil Demand
ü@Oil Reserves and Resources
ü@The Composition of World Oil Supply
ü@World Oil Prices
ü@Worldwide Petroleum Trade
ü@References
4.
Natural Gas
ü@Reserves and Resources
ü@World Natural Gas Supplyü@ü@
ü@World Natural Gas Demandü@
ü@Referencesü@
5. World
Coal Marketsü@
ü@Reservesü@
ü@Regional Demand Forecastsü@
ü@Trade ü@
ü@Referencesü@
6.
Electricityü@
ü@Net Electricity Consumptionü@
ü@Electricity Supplyü@
ü@References ü@
7.
Energy-Related Carbon Dioxide Emissionsü@
ü@Reference Caseü@
ü@Kyoto Protocol Caseü@
ü@References ü@
Appendixes
ü@A. Reference Case Projections
ü@B. High Economic Growth Case Projections
ü@C. Low Economic Growth Case Projections
ü@D. Reference Case Projections by End-Use Sector and Region
ü@E. Projections of Oil Production Capacity and Oil Production
in Three Cases
ü@F. Reference Case Projections for Electricity Capacity and Generation
by Fuel
ü@G. Key
Assumptions for the IEO2006 Kyoto Protocol Case
ü@H. Comparisons
With Other Forecasts, and Performance of Past IEO Forecasts for
1990, 1995, and 2000
ü@I. System
for the Analysis of Global Energy Markets (SAGE)
ü@J. Regional
Definitions
¢▀éķ