
wIntroduction
@This appendix compares the WETO Reference hypotheses and results
with the projections provided by other world energy studies. Three
institutions carry out forecasts whose scope is comparable to
WETO:
The four studies compared here use database and conversion factors that may slightly differ from one model to the other. In order to reduce the resulting discrepancies and to improve the comparability of results, all data have been harmonised while applying the growth rates derived from each study to the initial 2000 values of the WETO study. This allows having a clearer view and a better understanding of the common outcomes and divergences between the studies.x
1. World population
2. World GDP
3. World oil price
4. World energy consumption
5. World CO2 emission
6. World coal demand
7. World oil demand
8. World gas demand
9. World nuclear electricity production
10. World hydro-electricity production
11. World biomass production
12. World other renewable production
w4. World energy
consumption
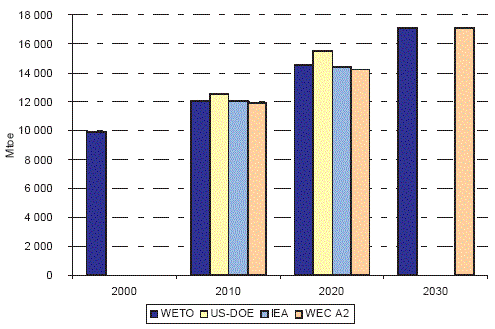
World total energy consumption levels, as they stem from the harmonisation
process used here, show similar levels for the time-period considered,
with a typical 12 Gtoe in 2010 and 14.5 in 2020 (only one study
displays a significantly higher value, i.e. 15.5 Gtoe for that
date) and 17 Gtoe in 2030. However, this proximity in total energy
forecasts hides more important differences in the projections
for individual energy sources, as analysed below.
  |
w7. World oil
demand
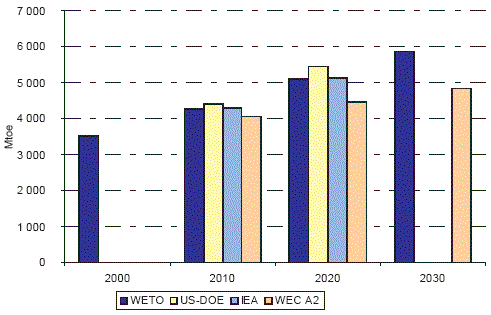
World oil demand exceeds 4 Gtoe in 2010 in the four studies, and
5 Gtoe in 2020 in three of them. The corresponding growth rates
are however at a relatively low level, between 1.5 and 2 %/year.
The DOE forecast shows the highest level of world oil demand in
2020 and this is consistent, on the demand side, with the fact
that this study also has the lowest oil price for that horizon
(23 $/bl).
  |