Bentley,R.W.(2002): Global oil &
gas depletion: an overview. Energy Policy, 30,
189-205.
『世界の石油・ガス枯渇:レビュー』
『Abstract
The world's production of conventional hydrocarbons will
soon decline. Hydrocarbon shortages are inevitable unless radical
changes occur in demand, or in the supply of non-conventional
hydrocarbons. The details are as follows:
Global conventional oil supply is currently at political
risk. This is because the sum of conventional oil production from
all countries in the world, except the five main Middle-East suppliers,
is near the maximum set by physical resource limits. Should Middle-East
suppliers decide to substantially curtail supply, the shortfall
cannot be replaced by conventional oil from other sources.
World conventional oil supply will soon be at physical
risk. The Middle-East countries have only little spare operational
capacity, and this will be increasingly called upon as oil production
declines elsewhere. Large investments in Middle-East production,
if they occur, could raise output, but only to a limited extent.
(A partial exception is Iraq, but even here, there would be significant
delays before prospects are confirmed, and infrastructure is in
place.) If demand is maintained, and if large investments in Middle-East
capacity are not made, the world will face the prospect of oil
shortages in the near term.
Even with large investments, resource limits will force
Middle-East production to decline fairly soon, and hence also
global conventional oil production. The date of this resource-limited
global peak depends on the size of Middle-East reserves, which
are poorly known, and unreliably reported. Best estimates put
the physical peak of global conventional oil production between
5 and 10 years from now.
The world contains large quantities of non-conventional oil,
and various oil substitutes. But the rapidity of the decline in
the production of conventional oil makes it probable that these
non-conventional sources cannot come on-stream fast enough to
fully compensate. The result will be a sustained global oil shortage.
For conventional gas, the world's original endowment is probably
about the same, in energy terms, as its endowment of conventional
oil. Since less gas has been used so far compared to oil, the
world will turn increasingly to gas as oil declines. But the global
peak in conventional gas production is already in sight, in perhaps
20 years, and hence the global peak of all hydrocarbons (oil plus
gas) is likely to be in about 10 or so years.』
『要旨
在来型炭化水素の世界生産量はまもなく低下するだろう。炭化水素不足は、非在来型炭化水素の需要あるいは供給に根本的な変化がない限り、避けられない。詳細は以下のとおり:
世界の在来型石油供給は現在、政治的 リスクをもつ。これは、中東の5大供給国を除いて、世界のすべての国からの在来型石油生産量の合計が、物理的な資源限界によって定められた最大量に近いためである。中東供給国が実質的に供給を抑えるよう決めると、その不足分は他の供給国からの在来型石油では取って代われない。
世界の在来型石油供給はまもなく物理的 リスクをもつだろう。中東諸国は操業能力にごくわずかの予備があるだけで、他の場所の石油生産が低下するとともに、ますます求められるだろう。中東での生産に大きな投資がもしあるならば、限られた範囲のみだが、生産高を上げられるだろう。(一部の例外はイラクだが、しかしたとえここでも、有望地が確認され、インフラが整うまえに、かなりの遅れが生じるだろう。) 需要が維持され、かつ中東の能力に大きな投資がなされないならば、世界は近い時期に石油不足の可能性に直面するだろう。
大きな投資がなされても、資源の限界 は中東の生産そしてそれゆえに世界の在来型石油生産をも、かなりはやく低下させることになるだろう。この資源の限界による世界のピークの時期は、中東の埋蔵量の大きさによっており、それはよく知られておらず、報告もあてにならない。最良の見積りからは、世界の在来型石油生産の物理的ピークは、今から5~10年の間となる。
世界には大量の非在来型石油とさまざまな石油代用物がある。しかし在来型石油生産の急速な低下は、これらの非在来型資源が十分に埋め合わせできるように早く開発されることを不可能にする。その結果は世界の石油不足を持続させるであろう。
在来型天然ガスについて、世界の原始資源は、エネルギー利用期間においては在来型石油とたぶん同じである。天然ガスは石油に比べるとそれほど多くは利用されてこなかったので、石油が低下するにつれ世界的に天然ガスの利用が増加するだろう。しかし世界の在来型天然ガス生産のピークはすでに間近、おそらく20年であり、したがってすべての炭化水素(石油と天然ガス)の世界的なピークは、おそらく10年かそこらであろう。』
Introduction
Part I: The research covered by this paper
1. conventional oil
1.1. The modelling of Campbell and Laherrere(二番目のeの頭に`)
1.2. Checking by the University of Reading
1.3. Findings and uncertainties
1.4. Conventional oil depletion: summary
2. Conventional gas
2.1. Estimates of total endowment
2.2. Conventional gas depletion: summary
3. Non-conventional oil and gas
3.1. The resource base
3.2. Rate of production
Part II. Other views of the future of oil and gas
4. Misconceptions
4.1. Confusion between reserves, and the total recoverable
oil
4.2. Confusion between proved reserves, and (proved+probable)
reserves: the ‘reserves replacement’ problem
4.3. Atrocious reporting of proved reserves
4.4. Danger of using the ‘R/P’ ratio
4.5. Past forecasts
5. Experts' views
5.1. Exploration geologists
5.2. Oil companies
5.3. The United States Geological Survey (USGS)
(i) Reserves
(ii) Oil yet-to-find
(iii) Reserves growth
5.4. The International Energy Agency
5.5. The US DoE Energy Information Administration
5.6. Checking the ‘expert's’ views
Part III. Perspective, and Conclusions
6. Perspective
7. Conclusions
Appendix A. Predicting conventional oil peak
Appendix B
Definitions and units
References
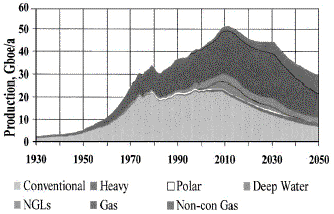
Fig. 1. Possible future production of ‘All Hydrocarbons’.
Note that gas is represented here at a conversion factor of 10
Tcf gas=1Gb oil equivalent. This is an industry norm, but the
calorific value is nearer 6 Tcf gas=1Gb oil equivalent. On the
latter basis, the area of the graph representing gas becomes
proportionally larger, but the overall shape of the graph changes
little; and the peak date, of about 2010 for ‘All Hydrocarbons’
production, is essentially unchanged. Source:Colin Campbell;
presentation at the Petrotech 2001 Conference, New Delhi, India,
January 2001.
図1.「すべての炭化水素」の可能性のある将来の生産量.天然ガスはここでは10Tcf(テラ・キュービック・フィート)天然ガス=1Gb(ギガ・バレル)石油換算という変換係数で表わされていることに注意。これは産業標準であるが、発熱量では6Tcf天然ガス=1Gb石油換算に近い。後者に基づけば、天然ガスを示す図の領域は比例して大きくなるが、図の全体的な形はほとんど変わらない;そして「すべての炭化水素」についてのおよそ2010年というピーク時期は、本質的に変わらない。出典:コリン・キャンベル;2001年1月にインドのニューデリーでのペトロテク
2001会議での発表。
〔Bentley,R.W.(2002): Global oil & gas depletion: an
overview. Energy Policy, 30, 189-205.から〕 |
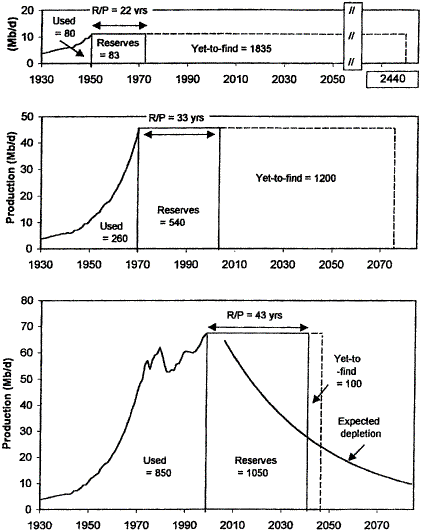
Fig. 5. A history of world oil:production, reserves, and
yet-to-find in 1950, 1970 and 1998. Notes:excludes NGLs.
Data in billion barrels (Gb). Assumes a conventional ultimate
of 2000 Gb, and calculates: Yet-to-find=Ultimated-(Cumulative
production+Reserves). Reserves here are public domain proved
reserves. (This makes the end-’98 yet-to-find somewhat misleading.
The industry end-’98 figure for (proved+probable) reserves, excluding
NGLs, is around 850 Gb, giving a yet-to-find, based on a 2000Gb
ultimate, of about 300 Gb). Depletion curve: Exponential decline
once 1000Gb has been produced. Sources: Reserves data from BP
Statistical Reviews, and as supplied by EDA Ltd. Production
data pre-1965 from Campbell. NGL’s estimated.
図5.世界の石油の歴史:1950年と1970年と1998年における生産量・埋蔵量・未確認量.注:NGLを除く。単位は10億バレル(Gb)。在来型の究極量を2兆バレルと仮定し、未確認量を計算:未確認量=究極量-(累積生産量+埋蔵量)。ここでの埋蔵量は社会共有財産確定埋蔵量。(これは1998年末の未確認(埋蔵)量に多少誤解を招く。産業のNGLを除く(確定+推定)埋蔵量の1998年末値は約8500億バレルで、2兆バレルの究極量を基にすると、未確認量は約3000億バレルとなる)。枯渇曲線:いったん1兆バレルが生産される、指数関数的に減少する。出典:埋蔵量データはBP統計レビューから、またEDA
Ltd.から補足。1965年以前の生産量データはキャンベルから。NGLは推定値。
〔Bentley,R.W.(2002): Global oil & gas depletion: an
overview. Energy Policy, 30, 189-205.から〕 |
戻る