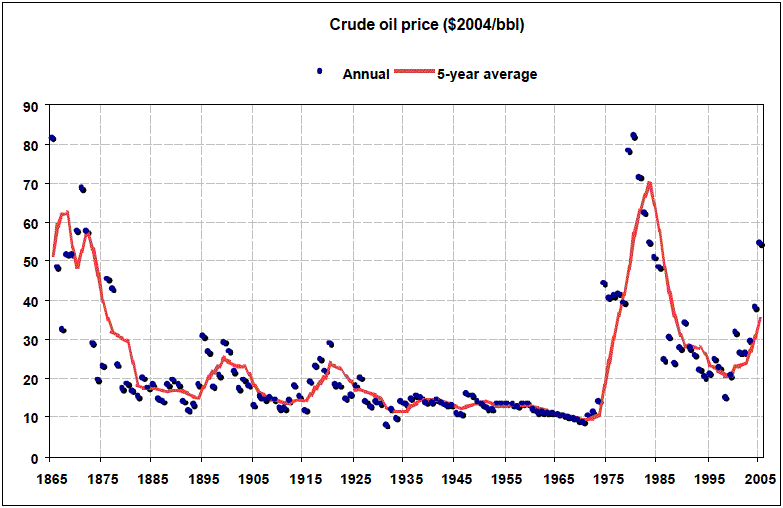
Source: BP Statistical Review 2006.
〔Mitchell,J.V.(2006): A New Era for Oil Prices. Chatham House (the Royal Institute of International Affairs), August 2006, 32p.から〕
Contents
『Summary and comment
Since 2003 the international oil market has been moving away from
the previous 20-year equilibrium in which prices fluctuated around
$25/bbl (in today's dollars). The single most important reason
is that growing demand has eliminated the structural surplus of
crude production capacity which had existed since the oil price
shock of 1979-83.
So far, the higher oil prices since 2003, and even higher since
2005, have not induced economic recession in oil-importing countries
so that oil demand has not fallen as it did in the 1980s after
the second oil shock. Unless this occurs, a structural surplus
will not be recreated, and prices are likely to remain ‘high’
- above $50/bbl - until longer-term reactions take effect. If
the political situation in the Middle East deteriorates further
prices could reach new levels, but the reaction would be quicker
and stronger.
Meanwhile, supply and demand are set to expand roughly in balance
over the next five years, though there are many uncertainties
which will lead to short-term fluctuations. With so little controllable
flexibility in supply or demand, prices will remain volatile in
the short term.
Five or more years of oil and related energy prices averaging
double (or more) their previous long-term average cannot fail
to create a new long-term situation both in terms of economic
behaviour and government policy. This will bring new competition
which will simultaneously reduce the demand for energy, increase
the supply of oil, and increase the substitution of other fuels
for oil outside the transport sector. As these forces develop,
oil prices will be unstable through the long term.
For the transport sector, there is a very large range of
possibilities which do not depend on the development of new technology.
Examples are a shift in US vehicle demand to vehicles with typical
Japanese or European fuel efficiency (which would reduce world
transport fuel demand by nearly 10%) and the opening of US and
European markets to competition from Brazilian and other developing
country ethanol supplies. A period of high oil prices will also
lead to investment to increase the production of liquid fuels
from oil sands or natural gas. Once these investments are made,
they are likely to continue producing as long as their operating
costs remain lower than the price of oil.
Outside the transport sector, oil has a higher share of
the energy market in many countries than in the US. If other countries
substituted other fuels for oil to the same extent as the US has,
world oil demand would be about 25% lower. However, other countries
do not have the same range of natural resources and competitive
energy markets as the US has. The main uncertainty about the long-term
outlook is where and how new natural gas markets will develop
at the expense of oil. This in turn depends on changing the pricing
system for natural gas, which has so far tracked high oil prices
outside the US, and on investment to expand gas production and
transport infrastructure for international trade. The business
model for these projects must adapt to the trend for liberalisation
of gas markets in importing countries
and specifically to rules which are often better adapted to secure
competition within established markets than to the management
of infrastructure expansion risks.
Power generation in centralised systems currently absorbs
about 5% of world oil demand. This would reduce to 2% if the rest
of the world used other fuels for power generation to the same
extent as the US. There are some trends in this direction. Over
half of the world's oil use in power generation is in oil exporting
countries, many of which are replacing oil with domestic gas in
order to free oil for export. A further third is in South East
Asia, where oil is being replaced by imported coal because coal
prices have not tracked the rise in oil prices, and expansion
of coal imports (unlike gas imports) does not depend on massive
infrastructure projects. The global oil market and price are only
marginally affected by the
European use of oil for power generation (less than 1% of world
oil consumption) and the promotion (for climate policy reasons)
of ‘renewable’ sources of electricity generation.
The main ‘energy policy’ conclusions of this analysis are:
1. In transition
1.1 Has there been a failure to invest?
1.2 Balance of supply and demand to 2010
Supply projections
Demand: no recession yet?
What next for prices?
Instability is certain
Chart 1: History of crude oil prices
2. The long term
2.1 Demand destruction
2.2 Economic activity and energy demand
Chart 2: US Energy use per unit of GDP
The tranport sector
2.3 Liquid fuels in the future
‘Unconventional’ oil
Heavy oil, shale oil and tar sands
Gas or coal-to-liquids (GTL or CTL)
Ethanol in Brazil and the US
Biomass
The EU bio-fuels policy
Hydrogen and fuel cells
2.4 Substitutes for liquid fuels
Chart 3: Oil price and market share
Chart 4: Oil for transport
Chart 5: Sectors with a higher use of oil than in the US
Gas: the challenge to oil has not materialized
Chart 6: Gas versus oil prices
Trends towards more competitive gas markets
Project-led expansion of gas markets
Key uncertainties in gas
The power generation sector
Coal
Chart 7: Coal versus gas prices
Nuclear electricity
Renewables
 Source: BP Statistical Review 2006. 〔Mitchell,J.V.(2006): A New Era for Oil Prices. Chatham House (the Royal Institute of International Affairs), August 2006, 32p.から〕 |