Koppelaar,R.H.E.M.(2005):World
Oil Production & Peaking Outlook. Peak Oil Netherlands
Foundation, 76p.
『世界の石油生産とそのピークの展望』
Table of contents
『Executive summary
It is widely known that oil, like other fossil fuels, is a finite
resource. The question when oil will be depleted has been asked
since the oil age began. What is less known, however, is that
before oil is exhausted, it will reach a production peak. This
peak can be described as the highest production level in the history
of oil after which a structural decline will commence. It is important
to determine the period in which this peaking will occur, in order
to implement appropriate mitigating measurements. Predicting the
exact timing of the peak is a difficult task however, due to a
lack of reliable data.
There are large uncertainties regarding reserve data. In the
1980's OPEC stated an increase of approximately 300 billion barrels
in their reserves within a few years. During this time no significant
discoveries were made. It is still unclear what the true amount
of reserves in OPEC countries are. The bigger problem is that
there is no worldwide accepted method to account for oil reserves
in place, various regions account their reserves in a different
way. On top of that, oil companies, whether national or commercial,
generally have a financial or political incentive to overstate
the amount of oil reserves they possess.
Because of the uncertainty regarding the amount of worldwide
reserves, oil production & peaking projections differ widely.
We probably will never know the true amount of worldwide reserves.
Therefore, it is recommended that the discussion of world oil
peaking is not primarily based on oil reserves but shifts to five
different areas.
- The net decline rate for the entire world. The total amount
of production declining per year from fields already past their
peak.
- The amount of production that will come from new discoveries
still to be made.
- The amount of production that can come from known reserves
not yet in production
- The amount of production that can come from implementing
new technologies and insights
- The amount of production that can come from unconventional
oil
This report contains as estimate of these five factors influencing
oil production. By approaching the peaking issue in two parts.
First of all, by creating a detailed oil production outlook between
2005 and 2010 using oil projects announced by oil companies and
estimating a decline rate for individual oil producing countries.
secondly by extrapolating on the data from this production outlook
and using well-documented trends in oil production.
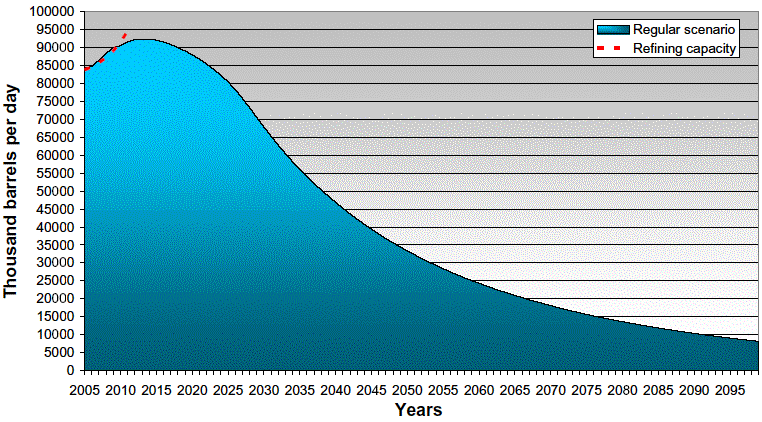
The central conclusion made from our research is that the production
of world liquids (all oil and oil equivalent resources) will approximately
peak around 2012. Liquids production is expected to form a “plateau”
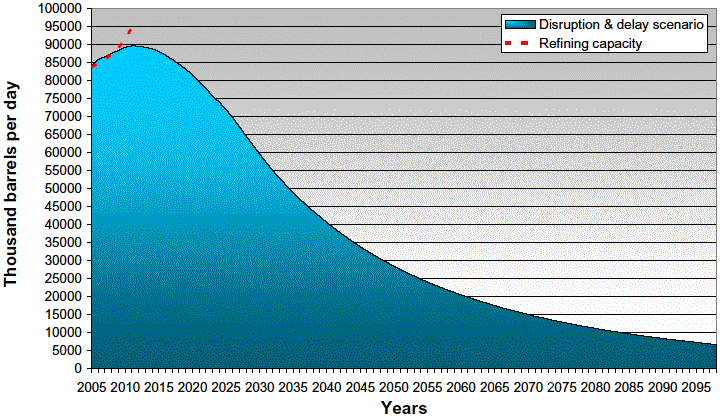
for approximately 6 years starting around 2010. This peak could
arrive earlier if our estimate for world decline rates proves
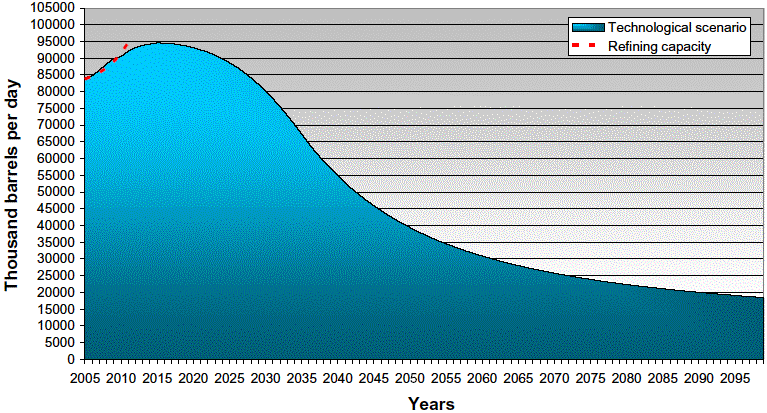
to be too low. It also could arrive later, around 2017, if oil
companies succeed in improving the recovery rate of oil due to
technological improvements.
This conclusion is largely based on:
- A Conservative decline rate for the world in comparison to
estimates made by the International Energy Agency.
- A continuation of the decline in oil discoveries since 1964.
More oil has been consumed than discovered since 1986; currently
twice as much oil is consumed than discovered
- Nearly every oil field ever discovered will be in production
after 2010
- Moderate production increases from reserve growth (an increase
in the recovery rate)
- A projection for unconventional oil production based on official
data from oil producers.
Since future predictions are always quite uncertain, this
world oil production & peaking outlook is not guaranteed to
accurate. However, this should not be seen as a reason to not
take peak oil issue seriously.
Current government policies in the Netherlands and elsewhere
are based on the assumption of a continued access to relatively
inexpensive fossil fuels. If this assumption turns out not to
be true anymore, then society will face serious difficulties,
as practically no precautions have been taken to anticipate such
a situation. Of the various oil production outlooks, most government
agencies seem to take into account only the optimistic ones, without
a proper understanding of the shortcomings and implicit assumptions
under which these forecasts were made (as is explained in Chapter
2). By refusing to take pessimistic projections (like ASPO, PFC
Energy, Douglas Westwood) into account, even as potential scenarios,
policy makers make huge, ill-supported and potentially dangerous
assumptions.
For an important subject as future energy supplies, one would
expect the involved agencies to carefully examine the merits of
each relevant forecast. The fact that the optimistic scenarios
of, for instance, the IEA are cheerfully and uncritically accepted
resembles in our view a serious lack of critical thinking among
various well-established agencies.
Other important conclusions of this report include:
It is expected that Non-OPEC liquids production will peak and
plateau around 2008.
The maximum average production growth in the period 2005-2010
rests at approximately 1.5%, a far lower level the the years 2003
(3.51%) and 2004 (4.16%). This means oil production growth levels
like those in 2003 and 2004 will not be able to continue.
Because of little to zero spare capacity on the market, any oil
disruption due to political, economical or natural events will
have a profound effect on oil prices. A global oil shock owing
to rising oil prices is likely in the period 2005-2010. At the
very least, the current tightness in the international oil market
will persevere. After 2010, continued price increases will become
a structural problem.』
Glossary of terms
1) Introduction - peaking of world oil production
2) The four peak oil estimation methodologies
The Hubbert methodology
The IEA prediction based on the USGS statistical methodology
The economical/market based methodology
The oil projects and decline methodology
3) Method
The supply forecast for the period 2005-2010
The extrapolated oil production outlook (2010 and beyond)
Assumptions
4) World production outlook “Ideal World” 2005-2010
OPEC
Non-OPEC
Total world
5) World production outlook “Turbulent world” 2005-2010
6) Oil project analysis
7) Peak Oil Netherlands oil production & peaking outlook
Decline rates
The amount of production from future discoveries
Production from discovered fields not yet on-stream
Increased oil production due to reserve growth
Unconventional oil production
8) A sum of five parts - When will world oil production peak?
10) Summary of arguments and conclusions
11) Implications of a world oil production peak
Appendix A - Datasets used in the production model
Appendix B - Comparison of different oil project reports
Appendix C - Specific country data
OPEC
A) Algeria
B) Indonesia
C) Iran
D) Iraq
E) Kuwait
F) Libya
G) Nigeria
H) Qatar
I) Saudi-Arabia
J) United Arabic Emirates
K) Venezuela
Non-OPEC
1) USA
2) Canada
3) Mexico
4) Argentina
5) Brazil
6) Colombia
7) Ecuador
8) Peru
9) Trinidad & Tobago
10) Denmark
11) United Kingdom
12) Norway
13) Italy
14) Romania
15) Oman
16) Syria
17) Yemen
18) Angola
19) Cameroon
20) Congo Brazzaville
21) Egypt
22) Gabon
23) Tunisia
24) Australia
25) Brunei
26) China
27) India
28) Malaysia
29) Vietnam
30) Azerbaijan
31) Kazakhstan
32) Russia
Appendix D - Oil projects data
Glossary of Terms
|
GB |
giga barrel or 1000 million barrels or one billion barrels |
|
Mb/d |
million barrels per day |
|
b/d |
barrels per day, also noted in industry terms as bbl/d which
refers to blue barrel per day. A term originating from the early
days of the American oil industry were they used to work with
barrels in a blue color. |
|
boe/d |
barrels of oil equivalents per day |
|
WROI/EROEI |
energy return on energy invested. The extraction, transport and
processing of any fuel produced uses energy. EROI indicates the
net energy balance for the process of producing a fuel/enegy.
Summarized by M.K.Hubbert as:
“There is a different and more fundamental cost that is independent
of the monetary price. That is the energy cost of exploration
and production. So long as oil is used as a source of energy,
when the energy costs of recovering a barrel of oil becomes greater
than the energy content of the oil, production will cease no
matter what the monetary price may be” |
|
API gravity |
American Petroleum Institute gravity, a term that indicates the
heaviness and quality of oil. A higher gravity number indicates
kighter oil and therefore a better quality. |
|
EUR or URR |
estimated ultimate oil recovery/ultimately recoverable resources.
Those quantities of petroleum which are estimated, on a given
date, to be potentially recoverable, plus those quantities which
already have been produced at that time. |
|
Olimulsion |
extra heavy oil from the Orinoco belt in Venezuela |
|
Proved resserves |
reserves of petroleum in place that can be estimated with a reasonable
certainty by analysis of geological and engineering data. They
must be commercially recoverable at current oil prices from known
reservoirs, with current operating methods and current government
regulations. Proved reserves are categolized as developed or
undeveloped. |
|
Probable reserves |
reserves of petroleum in place that are less likely to be recoverable
concluded from analysis of geological and engineering data. In
this context, when probabilistic methods are used, there should
be at least a 50% probability that the quantities actually recovered
will equal or exceed the sum of estimated proved plus probable
reserves. |
|
Possible reserves |
unproved reserves that are less likely to be recoverable than
probable reserves concluded from analyss of geological and engineering
data. In this context, when probabilistic methods are used, there
should be at least a 10% probability that the quantities actually
recovered will equal or exceed the sum of estimated prived plus
probable plus possible reserves. |
|
Montte Carlo simulation |
a type of stochastic mathematical simulation, which randomly
samples variables. These variables can be used as distributions
to simulate for example recoverable petroleum volumes. |
|
Oil initially in place |
the quantity of petroleum that is estimated, on a given date,
to be contained in known accumulations, plus the quantities already
produced there from. |
|
Liquids |
oil and oil equivalent resources, this includes light, medium
and heavy oil, Natural Gas Liquids (NGL), tar sands or oil sands,
oil shale, deepwater oil and polar oil. |
|
Oil projects |
projects that add oil production either by bringing new fields
into production or by inv\creasing production due to the implementation
of technology. |
|
Depletion |
the decline in oil reserves in a given year due to production. |
|
Depletion rate |
the rate at which reserves are declining in a given year |
|
Decline |
the decrease in production in a given year |
|
Type I decline |
the decline of production in an oil field that comes from wells
in the field. This decline can be offset by bringing new wells
on-stream or by increasing production from other existing wells
in the field. |
|
Type II decline |
the decline of production in an oil field that cannot to be offset
by placing new wells or by increasing production from other existing
wells in the field. This decline has to be oddset with a production
increase in another field or region. |
|
Type III decline |
the decline of production in an entire country. This decline
has to be offset with a production increase in another country. |
|
Recovery rate |
the amount of oil that can be extracted out of the ground at
current oil prices from known reservoirs, with current operatimg
methods, as a percentage of the total amount of oil present in
the field. |

Figure 28 - World liquids production outlook “Regular” 2005-2100

Figure 29 - World liquids production outlook “Technological”
2005-2100

Figure 30 - World liquids production outlook “Disruption &
Delay” 2005-2100
〔Koppelaar,R.H.E.M.(2005):World
Oil Production & Peaking Outlook. Peak Oil Netherlands
Foundation, 76p.から〕 |
戻る


