Federal Ministry for the Environment,
Nature Conservation and Nuclear Safety (BMU)(2009):Renewable
Energy Sources in Figures National and International Development.
2009年6月。80p。
『図で見る再生可能エネルギー源 国内的および国際的発展』
CONTENTS
Introduction
Working Group on Renewable Energies - Statistics (AGEE-STAT)
PART I: Renewable energy sources in Germany: Guarantees
for climate protection, sustainability and supply reliability
8
Renewable energy sources in Germany: The most important developments
in 2008 at a glance 11
Contribution of renewable energy sources to energy supply in Germany,
2008 12
Renewable energy sources as a share of energy supply in Germany,
1998 to 2008 13
Final energy consumption in Germany, 2008 . Shares of renewable
energy sources 14
Structure of energy supply from renewable energy sources in Germany,
2008 15
Development of energy supply from renewable energy sources in
Germany, 1990 to 2008 16
Emissions avoided via the use of renewable energy sources in Germany,
2008 21
Development of energy-related emissions in Germany, 1990 to 2008
25
Energy-related emissions in Germany according to source groups,
2007 27
Fossil fuels saved via the use of renewable energy sources in
Germany, 2008 28
Turnover from renewable energy sources in Germany, 2008 29
Jobs in the renewable energies sector in Germany 31
Feed-in and fees under the Act on the Sale of Electricity to the
Grid (StrEG)
and the Renewable Energy Sources Act (EEG) since 1991 32
Cost to electricity consumers 33
Effects of renewable energies on electricity prices 35
Macroeconomic external costs 36
Overview of the costs and benefi cial effects of the Renewable
Energy Sources Act (EEG) 37
Promoting renewable energy sources 38
Research and development of technologies for the use of renewable
energy sources 41
Long-term, sustainable utilisation potential of renewable energy
sources for electricity,
heat and fuel production in Germany 44
Scenario for an intensifi ed expansion of renewable energies in
Germany 45
Part II: Renewable energy sources in
the European Union 48
Use of renewable energy sources in the EU 51
Expansion of electricity generation from renewable energy sources
in the internal European electricity market 52
Supply of electricity from renewable energy sources in the EU
53
Use of wind energy in the EU 55
Heat supply from renewable energy sources in the EU 57
Fuels from renewable energy sources in the EU 58
Instruments for the promotion of renewable energy sources in the
EU electricity market 59
Part III: Global use of renewable energy
sources 61
Global energy supply from renewable energy sources 63
Global use of renewable energy sources in 2006 according to regions
65
Global electricity generation from renewable energy sources 66
International Renewable Energy Agency (IRENA) 67
International Conference for Renewable Energies . Renewables 2004
. and the follow-up process 68
Appendix: Methodological notes 69
Conversion factors 77
Bibliography 78
INTRODUCTION
The brochure “Renewable Energy Sources in Figures . National
and International Development” has been published annually by
the German
Environment Ministry (BMU) since 2002, and contains information
on the development of renewable energy sources in Germany, the
European
Union and worldwide.
In recent years, renewables have developed at a rapid rate, but
the pace of expansion varies considerably between regions. Many
of the world’s
countries have come to realise that the intensive use of renewable
energy sources represents an important step towards protecting
our climate,
and a useful way of reducing our consumption of fossil resources
and our growing dependency on imports of raw energy resources.
The climate
and energy problem is not a national issue but a global one, and
is increasingly becoming a top priority for politicians. Drastically
reducing
our emissions of climate-damaging greenhouse gases is considered
particularly important in this regard.
Thanks to its ambitious climate and energy programme, the German
Government is making a national contribution to the European Union’s
joint climate protection targets, and thereby also contributing
to the success of international climate negotiations. The German
Government is guided
by ambitious but realistic targets:
- Emissions of greenhouse gases are to be cut by 40 % by 2020
compared with 1990 levels; by the end of 2007, Germany had already
achieved a reduction of -21.3 %.
- Energy productivity is to be increased by 3 % per annum.
This means that by 2020, energy use will be twice as effi cient
as in 1990.
- Building on the continuous rise in renewables in recent years,
their share is to be further signifi cantly increased:
・The proportion of gross electricity consumption attributable
to renewables is to be increased from its current level of 15
percent to at least
30 percent by 2020, with plans for further continuous expansion
thereafter.
・The proportion of heating energy consumption attributable to
renewables is to be increased from its current level of just
under 8 percent to
14 percent by 2020.
・Through the use of biofuels, greenhouse gas emissions are to
be reduced by 7 percent by 2020 compared with the use of fossil
fuels, corresponding to an energy share of around 12 percent.
・In the long term (by 2050), the proportion of total energy consumption
attributable to renewables in Germany is to be increased to around
50 percent.
- The share of electricity from cogeneration (CHP) is to be
doubled to 25 percent by 2020.
Germany’s targets for the expansion of renewable energy sources
must be viewed within the context of the European Union’s current
targets, which aim to increase the share of total fi nal energy
consumption attributable to renewables to 20 percent by 2020.
Germany has been
allocated a share of 18 percent, almost double of the current
level.
At present, the likelihood of achieving these targets in Germany
looks very positive. With the new Renewable Energy Sources Act
(EEG, 2009),
the Act on the Promotion of Renewable Energies in the Heat Sector
(EEWarmeG 2009), the promotion of renewables via targeted market
incentive programmes, a wide range of initiatives in the research
and development sector, plus a host of other mechanisms, the German
Government and its legislative authorities have created the necessary
requirements for future development in Germany. These instruments
are
accompanied by numerous activities at Land and local authority
level, together with measures by various institutions, private
individuals and
companies.
Part one of this updated publication contains information on the
development of renewable energy sources up until 2008, their environmental
impacts, and the economic effects in Germany. It also provides
an overview of the German Government’s objectives, the mechanisms
for
achieving these targets, and information on the support of renewables
and funding priorities in this sector. Parts two and three contain
information on renewables in the European Union and at global
level.
【ドイツ】
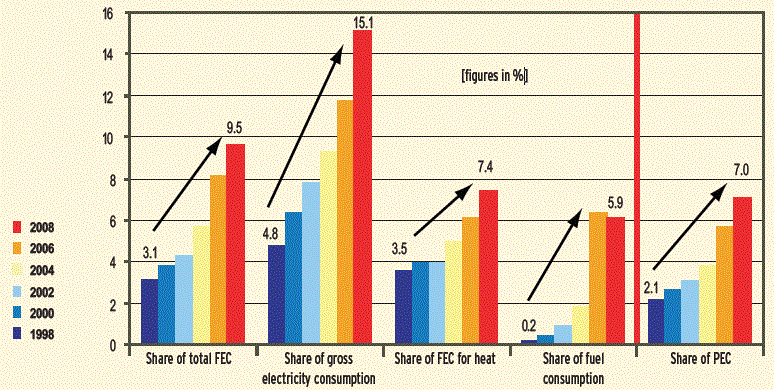
Renewable energy sources as a share of energy supply in Germany
FEC= Final energy consumption, PEC=Primary energy consumption,
calculated according to the physical energy content method
Sources: BMU based on AGEE-Stat and other sources, see following
tables
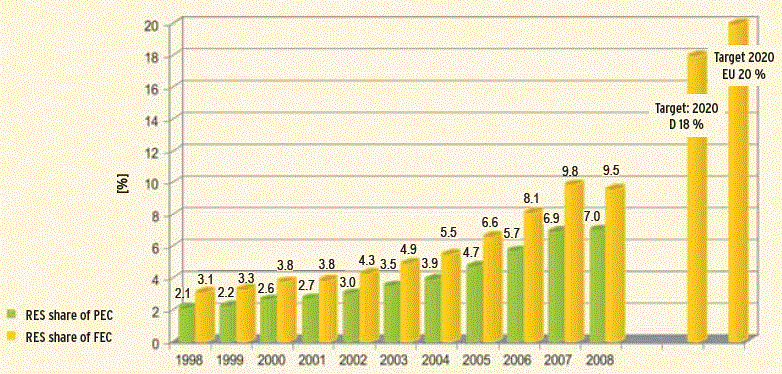
Development in the shares of primary and final energy consumption
attributable to renewables in Germany since 1998
PEC according to physical energy content method
Sources: See table above(略)
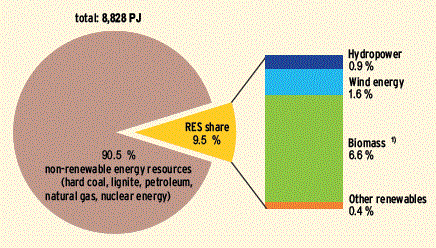
Shares of renewables among total final energy consumption
in Germany, 2008
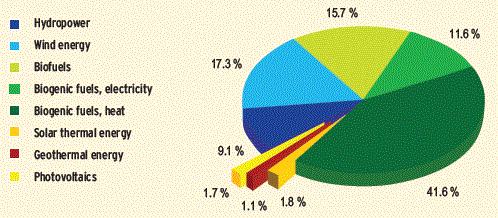
Structure of final energy supply from renewable energy sources
in Germany, 2008
1) Biogenic solid fuels, biogenic liquid and gaseous fuels, biogenic
portion of waste, biogas, sewage and landfi ll gas, and biofuels
Sources: BMU based on AGEE-Stat and other sources, see table
on page 12
Federal Ministry for the Environment, Nature Conservation
and Nuclear Safety (BMU)(2009)による『Renewable
Energy Sources in Figures National and International Development』から |
【ヨーロッパ】
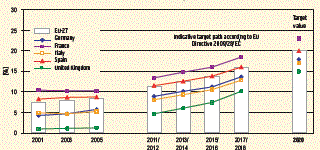
We have selected the 5 EU Member States with the highest fi nal
energy consumption
The new EU Directive 2009/28/EC sets out an indicative target
path for the share of final energy consumption attributable to
renewables. The Member States are required to take suitable measures
to ensure that their
share of energy from renewable sources meets the national guidelines
of the target path as a minimum requirement.
Sources: according to EC [92], Eurostat [91]
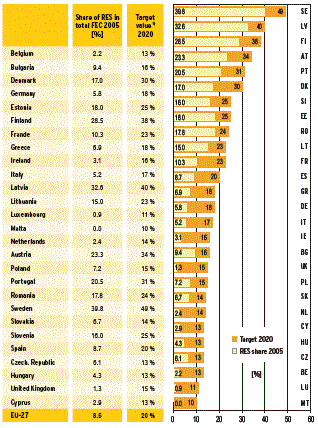
Share of renewable energies in fi nal energy consumption in
selected EU countries
1) RES shares 2005 and overall national targets for the share
of fi nal energy consumption
from renewables in accordance with EU Directive 2009/28/EC
Sources: EC [92], Eurostat [91]
General remarks
In 2004, the EU-15 was enlarged by 10 new countries to form the
EU-25. A further two Member States acceded in 2007, and the EU
is now comprised of 27 Member States (EU-27) (cf. also Appendix,
para. 9).
The texts and time series contained in this brochure include
the new Member States from the year of their accession.
The data on renewable energy supply and use in Germany contained
in European and international statistics sometimes deviates from
the fi gures found in German sources. As well as different data
origins, this is also partially attributable to different calculation
methods (calculated according to the physical energy content
method; cf. also Appendix para. 5 and 11). In the section on
“Europe”, the data for
Germany has been taken from the international statistics for
consistency purposes. Generally speaking, however, the detailed
information contained in the national sources on the preceding
pages is more reliable.
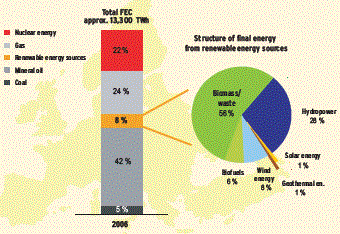
Structure of final energy consumption in the EU
The new EU Directive on the promotion of energy from renewable
sources focuses primarily on the share of total final energy
consumption attributable to renewables. Until now, statistics
concerning fi nal energy consumption have focussed on the shares
attributable to the various different sectors. The diagram opposite
shows a breakdown into
different energy carriers, calculated on the basis of various
statistics compiled by Eurostat. As such, the shares given are
only intended to indicate the dimensions of the different energy
carriers. Calculated according to the physical energy content
method.
Sources: ZSW [3] according to Eurostat [34]
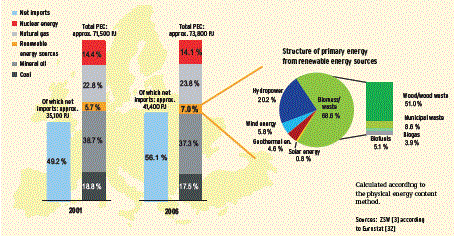
Structure of primary energy consumption in the EU
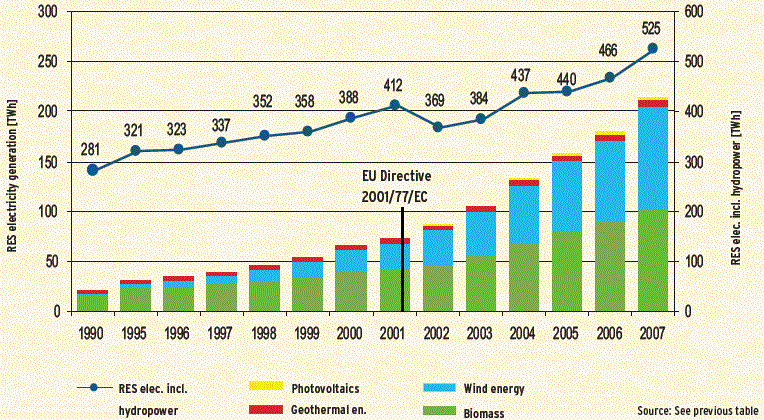
Supply of electricity from renewable energy sources in the
EU
Federal Ministry for the Environment, Nature Conservation
and Nuclear Safety (BMU)(2009)による『Renewable
Energy Sources in Figures National and International Development』から |
【世界】
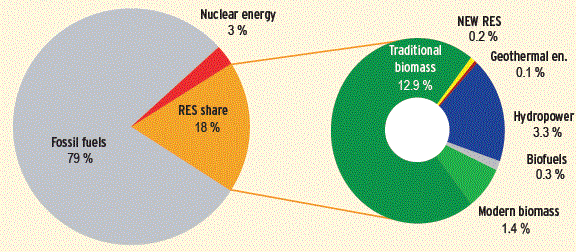
Structure of global final energy consumption, 2006
The global final energy share is higher than the global primary
energy share. This is partly due to traditional biomass,
all of which represents fi nal energy consumption
Furthermore, the level of primary energy share also depends on
the method used to calculate the primary
energy equivalent of renewable energy sources, cf. Appendix,
para 5, 11 and 12.
New RES = Wind, solar and ocean energy
Source: according to REN21 [33]
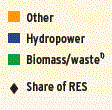
Global development of renewable primary energy supply and
share of renewable energy sources (RES)
1) Only includes the renewable portion of waste
On calculation of the RES share, cf. also Appendix, para 12.
Sources: IEA [31], [54]
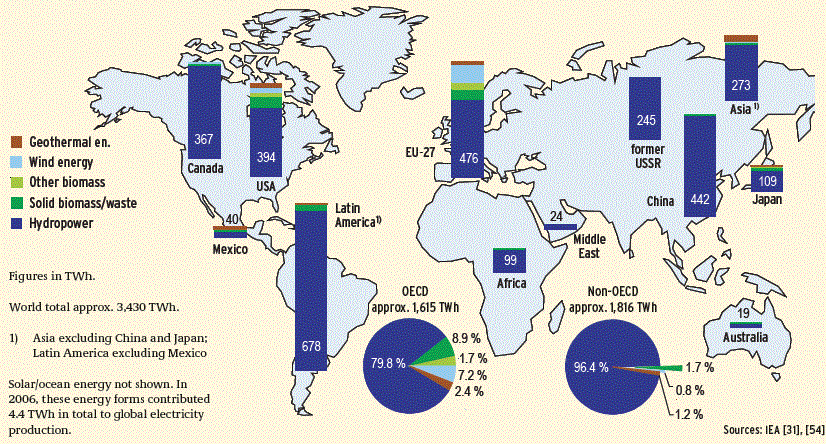
Electricity generation from renewable energy sources in various
regions, 2006
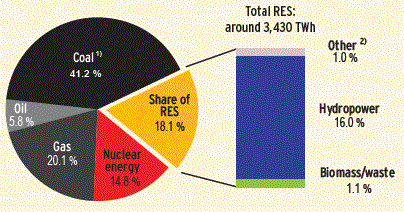
Share of renewable energy sources in global electricity generation,
2006
At 16 %, global electricity generation from
hydropower is higher than that from nuclear energy (14.8 %).
Looking at the PEC shares, this ratio is inverted, with nuclear
energy providing a considerably higher share of PEC at 6.2 %
than hydropower at 2.2 %. The reason for this distortion is that
according to international agreements, electricity from uclear
power is rated at an average conversion effi ciency of 33 % in
relation to primary energy, while electricity from hydropower
is rated at a conversion effi ciency of 100 % according to the
so-called physical energy content method; cf. Appendix, para.
5.
1) Includes non-renewable portion of waste (0.2 %)
2) Geothermal energy, solar energy, wind energy, ocean energy
Sources: IEA [31], [54]
Federal Ministry for the Environment, Nature Conservation
and Nuclear Safety (BMU)(2009)による『Renewable
Energy Sources in Figures National and International Development』から |
戻る


