Peter,S. and Lehmann,H.(2008): Renewable Energy Outlook 2030 Energy Watch Group Global Renewable Energy Scenarios. Energy watch Group, 155p.


Content

Executive Summary....................................................................................................................4
Introduction..............................................................................................................................14
Methodology............................................................................................................................16
 General Calculation Approach.............................................................................................17
 Interaction of Investment Budget and the Decreased Cost of Technologies........................18
 General Growth Assumption................................................................................................19
Investment Budgets for Renewable Energy Technologies........................................................22
 Investment Budgets in the REO 2030 Scenarios..................................................................23
 Distribution of Investments in Various Technologies...........................................................25
Development of Technology Costs...........................................................................................28
Development of Investment Budgets in the Scenarios.............................................................32
Development of Electricity-Generating Capacities and Electricity Production.......................36
 High Variant Scenario: General Development in the Global Context..................................36
 Low Variant Scenario: General Development in the Global Context..................................39
 Electricity production in the “High Variant” Scenario.........................................................41
 Electricity Production in the “Low Variant” Scenario.........................................................42
Development of Final Energy Supply.......................................................................................44
 Final Energy Demand in the WEO 2006, Alternative Scenario...........................................44
 Shares of Final Energy Supply in the “High Variant” Scenario...........................................45
 Shares of Final Energy Supply in the “Low Variant” Scenario............................................47
 Why This Study Does Not Show Primary Energy Figures..................................................50
Reality Check...........................................................................................................................52

Annex............................................................................................................................................55
Baseline data............................................................................................................................56
 Population and Population Development and land areas.....................................................56
 Coastal lengths.....................................................................................................................56
 Gross Domestic Product.......................................................................................................56
 Current installed renewable capacities.................................................................................56
The Regions in detail................................................................................................................58
 Generating capacities, production and investments in the “High Variant Scenario”...........58
 Generating capacities, production and investments in the “Low Variant” scenario.............98
Potentials used in the scenarios...............................................................................................138
 A preliminary note on potentials........................................................................................138
 Wind energy.......................................................................................................................138
 Solar photovoltaic systems.................................................................................................142
 Solar-thermal systems........................................................................................................143
 Solar concentrating power..................................................................................................144
 Biomass (electricity)...........................................................................................................147
 Biomass (heat)....................................................................................................................149
 Geothermal energy (electricity)..........................................................................................150
 Geothermal Energy (heat)..................................................................................................152
Initial technology costs...........................................................................................................153
Sources / Literature.................................................................................................................154


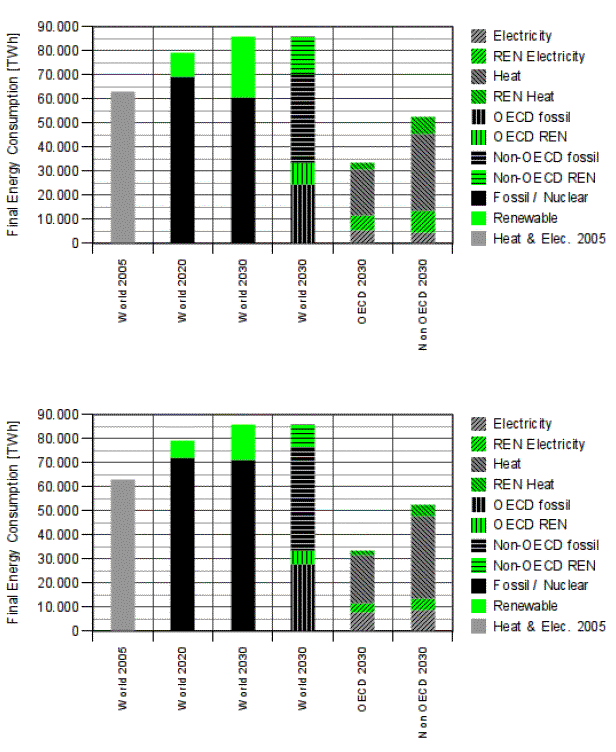
The first bar shows the final energy demand in 2005 (grey), without breakdown to fossil or renewable sources. Bars 2 an d 3 show the development of final energy demand up to 2030, the renewables contribution (always green) according to the scenarios and the fossil & nuclear contribution (always black or grey). The remaining bars provide more details on the figure for 2030. Bar 4 shows the values for OECD (vertically hatched, black is fossil, green is renewable) and non-OECD (horizontally hatched). Bars 5 and 6 show details for OECD (bar 5) and non-OECD (bar 6), broken down to electricity (hatched lower left to upper right) and heat (hatched upper left to lower right). Again renewewables are green but fossils are grey this time.
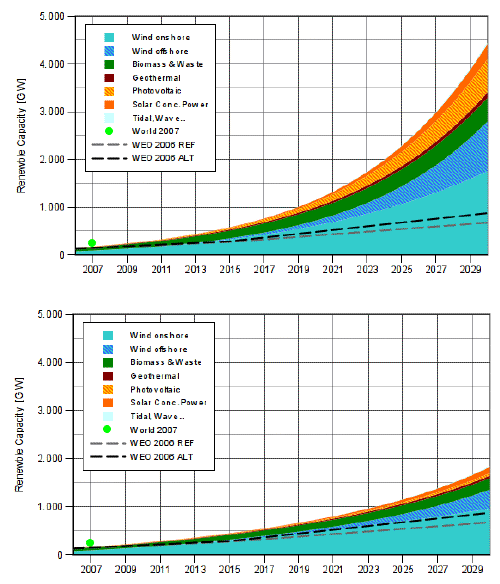

Figure 3: Development of “new” renewable electricity generating capacities in the world regions in the ”High Variant” (upper figure) and ”Low Variant Scenario” (lower figure) [EWG; 2008].Data on renewable capacity 2007: [REN 21; 2007].

〔Peter,S. and Lehmann,H.(2008)によるRenewable Energy Outlook 2030 Energy Watch Group Global Renewable Energy Scenariosから〕


ホーム