Energy Watch Group(2008): Wind
Power in Context - A clean Revolution in the Energy Sector.
195p.
Content
Abstract _______________________________________________________________________
7
1. Executive Summary _____________________________________________________
8
ü@Misleading predictions and the role of IEA (International Energy
Agency) _________________ 10
ü@The 2008 World Energy Outlook ___________________________________________________
11
ü@The real significance of wind power: four scenarios ___________________________________
12
ü@Model assumptions _____________________________________________________________
13
ü@ü@Model findings _______________________________________________________________________
17
ü@Underlying Innovations __________________________________________________________
17
ü@ü@Social Innovation______________________________________________________________________
17
ü@Farü]off Gigawatt clusters for wind _________________________________________________
18
ü@Breakthrough in regulations ______________________________________________________
19
ü@ü@The problems of nonü]renewables ________________________________________________________
20
ü@ü@Political opponents ____________________________________________________________________
21
ü@Intermittency and interconnection ________________________________________________
21
ü@ü@Older natural gas plants as backü]up _______________________________________________________
21
2. Oil peak and the power sector
____________________________________________ 23
3. Wind power: Global market status
________________________________________ 26
ü@Why is the situation in the wind market so different today from
what it was before? _______ 28
ü@Struggling for takeü]off (1996ü]2005) ________________________________________________
29
ü@ü@ügTeething problemsüh __________________________________________________________________
38
ü@The Globalization of wind power: 2005 and beyond ___________________________________
40
ü@ü@Emergence of new markets _____________________________________________________________
42
ü@The situation today _____________________________________________________________
45
ü@World annual installations Growth Rates ___________________________________________
46
ü@ü@Component shortages _________________________________________________________________
47
ü@The advantages of wind power ____________________________________________________
51
4. Four World Scenarios for the Wind Sector
___________________________________ 52
ü@Preliminary remark _____________________________________________________________
52
ü@Continuous growth of the wind sector projected _____________________________________
53
ü@Model assumptions _____________________________________________________________
53
ü@World electricity generation and consumption _______________________________________
55
ü@The ügeffective power capacityüh Concept ____________________________________________
56
ü@ü@Managing power reserves and interconnection _____________________________________________
57
ü@ü@Lower capacity factors . higher capital costs . lower fuel costs
_________________________________ 57
ü@The ügother renewablesüh sector ____________________________________________________
59
ü@Development of the wind sector and market shares (accompanied
by solar) ______________ 60
ü@Wind annual capacity additions ___________________________________________________
61
ü@Overall market conquest by renewables ____________________________________________
62
ü@Market development of nonü]renewables and CO2ü]emissions ___________________________
65
ü@Nonü]renewable power generation and CO2ü]emissions _________________________________
66
ü@The modelüfs meaning in real terms ________________________________________________
68
ü@ü@Territories for wind power ______________________________________________________________
68
ü@ü@Roofs and territories for solar ___________________________________________________________
68
ü@Real market trends of wind power in 2007 __________________________________________
69
ü@Comparisons with the real world __________________________________________________
70
ü@ü@China _______________________________________________________________________________
72
5. On the accuracy of Wind Power Installation
Forecasts ________________________ 73
ü@Methodological remark __________________________________________________________
73
ü@What do past forecasts on Germany tell us? _________________________________________
73
ü@ü@Cumulative capacity forecasts and reality: Germany __________________________________________
73
ü@ü@Annual additions forecasts and reality: Germany ____________________________________________
75
ü@ü@Outlook beyond 2007: Germany _________________________________________________________
76
ü@What do past forecasts in Europe tell us? ___________________________________________
78
ü@What do past forecasts for the world wind market tell us? _____________________________
84
ü@ü@Forecasts by the International Energy Agency _______________________________________________
84
ü@ü@The 2008 IEA ügblue scenarioüh for the G8 ___________________________________________________
87
ü@The IEA World Energy Outlook 2008 _______________________________________________
89
ü@ü@Revised oil supply and oil price projections _________________________________________________
89
ü@ü@World Energy Outlook 2008 and Wind power _______________________________________________
89
ü@BTM Consultüfs world market forecasts _____________________________________________
93
ü@ü@Outlook beyond 2007: World ____________________________________________________________
97
ü@ü@Possible causes of stagnation ____________________________________________________________
98
ü@Comment on the German case of wind power forecast ________________________________
99
ü@ü@Andalusia - similarities with Germany? ___________________________________________________
100
ü@Comment on European wind power forecasts ______________________________________
102
ü@Comment on the world market forecasts and IEA practices ____________________________
106
ü@Fundamentally positive world perspective _________________________________________
111
6. Key drivers of future growth ____________________________________________
113
ü@Innovations improving wind technology ___________________________________________
113
ü@ü@Small wind systems ___________________________________________________________________
115
ü@Innovations regarding system benefits of wind power ________________________________
115
ü@ü@Better weather forecasts ______________________________________________________________
115
ü@ü@Better interconnection ________________________________________________________________
117
ü@ü@Better regulations for interconnection ___________________________________________________
118
ü@ü@Creation of renewable energy zones (CREZ) _______________________________________________
119
ü@Enlarging the wind resource _____________________________________________________
122
ü@ü@Development of peripheral locations _____________________________________________________
123
ü@ü@Offshore power generation ____________________________________________________________
125
ü@ü@New offshore foundations _____________________________________________________________
126
ü@ü@Floating turbines _____________________________________________________________________
126
ü@ü@Positive implications __________________________________________________________________
127
ü@New investors ________________________________________________________________
128
ü@ü@Investments by emerging economies_____________________________________________________
129
ü@New manufacturers ____________________________________________________________
130
ü@Drivers from the nonü]renewable power sector ______________________________________
131
ü@ü@Competing with new power plants instead of old ___________________________________________
131
ü@ü@Problems of the nonü]renewable sector ___________________________________________________
131
ü@ü@Environmental pressures ______________________________________________________________
132
7. The cost of wind power ü] empirical trends
_________________________________ 134
ü@Eroding costs over time ü] the golden end of renewable power systems
__________________ 134
ü@Cost data of wind power in the USA 1999ü]2007 _____________________________________
135
ü@Wind integration costs _________________________________________________________
140
ü@ü@Wind power full costs in the US _________________________________________________________
141
ü@The cost situation in Europe _____________________________________________________
142
ü@Operation & management (O&M) costs ___________________________________________
143
8. The economics of wind power over the next
decade _________________________ 146
ü@The key drivers ________________________________________________________________
146
ü@ü@oil prices will continue to remain high, as will demand for
fossil fuels. __________________________ 146
ü@ü@Feedü]in tariffs rehabilitated? ___________________________________________________________
147
ü@ü@Wind farms with a higher value than their costs ____________________________________________
147
ü@The price of power compared over the next 10 years _________________________________
150
ü@ü@Generation costs in 2008 ______________________________________________________________
151
ü@ü@The cost situation in 2020 _____________________________________________________________
152
ü@Renewable energy . boom or hype? ______________________________________________
153
ü@Some remarks on coalü]fired power, compared with wind _____________________________
154
ü@ü@Conclusions _________________________________________________________________________
156
ü@Some remarks on the costs of gasü]fired electricity ___________________________________
157
ü@The costs of nuclear power ______________________________________________________
158
ü@ü@Liability exemption and more ___________________________________________________________
159
ü@ü@Conclusion regarding cost comparisons ___________________________________________________
161
ü@Why more wind power comes at a profit __________________________________________
162
ü@ü@Reduction of volatility by integration over vast areas ________________________________________
167
ü@ü@Wind energy as a base load source ______________________________________________________
168
ü@Case studies for wind integration: Texas and else ____________________________________
169
ü@ü@The chicken and egg problem ___________________________________________________________
171
ü@ü@More case studies ____________________________________________________________________
171
ü@Conclusion: wind integration is doable . interconnection a cost
saver! __________________ 174
9. Obstacles and how to resolve them
_______________________________________ 175
ü@Birds ________________________________________________________________________
175
ü@Ugly wind farms? ______________________________________________________________
176
ü@Polls show strong support for wind power _________________________________________
178
10. Transmission . chief roadblock or key to
save money? _____________________ 179
ü@Wind fears ___________________________________________________________________
179
ü@The tasks _____________________________________________________________________
181
ü@ü@How much backü]up energy and backü]up capacity is needed? __________________________________
182
ü@Balancing, peak reserves, grid issues ______________________________________________
183
ü@ü@Balancing ___________________________________________________________________________
183
ü@Creating a low cost backü]up hierarchy _____________________________________________
186
ü@Conclusion ___________________________________________________________________
188
11. References _________________________________________________________
189
Abbreviations
CAGR Compound Annual Growth Rate
CF capacity factor
CF-100 capacity factor of 100% - a theoretical capacity able to
deliver base-load with a 100% availability over 8760 hours per
year
CHP combined heat and power
EWEA European Wind Energy Association
EWEC European Wind Energy Conference
GWEC Global Wind Energy Council
HVDC High voltage direct current (connection)
IEA International Energy Agency
MW Megawatt (1,000,000 W)
NFFO Non Fossil Fuel Obligation
NGCC Natural Gas Combined Cycle plant
O&M operation and maintenance (costs)
PPA Power purchase agreement
PTC Production Tax credit (a tax deduction of some 1.8-2.1 US-Cents)
US United States of America
WWEA World Wind Energy Association
Cover Pictures
Vestas V90-3,0 MW Bockinghalde / Germany, courtesy of Vestas
Q7/ Princess Amalia wind farm, off the Netherlands, by Jerome
Guillet
Abstract
This study is about growth, past forecasts and the future prospects
of wind energy.
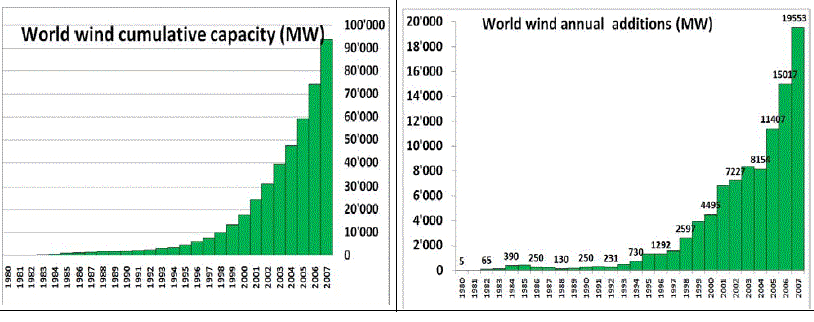
Wind power net capacity additions over the last ten years (1998-2007)
have showed a mean growth rate of 30.4 percent per year, corresponding
to a doubling of net additions every 2 1/2 years.
In 2007, net capacity additions reached 19553 Megawatts, a level
that most energy pundits failed to anticipate. Net additions,
in 2007, were 417 percent bigger than the mean estimate published
by the International Energy Agency (IEA), in its World Energy
Outlook 1995-2004 editions.
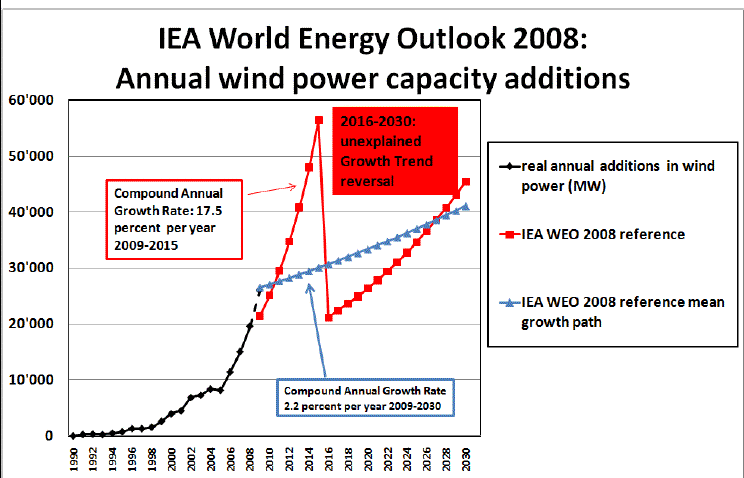
In the IEAüfs most recent World Energy Outlook (2008) scenario,
it again predicts a low growth ügreference scenarioüh for wind power
with only a 2.2 percent increase of annual wind capacity additions
over the 2010-2030 period. The IEA acknowledges that the ügrisk
of a supply crunchüh for oil after 2010 could be ühdriving up oil
prices . possibly to new record highsüh, but then fails to revise
its forecasts for renewable energies. Not Surprisingly, the IEA
forecasts have historically proven to be empirically unsound.
This study takes a different view, developing four global scenarios
for the future of wind power, after scrutinizing some of the most
established forecasts for the wind sector. It assumes a continuous
growth of global wind power additions over the next decades. The
driving force for this growth is not ecological or moral motivations
but the demonstrable economic advantages of wind power, including
the abundant and cost free primary energy source (wind) which
never runs out, easy technology access, short time to market,
stable life-cycle-costs and continuous cost reductions due to
progress on the learning curve.
In scenario A, the observed mean annual growth rate of wind power
additions, 30.4 percent, from 1998 to 2007, is used as a proxy
for further expansion. As a result, wind energy will have conquered
a 50 percent market share of global new power plant installations
by 2019 and a close to 100 percent market share by 2022, alongside
with solar and other renewables such as hydro and biomass. Global
non-renewable power generation would peak in 2018 and could be
phased out completely by 2037.
The scenarios B, C and D, with half the annual growth rates for
wind power or/and electricity consumption growth, show similar
results: Market conquest of the wind sector (together with other
renewables) is expected in 2019 (scenario C), 2031 (scenario D)
or 2039 (scenario B). Non-renewable power generation will peak
between 2014 and 2032 and could be phased out within the following
two decades.
The study concludes that roadblocks against wind power growth,
such as fluctuations of wind, lack of grid connections and lack
of reserve capacities, will be overcome through: planning, growing
price incentives derived from the observed increase of oil prices
and the restructuring of electricity markets (unbundling). Technical
improvements will further propel the wind industry to deliver
ever more affordable, secure and clean electricity at a very high
speed that will be unattainable by more traditional technologies
such as nuclear, natural gas or coal. Wind and solar, accompanied
by hydro power, biomass and geothermal energy will pave the way
to a 100 percent renewable power generation, very probably within
the first half of this century.
āzü[āĆéų