EPIA(2008)による『Solar Generation V - 2008』から
Foreword . . . . . . . . . . . . . . . p. 4
Executive Summary . . . . . . . . . . . p. 7
PV Solar Electricity . frequently asked questions . . p. 11
Solar Basics . . . . . . . . . . . . . . p. 13
The Solar Power Market . . . . . . . . . . p. 21
The Solar Future . . . . . . . . . . . . p. 29
Costs and Competitiveness . . . . . . . . p. 39
Solar Benefits . . . . . . . . . . . . . p. 47
Policy Drivers . . . . . . . . . . . . . p. 57
Global Status of Solar Photovoltaics
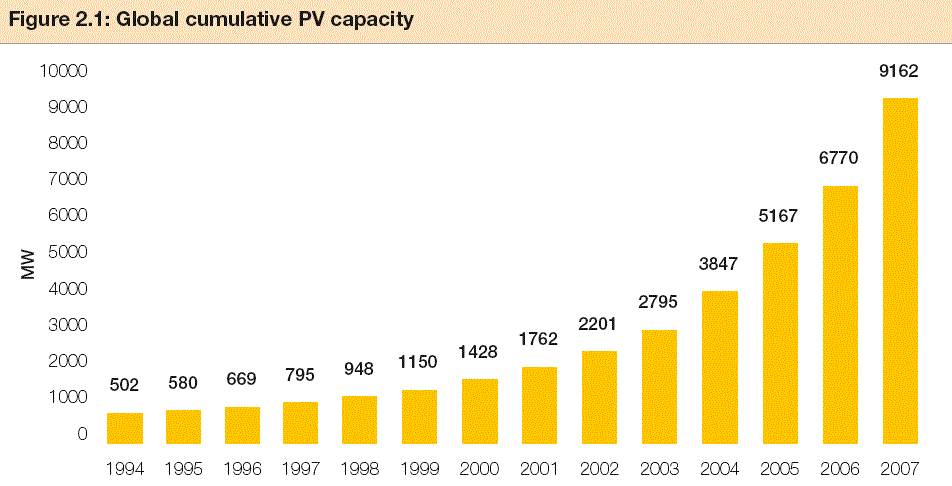
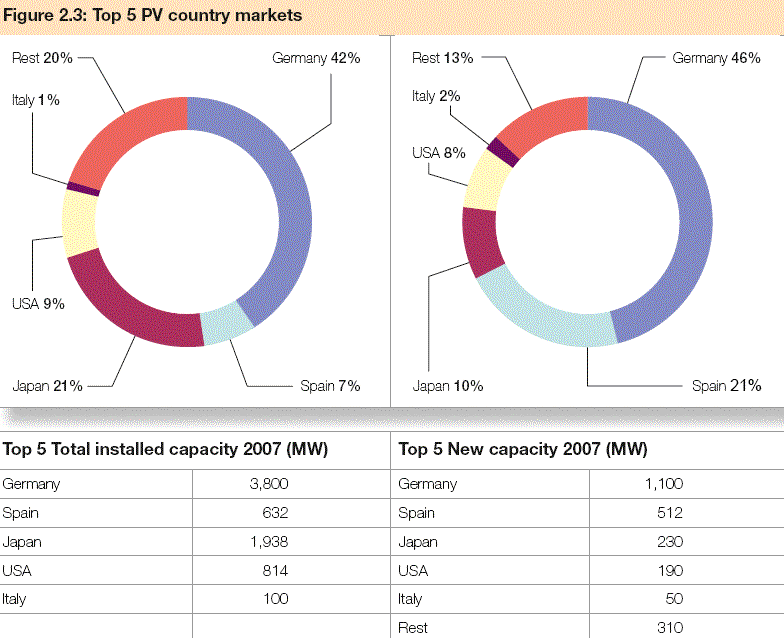
The solar electricity market is booming. By the end of 2007, the
cumulative installed capacity of solar photovoltaic (PV) systems
around the world had reached more than 9,200 MW. This compares
with a figure of 1,200 MW at the end of 2000. Installations of
PV cells and modules around the world have been growing at an
average annual rate of more than 35% since 1998.
Such has been the growth in the solar electricity industry that
it is now worth more than an annual Euro 13 billion.
Competition among the major manufacturers has become increasingly
intense, with new players entering the market as the potential
for PV opens up. The worldwide photovoltaics industry, particularly
in Europe, the USA, China and Japan, is investing heavily in new
production facilities and technologies. At the same time, political
support for the development of solar electricity has led to far-reaching
promotional frameworks being put in place in a number of countries,
notably Germany, Spain, Italy, France, South Korea, USA, etc.
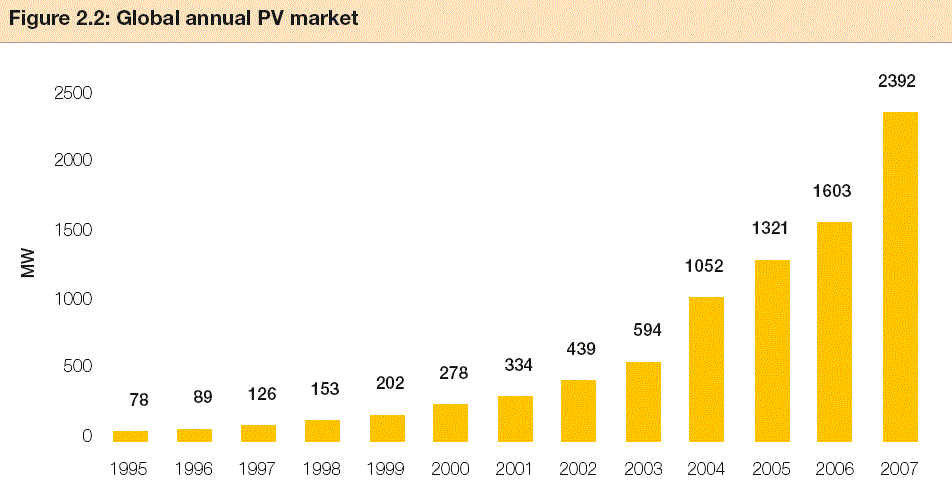
Since the first edition of Solar Generation was published in 2001,
the global PV market has continued to expand at more than the
rate then
predicted (see table below). Although in some countries progress
has been slower than expected, others have exceeded expectations.
The German
market in particular has consistently performed at the upper limit
of its projected expansion rate. Other countries outside the OECD
nations are also showing their determination to develop a solar-powered
future.
This clear commercial and political commitment to the expansion
of the PV industry means that the current surge of activity in
the solar electricity sector represents merely a foretaste of
the massive transformation and expansion expected to occur over
the coming
decades. The target: the realisation of a common goal of substantially
increasing the penetration of solar electricity into the global
energy mix, whilst also cutting greenhouse gas emissions.
Much work still needs to be done to turn potential into reality.
One crucial step is to bring a far broader range of actors into
the sector, particularly in the investment, finance, marketing
and retail areas. At the same time, there is a need to transmit
to as wide an audience as
possible, the message that solar electricity will bring socio-economic,
industrial and environmental benefits to regions which proactively
encourage its uptake.
Solar Generation: A Projection to 2030
Numerous qualitative analyses about the potential market development
of solar photovoltaics have been published in the past. The aim
here has been to compile a detailed quantitative knowledge base,
coupled with clearly defined and realistic assumptions from which
extrapolations could be made on the likely development of the
solar electricity market up to 2030 and beyond.
Taking its lead from success stories like those in Germany or
Spain, this EPIA/Greenpeace report looks forward to what solar
power could achieve - given the right market conditions and an
anticipated fall in costs . over the first three decades of the
twenty-first century. As well as projections for installed capacity
and energy output, it makes assessments of the level of investment
required, the number of jobs which would be created, and the crucial
effect which an increased input from solar electricity will have
on greenhouse gas emissions.
| Annual MW Installations Capacity: Market versus ‘Solar Generation’ Scenario Predictions since 2001 | ||||||||||
| Year | 2001 | 2002 | 2003 | 2004 | 2005 | 2006 | 2007 | 2008 | 2009 | 2010 |
| Market Result | 334 | 439 | 594 | 1,052 | 1,320 | 1,603 | 2,392 | |||
| SG I 2001 MW | 331 | 408 | 518 | 659 | 838 | 1,060 | 1,340 | 1,700 | 2,150 | 2,810 |
| SG II 2004 MW | 985 | 1,283 | 1,675 | 2,190 | 2,877 | 3,634 | ||||
| SG III 2006 MW | 1,883 | 2,540 | 3,420 | 4,630 | 5,550 | |||||
| SG IV 2007 MW | 2,179 | 3,129 | 4,339 | 5,650 | ||||||
| SG V 2008 MW | 4,175 | 5,160 | 6,950 | |||||||
This scenario for the year 2030, is based on the following core inputs:
The following assumptions have been employed:
Global electricity consumption: Two different assumptions
are made for the expected growth in electricity demand. The reference
version is based on the International Energy Agency’s latest World
Energy Outlook (WEO 2007). An alternative version is based on
the Greenpeace/European Renewable Energy Council Energy [R]evolution
Report, which assumes extensive energy efficiency measures. The
PV
contribution is therefore higher under this projection.
Carbon dioxide savings: Over the whole scenario period,
it is estimated that an average of 0.6 kg of CO2 would be saved
per kilowatt hour of output from a solar generator.
There are two versions of the scenario: an Advanced Scenario
based on the assumption that additional support mechanisms will
lead to dynamic worldwide growth; a Moderate Scenario which
assumes a continuing but lower level of political commitment.
The growth rates assumed in these scenarios vary from 40% reducing
to 15% over the scenario period (2030) under the Advanced version,
30% reducing to 10% under the Moderate version.
The two scenario versions are also divided in two ways . into
the four main global market divisions (consumer applications,
grid-connected, remote
industrial and off-grid rural), and into the regions of the world
as defined in projections of future electricity demand made by
the International Energy Agency.
Solar Generation: Key Results of the EPIA/Greenpeace
Analysis
The key results of the EPIA/Greenpeace scenario clearly show that,
even from a relatively low baseline, solar electricity has the
potential to make a major contribution to both future global electricity
supply and the mitigation of climate change. The figures below
are for the Advanced Scenario:
| Global Solar Electricity Output in 2030 |
| 8.9 % of global electricity demand from PV - demand forecast from IEA Reference Scenario |
| 13.8 % of global electricity demand from PV - demand forecast from the Greenpeace Energy [R]evolution Scenario |
| Detailed Projections for 2030 | |
| PV systems cumulative capacity | 1,864 GW |
| Electricity production | 2,646 TWh |
| Grid-connected consumers | 1,280 million |
| Off-grid consumers | 3,216 million |
| Employment potential | 10 million jobs |
| Market value | Euro 454 billion per annum |
| Cost of solar electricity | Euro 7-13 per kWh depending on location |
| Cumulative CO2 savings | 8,953 million tonnes of CO2 |
The capacity of annually installed solar power systems would
reach 281 GW by 2030. About 60% of this would be in the grid-connected
market, mainly in industrialised countries. The total number of
people by then covering their own electricity from a grid-connected
solar system would reach 1,280 million.
Although the key markets are currently located mainly in the industrialised
world, a global shift will result in a significant share . about
20% or an annual market of 56 GW . being taken by the developing
world for rural electrification in 2030. Since system sizes are
much smaller, and the population density greater, this means that
up to 3.2 billion people in developing countries would by then
be using solar electricity. This
would represent a major breakthrough for the technology from its
present emerging status.
Solar Generation: PV’s Contribution to Industry,
Employment and the Environment
As the annual PV market could grow to 281 GW, the PV industry
is facing great chances. For the job seekers of the third decade
of the 21st century, there would be a major contribution towards
their employment prospects. On the assumption that more jobs are
created in the installation and servicing of PV systems than in
their manufacture, the result is that by 2030, around 10 million
full-time jobs would have
been created by the development of solar power around the world.
The majority of those would be in installation and marketing.
By 2030, solar PV would also have had one other important effect.
In environmental terms, it would be reducing annual CO2 emissions
by 1.6 billion t. This reduction is equivalent to the output from
450 coalfired power plants. Cumulative CO2 savings from solar
electricity generation would have reached a level of 9 billion
t.
Policy Recommendations
In order to supply more than 3 billion people with solar electricity
by the year 2030, a major shift in energy policy will be needed.
Experience over the past few years has demonstrated the effectiveness
of joint industrial and political commitment to achieving greater
penetration of solar electricity into the energy mix at local,
national, regional and global levels.
A number of key political actions are required:
Our goal now must be to mobilise the necessary industrial, political and end-user commitment to this technology and, more importantly, the services it provides. We must redouble our efforts to ensure that the generation born today benefits from all the socio-economic and environmental benefits that solar electricity offers.
        EPIA(2008)による『Solar Generation V - 2008』から |