OF 2005-1294-A. Geology
and Nonfuel Mineral Deposits of the United States(179p)
Contents
Contents iii
Abstract 1
Introduction 1
Some basic terms and concepts 3
Overview of geologic and tectonic history 6
Principal commodities and deposit types 8
Metals 10
Beryllium 10
Cobalt 11
Copper 13
Gold 17
Iron ore 21
Lead and zinc 23
Molybdenum 26
Platinum-group elements and nickel 28
Rare-earth elements 31
Silver 33
Titanium 38
Industrial materials 40
Barite 40
Bentonite 42
Boron 44
Bromine 46
Diatomite 47
Garnet 48
Gypsum 49
Kaolin 50
Phosphate rock 51
Potash 53
Salt (halite) 54
Soda ash (sodium carbonate) 56
Talc 58
Regional exploration history and significant recent discoveries
59
Potential for undiscovered mineral resources 62
References cited 65
Figures 79
Appendix 1. Major mineral deposits in the United States
125
Appendix 2. Selected criteria used to identify major mineral
deposits listed in Table 2 of this report 171
Appendix 3. Resource-reserves definitions (USGS, 2004)
172
Tables
Table 1. Value of selected mineral commodities produced in the
United States....................2
Table 2. Beryllium - proportion of world mine production for the
United States...................10
Table 3. Cobalt - proportion of world mine production, reserves,
and reserve base for the United States...11
Table 4. Copper - proportion of world mine production, reserves,
reserve base, and resource base for the United States...13
Table 5. Gold - proportion of world mine production, reserves,
and reserve base for the United States...17
Table 6. Iron ore - proportion of world mine production, reserves,
and reserve base for the United States...21
Table 7. Lead - proportion of world mine production, reserves,
and reserve base for the United States...23
Table 8. Zinc - proportion of world mine production, reserves,
and reserve base for the United States...23
Table 9. Molybdenum - proportion of world mine production, reserves,
and reserve base for the United States...26
Table 10. Platinum-group elements - proportion of world mine production,
reserves, and reserve base for the United States...28
Table 11. Rare-earth elements - proportion of world mine production
in 2002 and 2003, reserves, and reserve base for the United States...31
Table 12. Silver - proportion of world mine production, reserves,
and reserve base for the United States...33
Table 13. Titanium concentrate (ilmenite) - proportion of world
mine production, reserves, and reserve base for the United States...38
Table 14. Barite - proportion of world mine production, reserves,
and reserve base for the United States...40
Table 15. Bentonite - proportion of world mine production for
the United States................42
Table 16. Boron - proportion of world mine production, reserves,
and reserve base for the United States...44
Table 17. Bromine - proportion of world mine production for the
United States...................46
Table 18. Diatomite - proportion of world mine production and
reserves for the United States...47
Table 19. Garnet - proportion of world mine production for the
United States......................48
Table 20. Gypsum - proportion of world mine production for the
United States...................49
Table 21. Kaolin - proportion of world mine production for the
United States.......................50
Table 22. Phosphate rock - proportion of world mine production,
reserves, and reserve base for the United States...51
Table 23. Potassium - proportion of world mine production, reserves,
and reserve base for the United States...53
Table 24. Salt - proportion of world mine production for the United
States...........................54
Table 25. Soda ash - proportion of world mine production, reserves,
and reserve base for the United States...56
Table 26. Talc - proportion of world mine production for the United
States..........................58
Figures
Figure 1. Map of the World showing the areas covered by this series
of regional reports, tectonic plate boundaries, and ocean bathymetry...79
Figure 2. Sketches showing the layered internal structure of the
Earth.................................80
Figure 3. Perspective diagram and cross section of the uppermost
layers of the Earth illustrating the main types of tectonic plate
boundaries...81
Figure 4. A schematic cross-section of the Earth illustrating
three types of mantle plumes...82
Figure 5. A map of the globe showing the distribution of the igneous
rocks associated with selected large igneous provinces (red regions)
that formed in the last 250 million years...83
Figure 6. Map showing the location of the major magmatic and metamorphic
mineral deposits of United States...84
Figure 7. Cross section of the uppermost layers of the Earth illustrating
the distribution of mineral deposits in relation to the main types
of tectonic plate boundaries...85
Figure 8. Map showing the location of the major hydrothermal mineral
deposits of United States...86
Figure 9. Map showing the location of the major sedimentary mineral
deposits of United States...87
Figure 10. Map showing the location of the major surficial mineral
deposits of United States...88
Figure 11. Relative geologic time units used in this report........................................................89
Figure 12. Simplified geologic map of North America................................................................90
Figure 13. Map of North American showing the geology of the North
American craton underlying the sedimentary rocks that cover much
of the continent..91
Figure 14. Summary of selected geologic events and features for
the North American craton in the last 2,000 million years...92
Figure 15. Map showing the location of the major beryllium, copper-cobalt,
copper-nickel-PGE, and platinum-palladium mineral deposits of
United States...93
Figure 16. Cross section schematically illustrating the characteristic
features of an idealized sedimentary-exhalative (sedex) mineral
deposit...94
Figure 17. Simplified geologic map showing the distribution of
metamorphosed sedimentary rocks (Belt-Purcell Supergroup) deposited
in the Middle Proterozoic Belt basin and Cretaceous igneous rocks
related to the Cordilleran orogen...95
Figure 18. Map showing the location of the major copper mineral
deposits of United States...96
Figure 19. Cross section through an idealized stratovolcano, showing
various styles of related mineralization...97
Figure 20. Map illustrating changes in metal content of mineralized
rock and ore deposits in the Bingham district, Utah...98
Figure 21. Map showing the distribution of the Middle Proterozoic
Revett Formation and associated hydrothermal copper-silver mineralization
in northwestern Montana and northern Idaho...99
Figure 22. Map showing selected geologic features and the location
of major sedimentary iron deposits (banded iron formation), magmatic
copper-nickel-PGE deposits, and hydrothermal copper deposits in
basalt...100
Figure 23. Map showing the location of the major gold mineral
deposits of United States...101
Figure 24. Map showing the distribution of sedimentary rock-hosted
gold deposits and mineralization of the Blue-Star area of the
Carlin Trend, Nevada...102
Figure 25. Schematic east-west cross section of northern Nevada
and northwest Utah showing the location of Carlin-type gold deposits
in relation to large tectonic features...103
Figure 26. Schematic cross section that illustrates generalized
patterns of alteration and mineralization of epithermal gold deposits...104
Figure 27. Map showing the location of the major iron, niobium,
rare-earth metals, and titanium mineral deposits of United States...105
Figure 28. Map showing the location of the major lead and zinc
mineral deposits of United States listed...106
Figure 29. Cross section illustrating the essential features of
an idealized volcanogenic massive sulfide deposit...107
Figure 30. Map showing the location of MVT lead-zinc districts
in the Ozark region of the United States...108
Figure 31. Map of southeast Missouri showing location of major
Mississippi Valley ore districts surrounding outcrops of Precambrian
igneous rocks in the St. Francois Mountains...109
Figure 32. Map showing the location of the major molybdenum mineral
deposits of United States...110
Figure 33. Idealized section through an ultramafic-to-mafic layered
igneous intrusion showing the distribution of magmatic ore deposits...111
Figure 34. Map showing the location of the major silver mineral
deposits of United States...112
Figure 35. Map showing heavy mineral deposits in northeastern
Florida and southeastern Georgia...113
Figure 36. Map showing the location of the major barite, garnet,
and talc mineral deposits of United States...114
Figure 37. Map showing the location of the major sodium bentonite,
phosphate rock, diatomite, kaolin, and limestone mineral deposits
of United States...115
Figure 38. Map showing the location of the major gypsum, boron,
bromine, salt, potash, and sodium carbonate mineral deposits of
United States...116
Figure 39. Map showing the location of the major phosphorite deposits
relative to the Miocene geologic framework of the southeast Atlantic
Coastal Plain-continental shelf system...117
Figure 40. Map showing the distribution the location of major
salt and potash deposits in evaporite basins in North America
showing. Modified from Kesler (1994)...118
Figure 41. Map showing the distribution of the Green River Formation
and the location of sodium carbonate deposits in Utah, Colorado,
and Wyoming...119
Figure 42. Map showing the thickness of trona bed 17 and Wyoming
state mine permit areas...120
Figure 43. Charts showing the density of exploration sites for
selected regions of the United States...121
Figure 44. Graph showing the number of active mining claims held
on public lands in the United States from 1976 to 2003...122
Figure 45. Graph showing the number of active mining operations
in the United States from 1979 to 2002...123
Abstract
This report, which is one of a series of reports summarizing
the World’s endowment of nonfuel mineral resources, describes
the location and general geologic setting of deposits of major
mineral commodities in the United States. The discussion in this
report focuses on those commodities produced in the United States
that constituted at least 5 percent of global production or global
reserve base in 2003 or had at least $100 million production value
in 2001. The discussion for each commodity begins with a brief
description of the chemical and physical properties of the material
and how it is used. The importance of the commodity in the United
States relative to the world is also presented. However, most
of the discussion emphasizes the geology of mineral commodities
. the important mineral deposit types, their geologic setting,
and the processes that led to their formation. A compilation of
almost 400 major mineral deposits in the United States is included
as an appendix.
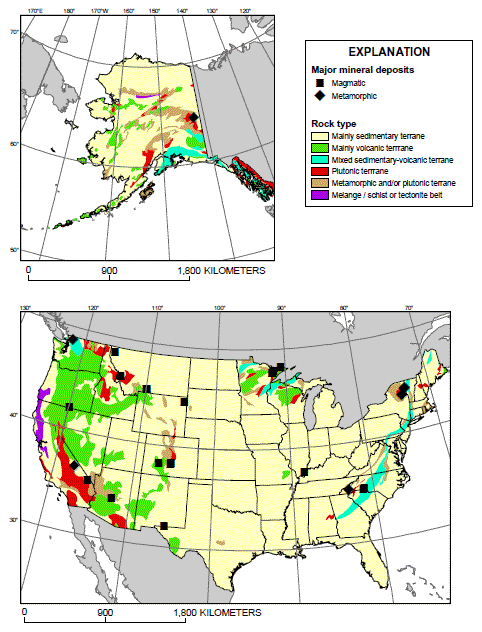
Figure 6. Map showing the location of the major magmatic
and metamorphic mineral deposits of United States listed
in appendix 1. Geologic base is derived from Geological Survey
of Canada (1995).
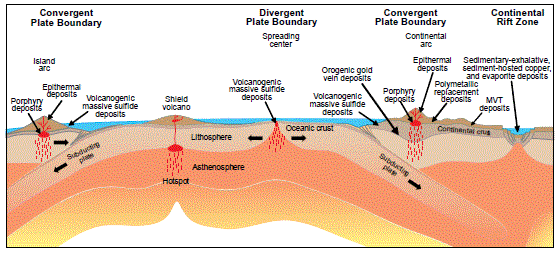
Figure 7. Cross section of the uppermost layers of the Earth
illustrating the distribution of mineral deposits in relation
to the main types of tectonic plate boundaries.
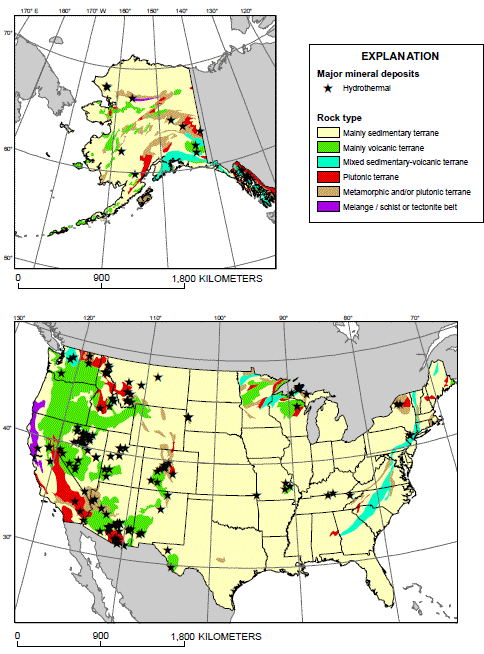
Figure 8. Map showing the location of the major hydrothermal
mineral deposits of United States listed in appendix 1. Geologic
base is derived from Geological Survey of Canada (1995).
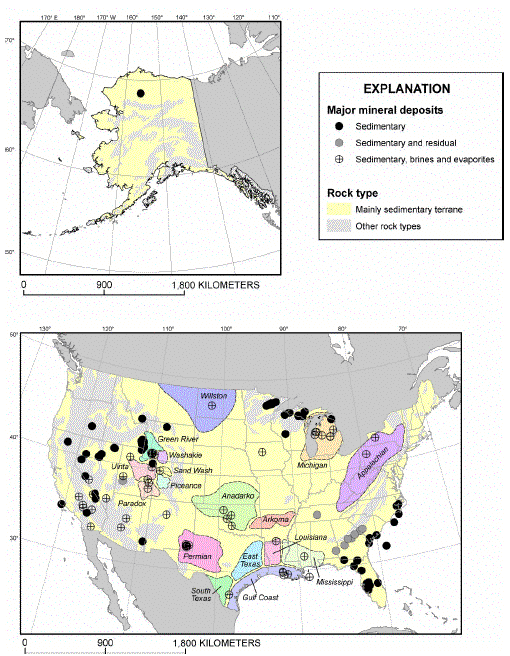
Figure 9. Map showing the location of the major sedimentary
mineral deposits of United States listed in appendix 1. The
map also shows the extent of sedimentary basins mentioned in
the report. Geologic base is derived from Geological Survey of
Canada (1995) and sedimentary basins are from St. John (2000).
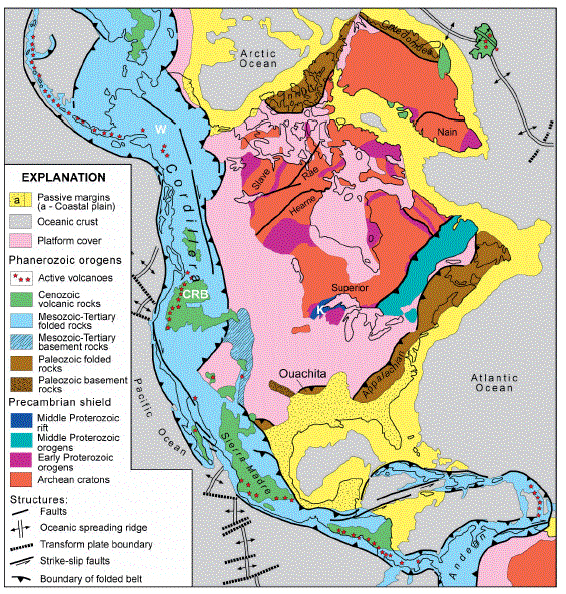
Figure 12. Simplified geologic map of North America.
Modified from Bally and others (1989) and Hoffman (1989). White
labels are: CRB . Columbia River flood basalt province; K . Keweenawan
flood basalt province; and W, Wrangellia flood basalts.
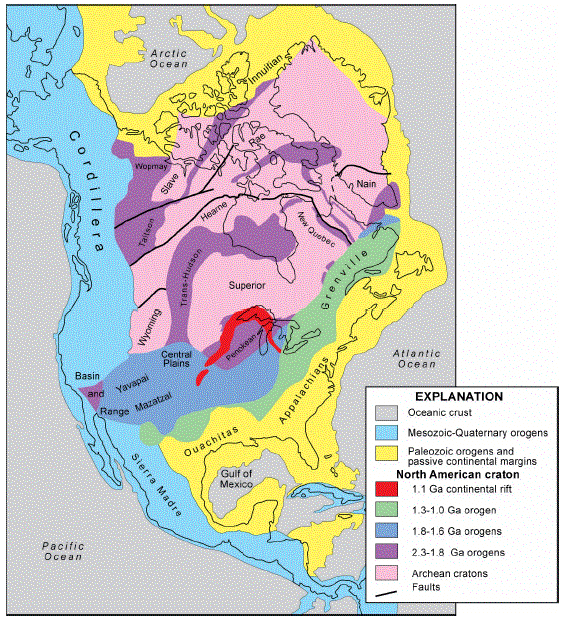
Figure 13. Map of North American showing the geology of the
North American craton underlying the sedimentary rocks
that cover much of the continent. Modified from Hoffman (1989).
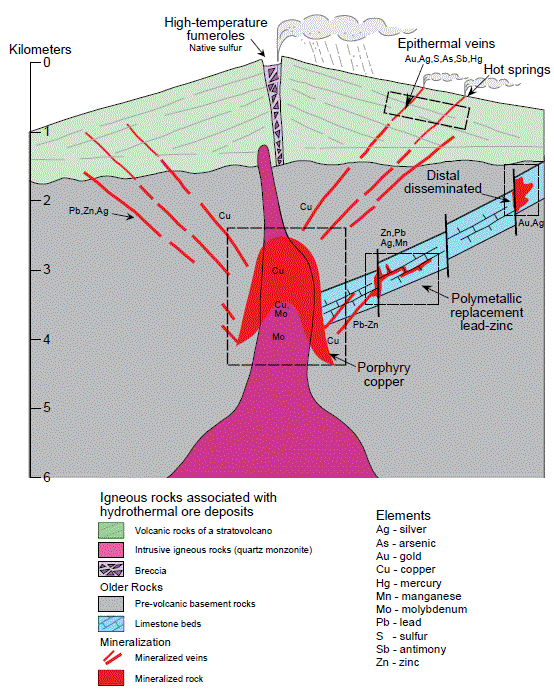
Figure 19. Cross section through an idealized stratovolcano,
showing various styles of related mineralization.
USGSによる『Geology
and Nonfuel Mineral Deposits of the United States』から |
戻る


